Transcription
IBM SoftwareBusiness AnalyticsIBM SPSS Custom Tables 20IBM SPSS Custom TablesCreate custom tables in no timeHighlightsEasily summarize and share youranalytical results. uild tables quickly and easily usingBdrag-and-drop functionality review tables as you build them andPmake changes in real time xclude specific categories, displayEmissing value cells, add subtotals to yourtable, and more Easily export tables to Microsoft Word,Microsoft Excel or MicrosoftPowerPoint for use in reports Automate the reports you use frequentlyYou often report the results of your analyses to decision makers,colleagues, clients, grant committees or others. Building tabularreports, however, can be a time-consuming, trial-and-error process.IBM SPSS Custom Tables enables you to view your tables as you buildthem, so you can create polished, accurate tables in less time.SPSS Custom Tables makes it easy for you to summarize your IBMSPSS Statistics data in different styles for different audiences. Itsbuild-as-you-go interface updates in real time, so you always knowwhat your tables will look like. You can add descriptive and inferentialtest statistics, for example, and then customize the table so youraudience can easily understand the information. When your tables arecomplete, you can export them to Word, Excel and PowerPoint, as wellas HTML.This software is ideal for anyone who creates and updates reports ona regular basis, including people who work in survey or market research,the social sciences, database or direct marketing and institutional research.
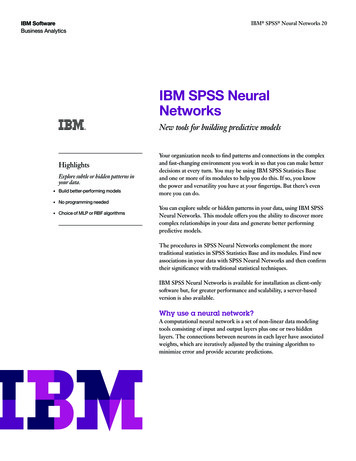
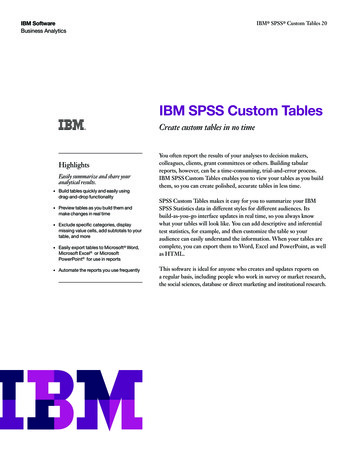
IBM SoftwareBusiness AnalyticsIBM SPSS Custom Tables 20SPSS Custom Tables offers features that make it easier thanever to deliver information your colleagues can act on withoutfurther processing. These capabilities include: Calculated output fields – Save time and effort by creatingnew fields directly in your Custom Tables output, and usingthem to perform calculations (e.g., sum, difference,percentage difference) on output categoriesSignificance test results in the output – The results ofsignificance tests are shown directly in SPSS Custom Tablesoutput instead of in a separate table, removing the need tocombine findings manuallyAn interactive table builder – Preview your tables as youcreate themCategory management – Exclude specific categories, displaymissing value cells and add subtotals to your tableSignificance tests – Chi-square test of independence,comparison of column means (t test) or comparison ofcolumn proportions (z test)Easy export of tables to Word, Excel or PowerPoint for usein reportsSPSS Custom Tables has an intuitive graphical user interface that takesthe guesswork out of building tables. Drag your desired variables to thetable builder. As shown in this screen, you can preview the category list(lower left corner) before dragging the desired categories to the table.Customize your tablesThis product is available for installation as client-onlysoftware but, for greater performance and scalability, itcan also be used in a client/server installation.Display information the way you want to with the categorymanagement features in SPSS Custom Tables. Create totalsand subtotals without changing your data file. You cancombine several categories into a single category, for example,for frequent top- and bottom-box analyses. You can also sortcategories within your table without affecting the subtotalcalculation.Preview tables as you build themThe SPSS Custom Tables intuitive graphical user interfacetakes the guesswork out of building tables. Its drag-and dropcapabilities and preview pane enable you to see what yourtables will look like before you click “OK.”Make your tables more precise, as you create them, bychanging variable types or excluding categories. You candisplay or exclude categories with no counts for clearer andmore concise output. Or sort and rank categories based oncell values for a neater, more informative table.You can interact with the variables on your screen, identifyvariables as categorical or scale values and know immediatelyhow your data are structured.To create a table, just drag your desired variables into thetable preview builder. You don’t have to write complicatedsyntax or work with dialog boxes. And you can move variableseasily from row to column for precise positioning. The tablepreview builder updates after every change you make, so youcan see the formatting effect immediately. You can also add,swap and nest variables, or hide variable labels, directly fromwithin the table preview builder. And you can collapse large,complex tables for a more concise view, and still see yourvariables.2
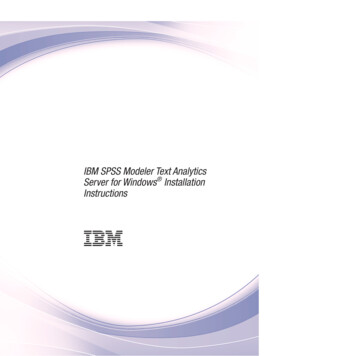
IBM SoftwareBusiness AnalyticsIBM SPSS Custom Tables 20Get in-depth analysesYou can use SPSS Custom Tables as an analytical tool tounderstand your data better and create tables that presentyour results most effectively. Give your readers reportsthat enable them to delve into the information and makewell-informed decisions.Highlight opportunities or problem areas in your resultswhen you include inferential statistics. Using inferential teststatistics enables you to compare means or proportions fordemographic groups, customer segments, time periods orother categorical variables. You can also identify trends,changes or major differences in your data.Two-dimensional crosstabulation: This example shows the relationshipbetween two categorical variables, Age and Gender. Using Age as therow variable and Gender as the column variable, you can create atwo-dimensional crosstab that shows the number of males and femalesin each age category.You can also select summary statistics, which includeeverything from simple counts for categorical variables tomeasures of dispersion. Summary statistics for categoricalvariables and multiple response sets include counts and a widevariety of percentage calculations, including row, column,subtable, table and valid N percentages. Summary statisticsfor scale variables and custom total summaries for categoricalvariables include mean, median, percentiles, sum, standarddeviation, range and minimum and maximum values. To focuson specific results, you can sort categories by any summarystatistic you used.Multiple response set: Multiple response sets use multiple variablesto record responses to questions for which the respondent can givemore than one answer. When asked the question, “Which of thefollowing sources do you rely on for news,” respondents could selectany combination of five possible choices. Notice that the percentagestotal more than 100 percent because each respondent may choose morethan one answer. You can also perform significance tests on multipleresponse variables.Control your table outputMany time-saving features in SPSS Custom Tables help youcreate tables with just the look you want. You can: Add titles and captionsUse table expressions in titlesSpecify minimum and maximum column widths forindividual tables during table creationAnd, when used with IBM SPSS Statistics Base, you can accessadditional features such as TableLooks and scripts, whichallow you to automate formatting and other repetitive tasks.3
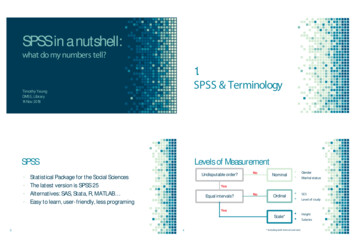
IBM SoftwareBusiness AnalyticsIBM SPSS Custom Tables 20Save time and effort by automatingfrequent reportsDo you regularly create reports that have the same structure?Do you spend a lot of time updating reports? Use syntax andautomation in IBM SPSS Custom Tables to run frequentlyneeded reports in production mode.When you create a table, SPSS Custom Tables records everyclick you make and saves your actions as syntax. To runan automated report, you simply paste the relevant syntaxinto a syntax window, then just click and go. With syntaxand automation, your report is ready quickly and easily.Show significance test results in the output: The results of significancetests can now be shown directly in SPSS Custom Tables output insteadof in a separate table, removing the need to combine findings manually.In line with APA guidelines, values in the same row with differentsubscripts are not significantly different (p 0.5).New, flexible implementation optionsOur suite of statistical software is now available in threeeditions: IBM SPSS Statistics Standard, IBM SPSS StatisticsProfessional and IBM SPSS Statistics Premium. By groupingessential capabilities, these editions provide an efficient wayto ensure that your entire team or department has the featuresand functionality they need to perform the analyses thatcontribute to your organization’s success.Share results more easily with othersOnce you have results, you need to put them in the hands ofthose who need them. SPSS Custom Tables enables you tocreate results as interactive pivot tables for export to Wordor Excel. This not only improves your workflow, it saves timebecause you don’t have to reconfigure your tables in Wordor Excel. No editing is required after you export your tables.You can, however, insert descriptive content if you choose to.Gain greater value with collaborationTo share and re-use assets efficiently, protect them in waysthat meet internal and external compliance requirements, andpublish results so that a greater number of business users canview and interact with them, consider augmenting SPSSCustom Tables with IBM SPSS Collaboration andDeployment Services. More information about these valuablecapabilities can be found at www.ibm.com/spss/cds.4
IBM SoftwareBusiness AnalyticsIBM SPSS Custom Tables 20FeaturesTest statisticsGraphical user interface Simple, drag-and-drop table builder interface enables you topreview tables as you select variables and optionsSingle, unified table builder, instead of multiple menuchoices and dialog boxes for different table types, makesbuilding tables easier Control contents Create tables with up to three display dimensions: Rows(stub), columns (banner), and layersNest variables to any level in all dimensionsCrosstabulate multiple independent variables in the sametableDisplay frequencies for multiple variables side by side withtables of frequenciesDisplay all categories when multiple variables are included ina table, even if a variable has a category without responsesDisplay multiple statistics in rows, columns or layersPlace totals in any row, column or layerCreate subtotals for subsets of categories of a categoricalvariablePerform calculations (e.g., sum, difference, percentagedifference) on output categories, and display the results innew fields created directly in SPSS Custom Tables output–– No limit on the number of calculated fieldsShow significance test results directly in the output insteadof in a separate table–– No need to combine findings in a Word document–– Complies with APA guidelinesCustomize your control over category display order andselectively show or hide categoriesBetter control how you display your data using expandedcategory options:–– Sort categories by any summary statistic in your table–– Hide the categories that comprise subtotals – you canremove a category from the table without removing itfrom the subtotal calculation 5Select from these significance tests:–– Chi-square test of independence–– Comparison of column means (t test)–– Comparison of column proportions (z test)Select from these summary statistics: Count, count row %,count column %, count table %, count subtable %, layer %,count table row %, count table column %, valid N row %,valid N column %, valid N table %, valid N subtable %,valid N layer %, valid N table row %, valid N table column%, total N row %, total N column %, total N table %, totalN subtable %, total N layer %, total N table row %, total Ntable column %, maximum, mean, median, minimum,missing, mode, percentile, percentile 05, percentile 25,percentile 75, percentile 95, percentile 99, range, standarderror (SE) mean, standard deviation (SD), sum, total N,valid N, variance, sum row %, sum column %, sum table %,sum subtable %, sum layer %, sum table row % and sumtable column %Calculate statistics for each cell, subgroup or tableCalculate percentages at any or all levels for nested variablesCalculate counts and percentages for multiple responsevariables based on the number of responses or the numberof casesSelect percentage bases for missing values to include orexclude missing responsesExclude subtotal categories from significance testsRun significance tests on multiple response variables
IBM SoftwareBusiness AnalyticsIBM SPSS Custom Tables 20Formatting controls Printing formatsDirectly edit any table element, including formatting andlabelsSort tables by cell contents in ascending or descending orderAutomatically display labels instead of coded valuesSpecify minimum and maximum width of table columns(overrides TableLooks)Show a name, label or both for each table variableDisplay missing data as blank, zero, “.,” or any otheruser-defined term, such as “missing”Set titles for pages and tables to be multiple lines with left,right or center justificationAdd captions for pages or tablesSpecify corner labelsCustomize labels for statisticsDisplay the entire label for variables, values and statisticsFormat numerical results: Commas, date/time, dollars, F(standard numeric), negative parentheses, “N ,” parentheses(around numbers of percentages), percentages andcustomized formatsApply preformatted TableLooks to resultsDefine the set of variables that is related to multiple responsedata and save it with your data definition for subsequentanalysisAccepts both long- and short-string elementary variablesImposes no limit on the number of sets that can be definedor the number of variables that can exist in a setAll results are produced as Statistics pivot tables so you canexplore your results more easily with the pivot feature–– Rearrange columns, rows, and layers by dragging iconsfor easier ad hoc analysis–– Toggle between layers by clicking on an icon for easiercomparison between subgroups–– Reset a table to its original organization with a simplemenu choice–– Rotate even the outermost nests in the stub, banner andlayer to uncover information that can be easily hiddenin large reports Two-stage least squares (2SLS)Helps control for correlations between predictor variables anderror terms Use structural equations and instrumental variablesSet control for correlations between predictor variables anderror termsDisplay output in pivot tablesProbitEvaluates the value of stimuli using a logit or probittransformation of the proportion responding Transform predictors: Base 10, natural or user-specified base(including none)Allow for natural response rate estimates or specify themyourselfUse algorithm control parameters: Convergence, iterationlimit and heterogeneity criterion probabilitySelect from the following statistics: Frequencies, fiducialconfidence intervals, relative median potency, test ofparallelism, plots of observed probits or logitsDisplay output in pivot tablesSystem requirementsRequirements vary according to platform. For details, seewww.ibm.com/spss/requirements.Syntax Print more than one table per pageSpecify page layout: Top, bottom, left and right margins;page lengthUse the global break command to produce a table for eachvalue of a variable when the variable is used in a seriesof tablesSyntax converter translates syntax created in versions earlierthan SPSS Tables 11.5 into CTABLES syntax6
IBM SoftwareBusiness AnalyticsIBM SPSS Custom Tables 20About IBM Business AnalyticsIBM Business Analytics software delivers actionable insightsdecision-makers need to achieve better business performance.IBM offers a comprehensive, unified portfolio of businessintelligence, predictive and advanced analytics, financialperformance and strategy management, governance, risk andcompliance and analytic applications.With IBM software, companies can spot trends, patterns andanomalies, compare “what if” scenarios, predict potential threatsand opportunities, identify and manage key business risks andplan, budget and forecast resources. With these deep analyticcapabilities our customers around the world can betterunderstand, anticipate and shape business outcomes.For more informationFor further information or to reach a representative please visitibm.com/analytics.Request a callTo request a call or to ask a question, go to ibm.com/businessanalytics/contactus. An IBM representative will respond to yourinquiry within two business days.7
Copyright IBM Corporation 2011IBM CorporationRoute 100Somers, NY 10589US Government Users Restricted Rights – Use, duplication of disclosurerestricted by GSA ADP Schedule Contract with IBM Corp.Produced in the United States of AmericaMay 2011All Rights ReservedIBM, the IBM logo, ibm.com, Cognos, and SPSS are trademarks orregistered trademarks of International Business Machines Corp.,registered in many jurisdictions worldwide. Other product and servicenames might be trademarks of IBM or other companies. A current listof IBM trademarks is available on the Web at “Copyright and trademarkinformation” at www.ibm.com/legal/copytrade.shtml.SPSS is a trademark of SPSS, Inc., an IBM Company, registered in manyjurisdictions worldwide.Microsoft, Windows, Windows NT, and the Windows logo are trademarksof Microsoft Corporation in the United States, other countries, or both.Other company, product or service names may be trademarks or sevicemarks of others.P26393Please RecycleYTD03009-USEN-04
IBM SPSS Custom Tables 20. 2. SPSS Custom Tables has an intuitive graphical user interface that takes the guesswork out of building tables. Drag your desired variables to the table builder. As shown in this screen, you can preview the category list (lower left corner) before dragging the desired categories to the table.