Transcription
Monitoring Tomcat with JMX
Christopher SchultzChief Technology OffcerTotal Child Health, Inc.* Slides available on the Linux Foundation / ApacheCon2014 web site and athttp://people.apache.org/ schultz/ApacheCon NA 2014/Tomcat Monitoring/
Java Management Extensions Protocol and API for managing and monitoring–––– Access data via JMX “Mbeans”Read and write bean attributesInvoke operationsReceive notificationsJVM exposes certain statusTomcat exposes certain status
Monitoring JVM Heap statusTotal, free, used memoryGarbage collectionGC pause times
Monitoring Tomcat Status of connectorStatus of request-processor thread poolStatus of data sourcesRequest performance
JMX Tools jconsole (JDK)VisualVM (JDK, app bundle)Most profilers (e.g. YourKit, etc.)Custom tools using javax.management AP
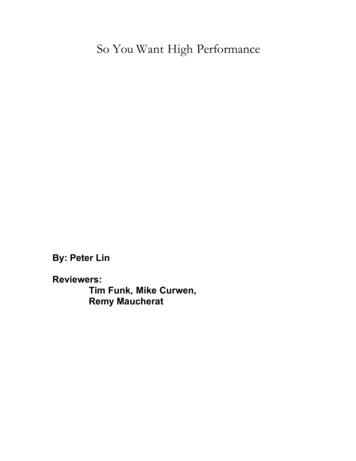
Monitoring JVM: Heap
Monitoring Tomcat Status of data sourcesStatus of requestprocessor thread poolRequest performanceSession information
Monitoring Tomcat Status of data sourcesStatus of requestprocessor thread poolRequest performanceSession information
Monitoring Tomcat: Requests
Monitoring Tomcat: Requests
Monitoring Tomcat: Requests
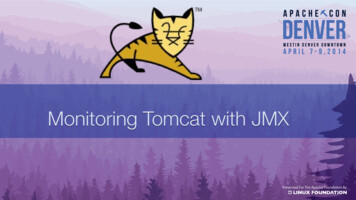
Monitoring Tomcat Status of data sourcesStatus of requestprocessor thread poolRequest performanceSession information
Monitoring Tomcat: Sessions
Monitoring Tomcat Status of data sourcesStatus of requestprocessor thread poolRequest performanceSession information
Monitoring Tomcat: DataSources
Monitoring Tomcat Status of data sourcesStatus of requestprocessor thread poolRequest performanceSession information
Monitoring Tomcat: Threads
Monitoring Tomcat: Threads
Monitoring Tomcat: Threads
Monitoring Tomcat: Threads
Monitoring Your Application Monitor Application ProcessesPerformance MetricsOn-the-fly re-configuration
Monitoring Your Application Write an MBean– Create an Interface: FooMBean– Create an Implementation: Foo– Create an XML MBean descriptorDeploy package to Tomcat– Publish the MBean to the MBean serverQuery / invoke as necessary* Example code will be available athttp://people.apache.org/ schultz/ApacheCon NA 2014/Tomcat Monitoring/
Example MBean Servlet Filter that captures total requestprocessing time– Timestamp prior to request– Timestamp after request– Add the delta to a JMX-accessible counter:RequestStats
RequestStats MBean Write an MBeanpublic interface RequestStatsMBean {public long getProcessingTime();public long getRequestCount();public void resetCounters();}public class RequestStatsimplements RequestStatsMBean {[.]public void updateStats(longtimestamp, ServletRequest request, longelapsed) incrementAndGet();}public long getProcessingTime(){return totalElapsedTime.get();}public long getRequestCount() {return requestCount.get();}public void resetCounters() {totalElapsedTime.set(0l);requestCount.set(0l);}}
RequestStats MBean Write an MBean descriptor mbeans-descriptors operation mbean name "RequestStats" . name "resetCounters" operation name "getProcessingTime"description "Resets alldescription "Gets the total number ofcounters."milliseconds spent processing requests."impact "ACTION"impact "INFO"returnType "void" / returnType "long" / /mbean operation name "getRequestCount"description "Gets the total number /mbeans-descriptors of requests processed."impact "INFO"returnType "long" /
RequestStats MBean Create JAR––– Java interfaceJava implementationmbeans-descriptors.xmlPut JAR into CATALINA BASE/lib
RequestStats MBeanWrite the Filter public void init(FilterConfig config) {MBeanServer server getServer();server.registerMBean( stats, newObjectName("Example:RequestStats RequestStats,name " filterName;));}public void doFilter(.) {timestamp elapsed System.currentTimeMillis();chain.doFilter(request, response);elapsed System.currentTimeMillis() - elapsed;stats.updateStats(timestamp, request, elapsed);}
RequestStats MBeanMap the Filter filter filter-name servlet-request-stats /filter-name filter-class filters.RequestStatsFilter /filter-class init-param param-name name /param-name param-value servlets /param-value /init-param /filter filter-mapping filter-name servlet-request-stats /filter-name url-pattern /servlets/* /url-pattern /filter-mapping filter filter-name jsp-request-stats /filter-name filterclass filters.RequestStatsFilter /filter-class init-param param-name name /paramname param-value jsps /param-value /init-param /filter filter-mapping filter-name jsp-request-stats /filter-name url-pattern /jsp/* /urlpattern /filter-mapping
RequestStats MBean
RequestStats MBean
Automated Monitoring Remote AccessLarge ScaleConstant
Automated Monitoring Remote AccessLarge ScaleConstantNeed more tools!
Automated Monitoring st community version available
Automated Monitoring
Nagios Monitoring Plug-in architecture (i.e. arbitrary scripts)Freely-available JMX plug-in: check jmx ./check jmx rmi\-O java.lang:type Memory -A NonHeapMemoryUsage -K used\-w 29000000 -c 30000000JMX WARNING NonHeapMemoryUsage.used 29050880
Nagios Monitoring Problems with check jmx–––Complex configuration for remote JMXJVM launch for every checkCourse-grained authentication options
Nagios Monitoring Alternative Option: Tomcat's JMXProxyServlet––JMX data available via HTTPCan use Tomcat's authentication tools ./check jmxproxy -U 'http://localhost/manager/jmxproxy?get java.lang:type Memory&att HeapMemoryUsage&key used' \-w 29000000 -c 30000000JMX CRITICAL: OK - Attribute get 'java.lang:type Memory' HeapMemoryUsage - key 'used' 100875248* check jmxproxy can be found athttp://wiki.apache.org/tomcat/tools/check jmxproxy.pl
Nagios Monitoring
JMX Command-line Tricks Show all logged-in usernamesfor sessionid in wget -O - 'http://user:pwd@host/manager/jmxproxy?invoke Catalina:type Manager,context /myapp,host localhost&op listSessionIds' \ sed -e "s/ /\n/g" grep ' [0-9A-Za-z]\ \(\.*\)\? ' ;\do wget -O – "http://user:pwd@host/manager/jmxproxy?invoke Catalina:type Manager,context /myapp,host localhost&op getSessionAttribute&ps sessionid,user" ; done 2 /dev/null \ grep User
Tracking Values Over Time Some metrics are best observed as deltas–– Session countRequest error countRequires that you have a history of dataRequires that you consult the history of that datacheck jmxproxy provides such capabilities
Tracking Values Over Time ./check jmxproxy -U 'http://localhost/manager/jmxproxy?get java.lang:type Memory&att HeapMemoryUsage&key used' -w 33554432 -c 50331648 --write number.out--compare number.outJMX OK: OK - Attribute get 'java.lang:type Memory' - HeapMemoryUsage - key 'used' 102278904,delta [.] ./check jmxproxy -U 'http://localhost/manager/jmxproxy?get java.lang:type Memory&att HeapMemoryUsage&key used' -w 33554432 -c 50331648 --write number.out--compare number.outJMX OK: OK - Attribute get 'java.lang:type Memory' - HeapMemoryUsage - key 'used' 113806144,delta 11527240 ./check jmxproxy -U 'http://localhost/manager/jmxproxy?get java.lang:type Memory&att HeapMemoryUsage&key used' -w 33554432 -c 50331648 --write number.out--compare number.outJMX OK: OK - Attribute get 'java.lang:type Memory' - HeapMemoryUsage - key 'used' 109264056,delta -4542088
Tracking Values Over Time Session count– Tomcat actually provides this already via Manager'ssessionCreateRate attributeRequest errors ./check jmxproxy -U 'http://localhost/manager/jmxproxy?get Catalina:type RequestProcessor,worker "http-nio-127.0.0.18217",name HttpRequest1&att errorCount' -w 1 -c 10 --write errors.txt --compareerrors.txtJMX OK: OK - Attribute get 'Catalina:type RequestProcessor,worker "http-nio127.0.0.1-8217",name HttpRequest1' - errorCount 0, delta 0
Detecting OutOfMemory Many sources of OOME––––Heap exhaustionPermGen exhaustionHit thread limitHit file descriptor limit
Detecting OutOfMemory Two types of heap OOME–– One thread generates lots of local referencesAll threads collaborate to generate globallyreachable objects (e.g. session data)Former is recoverable, latter is notYou want to be notified in any case
Memory Pool Thresholds
Memory Pool Thresholds
Memory Pool Thresholds
Memory Pool Thresholds
Memory Pool Thresholds Choice of how to detect exceededthreshold conditions––Polling using check jmxproxyRegister a notification listener from Java Have that listener take some action
Detect OutOfMemory Monitoring Memory Thresholds–––––––Set threshold on startupRegister a notification listener (callback)Watch “exceeded” count (poll)Report to monitoring software (Nagios)Repeat for each memory pool you want to watchHope the JVM does not fail during notificationThis is getting ridiculous
Detecting OutOfMemory JVM has an easier wayUse -XX:OnOutOfMemoryError to run acommand onfirst OOME detected by theJVMNeed a command to notify Nagios
Notify Nagios on OOME Script that wraps curl curl -si \--data-urlencode 'cmd typ 30' \--data-urlencode 'cmd mod 2' \--data-urlencode "host myhost" \--data-urlencode "service JVM:Heap:OOME" \--data-urlencode "plugin state 2" \--data-urlencode "plugin output OOME CRITICAL" cript can be found at ssivecheck.sh
Monitoring Tomcat with JMX JMX Provides Monitoring and Management of JVMsTomcat exposes a great amount of information via JMXApplications can expose anything to JMX via MBeansJRE ships with tools for light JMX interactionPractical use of JMX requires some additional tools
Resources Presentation Slideshttp://people.apache.org/ schultz/ApacheCon NA 2014/Tomcat Monitoring/ Nagios passive-check end-passive-check.sh check jmxproxyhttp://wiki.apache.org/tomcat/tools/check jmxproxy.pl Special thanks to Christopher Blunck (MBeans info)http://oss.wxnet.org/mbeans.html
Monitoring Tomcat with JMX
Christopher SchultzChief Technology OffcerTotal Child Health, Inc.* Slides available on the Linux Foundation / ApacheCon2014 web site and athttp://people.apache.org/ schultz/ApacheCon NA 2014/Tomcat Monitoring/I'm essentially a DevOps CTO, and everything I'mpresenting today has been something I've had to doin my own work in that regard. My own monitoringwork is very much a work in progress.This is an introduction to monitoring Tomcat andeven JVM processes in general. Nothing I'm going topresent is particularly earth-shattering or difficult tounderstand. And that's good news!There is really no need to consider why monitoring isnecessary, so let's just jump right in.
Java Management Extensions Protocol and API for managing and monitoring–––– Access data via JMX “Mbeans”Read and write bean attributesInvoke operationsReceive notificationsJVM exposes certain statusTomcat exposes certain statusManage and monitor JVM processes.Everything is MBeansRead/write attributesInvoke operationsReceive notificationsBoth the JVM and Tomcat expose these types ofthings via JMX.
Monitoring JVM HeapTotal,statusfree, used memoryGarbage collectionGC pause timesThe JVM exposes a lot about its internal state. Hereare some of the more interesting items.
Monitoring Tomcat StatusStatusofofconnectorrequest-processor thread poolStatus of data sourcesRequest performanceTomcat has a great deal of information available aswell. Here's a sample of what's there.
JMX Tools jconsole (JDK)VisualVM (JDK, app bundle)Most profilers (e.g. YourKit, etc.)Custom tools using javax.management APIWhile JMX is an API protocol, you don't need toknow or understand either of them to benefit: toolsalready exist.You can always write your own if you needsomething special.
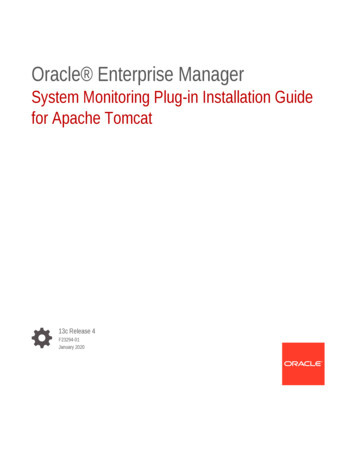
Monitoring JVM: HeapAn example of the JVM's exposure of the Javaheap's usage: initial and maximum values areavailable as well as the currently-used measurement.Notice the NonHeapMemoryUsage attribute whichhas not yet been “expanded” as theHeapMemoryUsage attribute has. Both of theseattribute values are represented by objects thatcontain multiple name-value pairs. The object thatstores these pairs also indicates the data type ofeach value and can include descriptive informationfor a client as well.
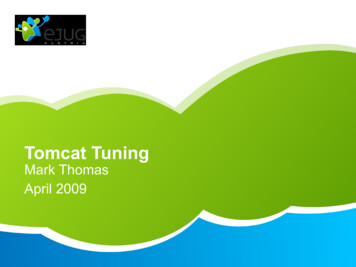
Monitoring Tomcat Status of data sourcesStatus of requestprocessor thread poolRequest performanceSession informationImage: sceenshot from VisualVM of Tomcat's MBeantree.Tomcat provides a wealth of information about itsinternal state. Much of this information is merelyconfiguration values that are read on startup and donot change over time.There is, however, a great deal of real-time dataavailable about the servlet container and its variouscomponents. I'll dive into these practical examples todemonstrate the rich data that is available.I'm going to cover these out-of-order with respect tothe top-to-bottom order shown above in order toease-into some of the concepts.
Monitoring Tomcat Status of data sourcesStatus of requestprocessor thread poolRequest performanceSession informationTomcat tracks the performance of requests (inaggregate) for each connector separately. AGlobalRequestProcessor exists for each connectorwhere you can obtain information about theperformance of the requests handled by thatparticular connector.
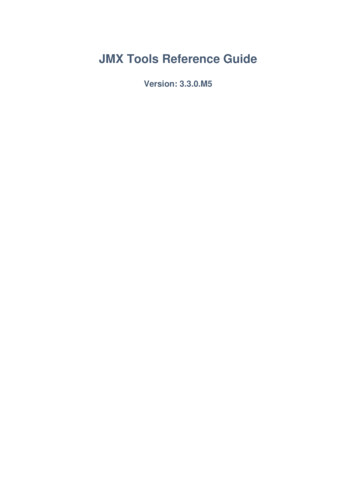
Monitoring Tomcat: RequestsHere is a view of one of Tomcat'sGlobalRequestProcessors. I happen to have 3connectors configured, and you can tell them apartby their names which also indicate a lot about them:protocol, interface address, and port number willuniquely identify any connector'sGlobalRequestProcessor.These GlobalRequestProcessors keep track ofmetrics about requests such as the number ofrequests, the cumulative processing time of thoserequests, and the overall volume of data processed.
Monitoring Tomcat: RequestsAny MBean can support operations that can becalled via the JMX APIs. TheGlobalRequestProcessor beans have a singleoperation: resetCounters. This operation as youmight guess resets all the collected metrics for theGlobalRequestProcessor to zero.
Monitoring Tomcat: RequestsAll values zeroed-out!Resetting these counters can be useful if you want tomonitor performance data over time and want toperiodically reset the state of the connector's metrics.
Monitoring Tomcat Status of data sourcesStatus of requestprocessor thread poolRequest performanceSession informationSessions are another thing you might want to keeptrack of: too many sessions can bog-down a serverand cause performance problems. The real problemis storing lots of data in the session, or course, butthe number of sessions can be an important datapoint in your server monitoring strategy.
Monitoring Tomcat: SessionsMost useful attributes shown here: activeSessions,maxActive, and expiredSessions. One attribute thatis not shown is the sessionCreationRate, which givesyou an idea of how fast sessions are being created.Tomcat actually exposes every session in thecontainer via MBean operations. You can fetch a listof all session ids, fetch attribute values from aparticular session, and even expire sessions directly.
Monitoring Tomcat Status of data sourcesStatus of requestprocessor thread poolRequest performanceSession informationA great number of web applications use a relationaldatabase via JDBC. Those DataSources configuredvia Tomcat (and not directly in the application, suchas those configured by Spring, Hibernate, etc.) areavailable for inspection.Tomcat's DataSources have a connection pool withminimum and maximum sizes (numbers ofconnections), and a maxIdle setting which allows thepool to grow and shrink depending upon thedemand.
Monitoring Tomcat: DataSourcesSpecifically, you might want to take a look at thenumActive and numIdle attributes: you can see ifyour JDBC connection pool is meeting the demandof your users.Note that I have maxActive 1 since this is a testsystem.
Monitoring Tomcat Status of data sourcesStatus of requestprocessor thread poolRequest performanceSession informationEach of Tomcat's connectors has a thread pool thatis used to actually process the requests: once arequest arrives, it is dispatched to a thread in thepool.Thread pools in Tomcat are called Executors andmay be shared between connectors, which is whythey are treated separately from the Connectorsthemselves.Executors are like the JDBC connection-pools fromthe previous example: they have minimum andmaximum sizes, as well as an idle target to helpmatch resources to user demand.
Monitoring Tomcat: ThreadsYou can find out the number of currently-activerequests (activeCount), the total number of requestsprocessed (by the executor, which may not be thesame as the number processed by any givenconnector), etc.
Monitoring Tomcat: ThreadsHere, I've fired-up a little JMeter script to put someload on the server. You can see that there are 6active threads and the pool size has jumped from 4threads to 21, indicating that I've put quite a load onthe pool – relatively speaking. ThecompletedTaskCount is gong-up dramatically.(I suspect the reason I don't have 21 threads busy-or more – right now is because my laptop only has 8logical cores, so really only 8 threads can be activeat once – that means both JMeter and Tomcat. Therequests are also processed so quickly that it's hardto catch a large number of threads actually active.)
Monitoring Tomcat: ThreadsAfter a bit more load, I've been able to capture theactiveCount getting a bit higher.
Monitoring Tomcat: ThreadsDon't want to track the values yourself over time? Noproblem: just double-click on any numeric value andVisualVM will graph it for you over time.
Monitoring Your Application Monitor Application ProcessesPerformance MetricsOn-the-fly re-configurationSo, the JVM and Tomcat expose information aboutthemselves. That's great for monitoring the state ofthe JVM and the servlet container, but what aboutyour own application's health?You have caches, other data stores, complexobjects, and a little bit of everything going on insideyour own application. How can we peek under thosecovers?
Monitoring Your Application Write an MBean– Create an Interface: FooMBean– Create an Implementation: Foo– Create an XML MBean descriptorDeploy package to Tomcat– Publish the MBean to the MBean serverQuery / invoke as necessary* Example code will be available athttp://people.apache.org/ schultz/ApacheCon NA 2014/Tomcat Monitoring/A great way to do this is to write your own MBean.Then you can use all the tools described in thispresentation to track arbitrary details about yourapplication.Remember that you can also invoke operations onMBeans, so you can even change the state and takewhatever actions you feel are worthwhile from a JMXclient.It's easy to write your own MBean: just follow thesteps above. I'll show a simple example in the nextfew slides.
Example MBean Servlet Filter that captures total requestprocessing time– Timestamp prior to request– Timestamp after request– Add the delta to a JMX-accessible counter:RequestStatsTomcat also provides request-processing metrics ona per-servlet basis. Want to know how the JSPservlet is performing? No problem: Tomcat alreadytracks that information for you.The problem is that it's not very fine-grained: you getmetrics from the simplest index.jsp mixed-in withyour PerformLongTransactionAndProducePDF.jspnumbers. That's not particularly convenient.So, I'm going to write a Filter that captures this kindof data and makes it available via JMX. You can havemultiple instances of the Filter mapped to differentURL patterns, and you'll get a separate set of metricsfor each of them.
RequestStats MBean Write an MBeanpublic interface RequestStatsMBean {public long ge
Java Management Extensions Protocol and API for managing and monitoring – Access data via JMX “Mbeans” – Read and write bean attributes – Invoke operations – Receive notifications