Transcription
ACCOUNTS PAYABLE
Accounts Payable2016 Performance Measurement & Benchmarking ReportPROGRAM MAPAccounting ServicesTax & FinancialSystem SupportFinancial Reporting &ControlPayment ProcessingSAP FinancialSystems ngSAP FinancialUser WSupportProvincial andFederal ReportSubmissionCorporateBankingFinancial ntrolPCardProcessingTax Advisoryand PolicyShaded boxes reflect the activities covered in this reportThe goal of accounts payable services is to ensure the efficient and effectivemanagement of payments to suppliers who do business with the City of Toronto.Specific objectives include: Ensuring invoices are accurate and properly authorized for paymentProcessing of invoices on a timely basisTaking advantage of available early payment discounts where appropriateMaintaining relationships with suppliersProviding customer service to internal divisions and vendorsCorporate oversight of payable activity across the organizationAccounts payable compliance2
Accounts Payable2016 Performance Measurement & Benchmarking ReportSUMMARY OF PERFORMANCE MEASUREMENT RESULTSQuestionInternal Comparisonof Toronto’s2016 vs. 2015 ResultsIndicator/MeasureExternal Comparison toOther Municipalities(MBNC)By Quartile for 2016Chart& PageRef.Customer Service MeasuresHow long does it taketo pay an accountspayable invoice?Percentage of InvoicesPaid Within 30 Days (Customer Service)Have discountsoffered for earlypayment of invoicesbeen obtained?Percentage of EarlyPayment DiscountsAchieved – (Efficiency)How many invoicesare processed byeach accountspayable staffmember?Number of Invoices Paidper Accounts PayableFTE – (Efficiency)How much does itcost to process anaccounts payableinvoice?Accounts Payable Costper Invoice Paid –(Efficiency)DecreaseDecrease in the number ofinvoices paid within 30daysEfficiency MeasuresDecreasePercentage of earlypayment discountsachieved slightlydecreased1.11.2pg. 41.3N/Apg.53Decrease1.41.5Number of invoicesprocessed per staffmember decreasedLower rate for number ofinvoices processed perstaff member compared toothersIncrease41.61.7Cost per invoice paidincreasedHighest cost per invoicepaid compared to otherspg.7Service LevelIndicators(Resources)Overall Results4Lower percentage ofinvoice paid within 30 dayscompared to others.N/APerformanceMeasures(Results)0- Favourable0- Stable4 -Unfavourable0% favourable orstableService es(Results)0 - 1st quartile0 - 2nd quartile1 - 3rd quartile2 - 4th quartile0% in 1st and 2ndquartileFor an explanation of how to interpret this summary and the supporting charts, please see the Guide toToronto's Performance Results. These quartile results are based on a maximum sample size of 15municipalities.3
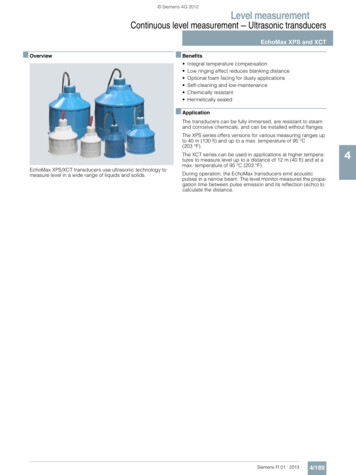
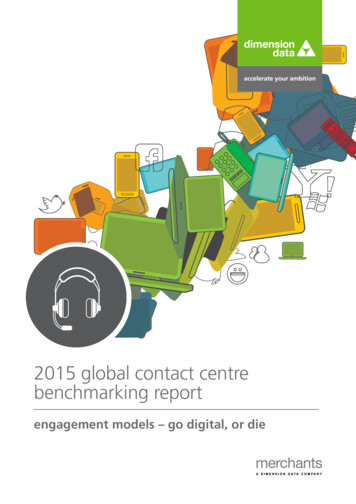
Accounts Payable2016 Performance Measurement & Benchmarking ReportCUSTOMER SERVICEOne objective of the accounts payable (A/P) function is the timely processing of vendorinvoices. This must be balanced by ensuring that invoices are accurate and the specified goodsor services are received and authorized for payment.1.1 – HOW LONG DOES IT TAK E TO PAY AN ACCOUNTS PAYABLE INVOICE INTORONTO?100%% of invoices 20152016 60 days11%12%15%10%10%10%13%13%10%13% 30 & 60days22%21%20%19%16%15%20%18%17%22% 30 days67%67%65%71%73%75%68%69%73%65%Chart 1.1summarizes theproportion of A/Pinvoices paid within30 days of theinvoice date,between 31 and 60days, and over 60days.Chart 1.1 (City of Toronto) Percentage of A/P Invoices Paid Within Specified Time PeriodResults in 2016 decreased by 8 percent from the previous year, with 65% of invoices paid within30 days.1.2 – HOW LONG DOES IT TAK E TO PAY AN ACCOUNTS PAYABLE INVOICE INTORONTO COMPARED TO OTHER MUNICIPALITIES ?Chart 1.2 comparesToronto's 2016result to otherOntariomunicipalities for thetime required to payinvoices.Chart 1.2 (MBNC 2016) Percentage of A/P Invoices Paid Within Specified Time Period4
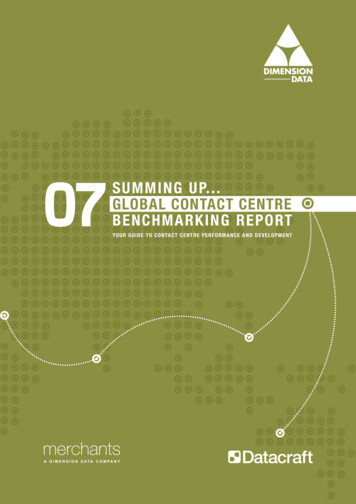
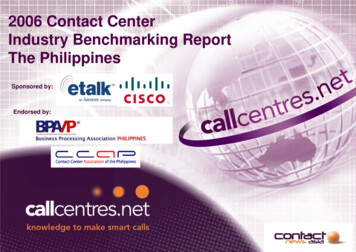
Accounts Payable2016 Performance Measurement & Benchmarking ReportToronto ranks twelfth of fifteen (fourth quartile) in terms of having the highest percentage ofinvoices paid within 30 days.Initiatives implemented in recent years to reduce the payment cycle time include; publication ofclear billing requirements for vendors to reduce the incidence of incorrect or incompleteinvoicing; an option for vendors to receive payment from the City by direct deposit; allowingvendors to submit their invoices electronically; and a vendor early payment discount program.EFFICIENCYToronto has a centralized accounts payable process, meaning that less of the processes aredone in the operating Divisions compared to many other municipalities.% ofearly payment discounts1.3 – HAVE DISCOUNTS OFFER ED FOR EARLY PAYMENT OF INVOICES BEENOBTAINED IN TORONTO?100% 2,50080% 2,00060% 1,50040% 1,00020% 5000%% obtained value obtained rt 1.3 displaysthe percentage(columns) and dollarvalue (line) ofavailable earlypayment discountsobtained in Toronto. 082.9% 91.0% 82.6% 80.4% 81.5% 80.3% 82.0% 80.7% 89.9% hart 1.3 (City of Toronto) Percentage and Value of Available Early payment discounts obtainedResults in 2016 slightly decreased with 88.8% of available discounts captured.5
Accounts Payable2016 Performance Measurement & Benchmarking Report1.4 – HOW MANY INVOICES AR E PROCESSED BY EACH TORONTO ACCOUNTSPAYABLE STAFF MEMBER ?Chart 1.4 providesToronto's totalnumber and rate ofA/P invoices paidper A/P staffmember, and 2016results decreasedby 10.9 percent inrelation to 2015.15,00012,0009,0006,0003,0000Total #of 5,051 497,630 516,736 559,586 526,643 548,073 463,913 508,557 517,566 415,198# invoices10,745 10,587 10,545 11,420 11,325 12,456 11,045 12,108 12,939 11,533per A/P staffChart 1.4 (City of Toronto) Number of Invoices Processed per A/P Staff MemberThere was a decrease in the number of invoices processed in comparison to 2015. In 2015, CityClerks and Public Health submitted invoices for payment through interface. Invoices processeddirectly by AP staff remained the same between these two years.It should be noted that Toronto's operating cost (as seen in Charts 1.6 and 1.7) does not includethe significant net cost savings of the early payment discounts captured through payable efforts,as shown in Chart 1.3.1.5 – HOW MANY INVOICES AR E PROCESSED BY EACH ACCOUNTS PAYABLE STAFFMEMBER COMPARED TO OTHER MU NICIPALITIES?25,000Chart 1.5 comparesToronto's 2016 resultto othermunicipalities for thenumber of A/Pinvoices processedper staff ltWinnNiagSudT-BayTorDurLonRegWind# invoices 21,871 20,934 19,962 18,862 15,808 15,311 13,107 12,367 12,217 12,196 11,533 10,474 10,464 8,968 8,102Median12,367 12,367 12,367 12,367 12,367 12,367 12,367 12,367 12,367 12,367 12,367 12,367 12,367 12,367 12,367Chart 1.5 (MBNC 2016) Number of Invoices Processed per A/P Staff MemberToronto ranks eleventh of fifteen (third quartile) in terms of having the highest number of A/Pinvoices processed per staff member.6
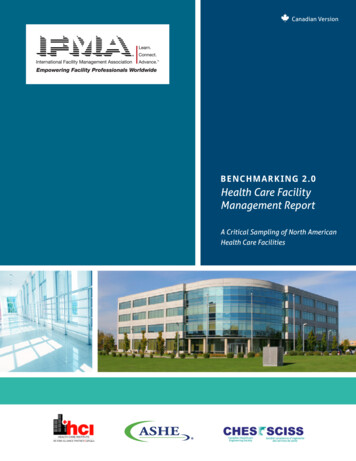
Accounts Payable2016 Performance Measurement & Benchmarking Report1.6 – HOW MUCH DOES IT COST TO PROCESS AN ACCO UNTS PAYABLE INVOICE INTORONTO?Chart 1.6 showsthat Toronto'soperating costs perinvoice paid haveincreased by 4.5%compared to 2016. 12 10 8 6 4 2 0Op.Cost/Invoice Processed2007200820092010201120122013201420152016 9.56 9.94 10.63 10.24 10.18 8.84 11.01 11.06 10.32 10.78Chart 1.6 (City of Toronto) Accounts Payable Cost per Invoice Paid1.7 – HOW MUCH DOES IT COST TORONTO TO PROCESS A N ACCOUNTS PAYABLEINVOICE COMPARED TO OTHER MUNICIPALITIES? 12Chart 1.7 showsthat compared toother municipalities,Toronto ranksfifteenth of fifteen(fourth quartile) interms of having thelowest cost perinvoice paidmember. 10 8 6 4 2 0Wat Mont Ham York NiagSud T-Bay Winn HaltCalDurLonWind RegTorOp. Cost / Invoice Processed 3.46 4.09 4.51 5.65 5.75 5.85 6.02 6.32 6.66 7.08 7.46 7.70 8.25 9.09 10.78Median 6.32 6.32 6.32 6.32 6.32 6.32 6.32 6.32 6.32 6.32 6.32 6.32 6.32 6.32 6.32Chart 1.7 (MBNC 2016) Accounts Payable Cost per Invoice PaidToronto has the highest cost to process an accounts payable invoice however there was a directand significant net cost savings of 1,434,363 by the capturing of early payment discountscaptured through payable efforts which would reduce the cost of the invoice paid ( 7.33 net costper invoice), however the current MBNC/OMBI data dictionary does not allow the deductionfrom the operating costs for AP.7
Accounts Payable2016 Performance Measurement & Benchmarking Report2016 ACHIEVEMENTS AND 2017 PLANNED INITIATIVESThe following initiatives are intended to further improve the efficiency and effectiveness ofAccounts Payable Services:2016 Initiatives Completed/Achievements Implemented Corporate Accounts Payable Key Performance Indicators (KPI's) metrics andother relevant reports for client divisions on the accounting intranet web site.Accounts Payable continuous automation process has resulted in receiving over 82% ofaccounts payable documents electronically from City Vendors and Internal customers.Encouraged vendors to capitalize on early payment discount opportunities.Implemented the automation of the receipt and processing of Capital Transmittal, PaymentRequisitions and Schedule "A" vendor invoices.2017 Initiatives Planned Continue to automate the Accounts Payable process to improve efficiency and customerrelationships with City vendors and City Divisions.Factors Influencing Results of MunicipalitiesThe results of each municipality found in the charts included in this report are influenced tovarying degrees by factors such as: Organizational form - centralized vs. De-centralized invoice approval process, as well as thenumber of different office locations.Credit card purchases - some invoices are system generated (credit cards), which reducesthe number of invoices to process.Payment policy – the timeline for paying invoices may vary according to different localpolicies.8
Accounts Payable 2016 Performance Measurement & Benchmarking Report 2 PROGRAM MAP . The goal of accounts payable services is to ensure the efficient and effective management of payments to suppliers who do business with the City of Toronto. Specific objectives include: Ensuring