Transcription
Monitoring Java Web Servers using JMXBoro JakimovskiFaculty of Compute Science and EngineeringSs. Cyril and Methodius University in Skopje
Background FCSE Computer Center has been hosting a lot of nationalservices in the past five years We support different kinds of software stacks Systems have more than 120 requests per second or 1 Milrequests pages per day Peaks of up to 500 requests per second, 2000 active sessionsand 2 Mil requests per day Implemented using a scalable architecture– Up to 8 application servers and 3 db servers
Challenge The software that is hosted is developed using an agile softwareprocess model Delivery of new version of the software sometimes on weekly basis Due to lack of good stress testing of the developed software, manyof the under optimized implementation is not detected duringpreproduction tests This requires of proactive monitoring of the application servers andearly detection mechanisms in order to mitigate the problems
How and what to monitor Monitoring on OS level– CPU UtilizationLoadInteruptsContext switches– Memory– Network load OS Level is not enough– Very coarse grain– Sometimes the problem is notvisible
JMX technology Monitoring on Java VM level is required Java VM enables Java Management Extensions (JMX) The JMX technology provides a simple, standard way of managing resources such as– applications,– devices, and– services. JMX technology is dynamic and can be used to monitor and manage resources as they are created,installed and implemented.––––instrument Java technology-based applications (Java applications),create smart agents,implement distributed management middleware and managers,and smoothly integrate these solutions into existing management and monitoring systems. JMX technology can also monitor and manage the Java Virtual Machine (Java VM).
JMX monitoring of Java VM The platform MXBeans are a set of MXBeans that is provided with the JavaSE platform for monitoring and managing the Java VM and othercomponents of the Java Runtime Environment (JRE).–––––memorythreadsclass-loading system,just-in-time (JIT) compilation system,garbage collector, Different monitoring capabilities– Jconsole– Remote monitoring and management tools
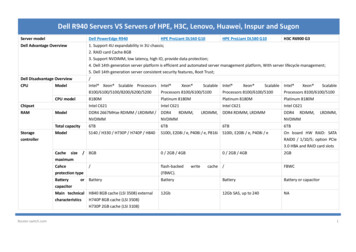
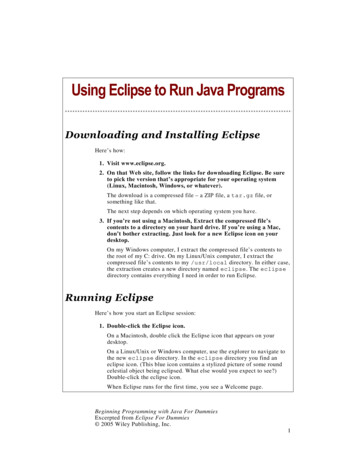
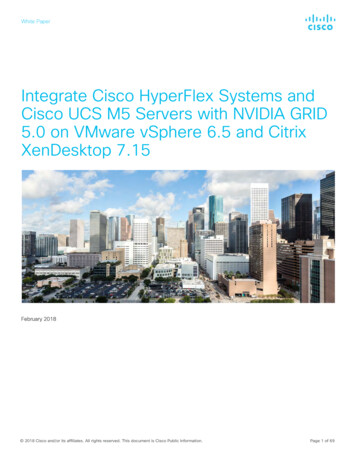
JConsoleOverview of memory/cpu/threads/classesMemory and Garbage collection
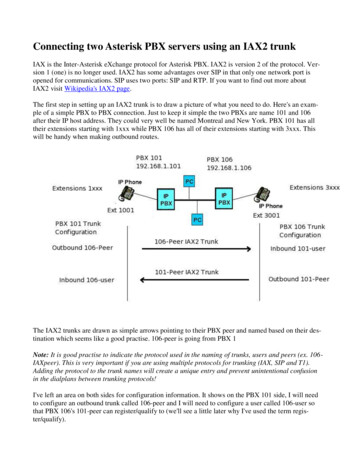
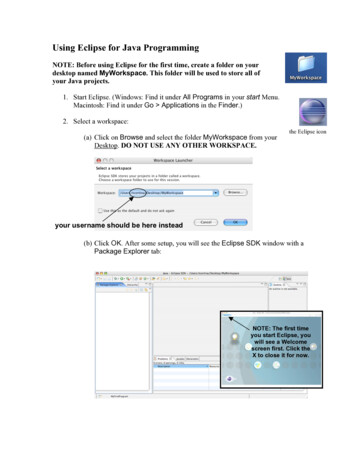
JConsoleThreadsVM Summary
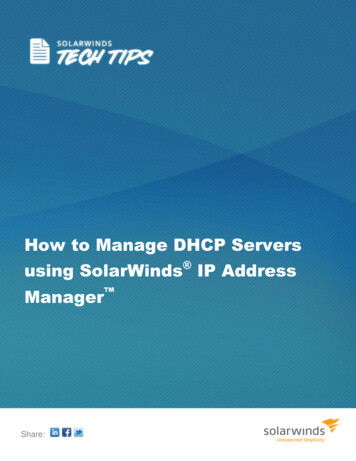
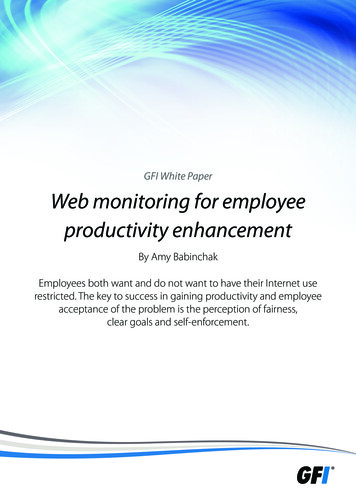
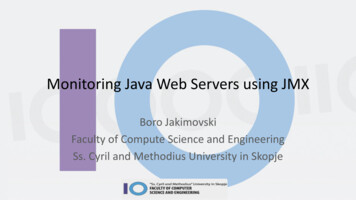
JConsoleMbeansRead/Write values
Zabbix java gateway Monitoring using jConsole is for manual incident handling Persistent monitoring needs a more robust monitoring platform Zabbix is one of the best open source monitoring projects– Enables easy host configuration management– Extensible and flexible to address different monitoring data sources– Powerful triggering and action engine Zabbix supports monitoring using the native client that enablesmonitoring of OS parameters For monitoring of Java services Zabbix has a Java Gateway that usesJMX
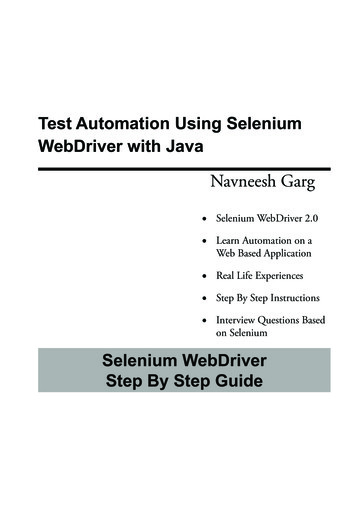
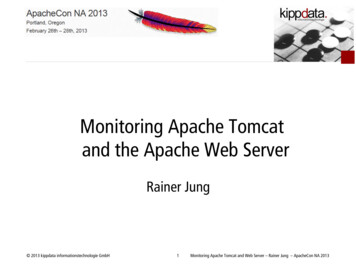
Zabbix JMX templates Zabbix templates generalize monitoring items per server type– JMX Generic template Standard Java VM Mbeans–––––––Memory – all partsJvm versionThreadsUptimeFile descriptorsGarbage collectorClassloader– JMX Tomcat template Sessions Connector– Threads– Network
Conclusion JMX presents a powerful Java monitoring and managementinterface– Can be used for instrumentation in run-time verificiation/monitoring Information provided for both custom objects as well as JavaVM Enables better understanding of Java VM Critical for performance/uptime of Java Application servers Can be used for scale up/down on Cloud instances
JMX monitoring of Java VM The platform MXBeans are a set of MXBeans that is provided with the Java . – JMX Tomcat template Sessions Connector – Threads – Network. Conclusion JMX pre