Transcription
Understanding VectorNetwork Analysiswww.anritsu.com
VNA Basics . 4Network Analyzers . 6Scalar Analyzer Comparison . 7VNA Fundamentals . 7Network Analyzer Measurements . 13Measurement Error Correction . 18Summary . 19VNA Overview . 20VNA Architecture . 20Sources . 21Switches . 27PIN Diode . 27Cold FET Switch . 28Directional Devices . 30Down Converters . 34IF Section . 43System Performance Considerations . 46Measurement Fundamentals . 47The Reference Plane . 47Introduction to Calibrations . 48Linearity . 50Data Formats . 51Other Terms of Interest . 52System Architecture and Modes of Operation . 52Specifications and Measurement Accuracy . 53Dynamic Range . 54Compression Level . 54Noise Floor . 55Trace Noise . 55Power Range . 56ALC Power Accuracy and Linearity . 56Frequency Accuracy and Stability . 56Harmonics . 56Raw Directivity . 56Raw Source Match . 57Raw Load Match . 57Residual Directivity .57Residual Source Match . 57Residual Load Match . 572Understanding Vector Network Analysis
Residual Reflection Tracking . 57Residual Transmission Tracking . 57Vector Network Analyzers - VectorStar . 58Vector Network Analyzers - ShocklineTM . 59Vector Network Analyzers - Handheld . 60Summary . 61References . 61w w w. a n r i t s u . c o m3
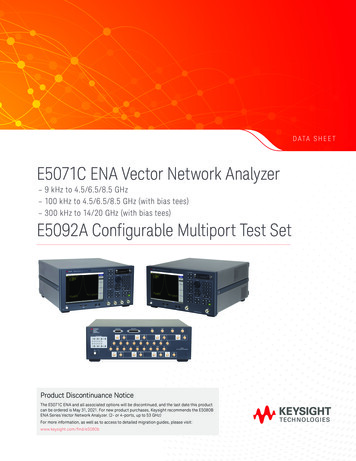
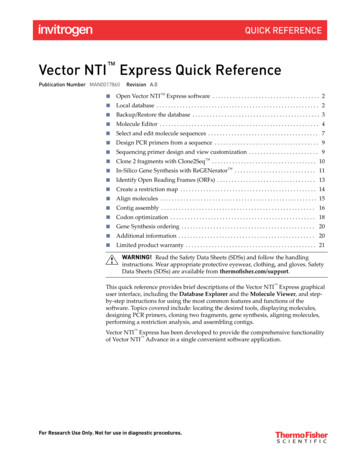
In this Understanding Guide we will introduce the basic fundamentals of the Vector NetworkAnalyzer (VNA). Specific topics to be covered include phase and amplitude measurements,scattering parameters (S-parameters), and the polar and Smith chart displays.VNA BasicsThe VNA measures the magnitude and phase characteristics of networks, amplifiers,components, cables, and antennas. It compares the incident signal leaving the analyzer witheither the signal that is transmitted through the test device or the signal reflected from itsinput. Figure 1 and Figure 2 illustrate the different types of measurements that the VNA canperform.TransmittedIncidentTestDevice Gain (dB)Insertion Loss (dB)IncidentPhase (degrees)InsertionTransmission Coefficients (S21, S12)TestComplex Transmission Components (Magnitude andDeviceReflectedPhase)TerminationElectrical Length (m)Electrical Delay (s)Deviation from Linear Phase (degrees)Group Delay (s)Figure 1. The VNA can make a wide range of transmission measurements.4Understanding Vector Network Analysis
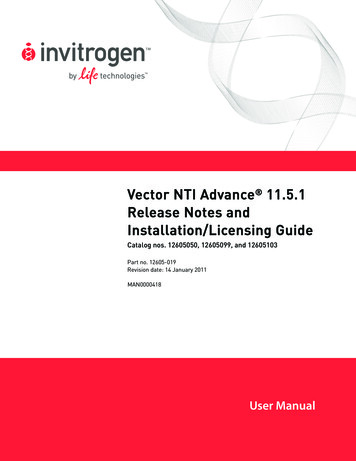
TestDeviceIncidentReflectedTestDeviceTermination Return Loss (dB)Reflection Coefficients (S11, S22)Reflection Coefficients vs Time (Fourier Transform)Impedance (R jX)SWRFigure 2. The VNA can make numerous different reflection measurements.VNAs are self-contained, fully-integrated measurement systems that include additionalmeasurement capabilities such as time domain and group delay. The system hardwareconsists of the following: An analyzerPrecision components required for calibration and performance verificationOptional use of synthesizers as a second sourceOptional use of power meters for test-port leveling and calibrationThe VNA internal system modules perform the following functions:Source Module - The source module provides the stimulus to the device under test (DUT). Thefrequency range of the source and test set modules establish the frequency range of thesystem. The frequency stability of the source is an important factor in the accuracy (especiallyphase accuracy) of the network analyzer. Some VNA sources operate in either analog-sweepmode or step-sweep mode. Analog-sweep mode provides a faster measurement time.However, since the signal is not locked to a stable reference, measurement stability—especiallyphase - will suffer. For proper measurement accuracy, the VNA should always be operated in astep sweep, phase-locked condition. The difference is critical enough that all Anritsu VNAsprovide only a step-sweep mode and do not provide the ability to unlock the source.Test Set Module - The test-set module routes the stimulus signal to the DUT and samples thereflected and transmitted signals. The type of connector used is important, as is the “Autow w w. a n r i t s u . c o m5
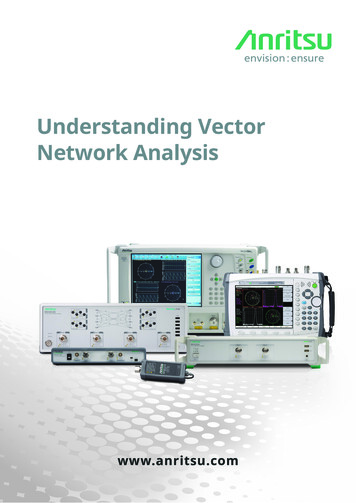
Reversing” feature. Auto Reversing means that the stimulus signal is applied in both theforward and reverse directions. The direction is reversed automatically. This saves the engineerfrom having to physically reverse the test device to measure all four S-parameters. It alsoincreases accuracy by reducing connector repeatability errors. Frequency conversion to theIntermediate Frequency (IF) range also occurs in the test-set module.Analyzer Module - The analyzer module receives and interprets the IF signal for phase andmagnitude data. It then displays the results of this analysis on a high-resolution display screen.This display can show all four S-parameters simultaneously, as well as a variety of other formsof displayed information such as group delay, time and distance, and complex impedanceinformation. In addition to the installed display, the engineer can also view the measurementresults on an external monitor.Network AnalyzersThis discussion of networks analyzers begins with a subject familiar to most analyzer users:scalar network analysis. After showing comparisons, the fundamentals of network analyzerterminology and techniques will be presented. This discussion serves as an introduction totopics presented in greater detail later in this chapter and will touch on the concepts of: Reference delay S-Parameters: what they are and how they are displayed Complex impedance and Smith ut VoltageDetector Output Voltage is Proportional to Signal AmplitudeFigure 3. Scalar network analyzers measure microwave signals using the detection process shownhere.6Understanding Vector Network Analysis
Scalar Analyzer ComparisonVNAs do everything that scalar analyzers do, plus they add the ability to measure the phasecharacteristics of microwave devices over a greater dynamic range and with more accuracy. Ifall a VNA added was the ability to measure phase characteristics, its usefulness would belimited. While phase measurements are important, the availability of phase informationprovides the potential for many new complex-measurement features, including Smith charts,time domain and group delay. Phase information also allows greater accuracy through vectorerror correction of the instrument’s own mismatches so that the instrument’s own uncorrectedcharacteristics do not influence the actual DUT response.Now consider the scalar network analyzer (SNA), an instrument that measures microwavesignals by converting them to a DC voltage using a diode detector (Figure 3). This DC voltageis proportional to the magnitude of the incoming signal. The detection process, however,ignores any information regarding the microwave signal’s phase. Also, a detector is abroadband-detection device which means that all frequencies, the fundamental, harmonics,sub-harmonics, and any other spurious signals within the bandwidth of the detector, aredetected and simultaneously displayed as one signal. This may add significant error to boththe absolute and relative measurements.In a VNA, information regarding both the magnitude and phase of a microwave signal isextracted. While there are different ways to perform this measurement, the method employedby the Anritsu series of VNAs is to down-convert the signal to a lower IF in a process calledharmonic sampling. This signal can then be measured directly by a tuned receiver. The tunedreceiver approach gives the system greater dynamic range due to its variable IF-filterbandwidth control. The system is also much less sensitive to interfering signals, includingharmonics.VNA FundamentalsThe VNA is a tuned receiver (Figure 4).A Vector Network Analyzer is a Tuned gure 4. The network analyzer is aTunable LocalOscillatortuned receiver.w w w. a n r i t s u . c o m7
The microwave signal is down converted into the passband of the IF. To measure the phase ofthis signal as it passes through the DUT, a reference is needed for comparison. If the phase ofa signal is 90 degrees, it is 90 degrees different from the reference signal (Figure 5). The VNAreads this as –90 degrees, since the test signal is delayed by 90 degrees with respect to thereference signal. The phase reference can be obtained by splitting off a portion of themicrowave signal before the measurement (Figure 6).Phase MeasurementReference SignalTest SignalTimeFigure 5. Shown here are signals with a 90-degree phase ctorTestSignalSplitterDUTFigure 6. Splitting the microwave signal to obtain the phase reference.The phase of the microwave signal, after it has passed through the DUT, is then compared withthe reference signal. A network-analyzer test set automatically samples the reference signal sono external hardware is needed.8Understanding Vector Network Analysis
Consider the case where the DUT is removed and a length of transmission line is substituted(Figure 7). Note that the path length of the test signal is longer than that of the referencesignal. How does this affect the ectorSplitterTestSignalLongPathLengthFigure 7. Pictured here is the case of a split signal where a length of line replaces the DUT.To answer this question, assume that a measurement is being made at 1 GHz and that thedifference in path length between the two signals is exactly 1 wavelength. This means that thetest signal lags behind the reference signal by 360 degrees (Figure 8). It is impossible to tell thedifference between one sine wave maxima and the next because they are all identical.Consequently, the network analyzer measures a phase difference of 0 eDetectorTestSignalLonger byOne WavelengthLength (360 Degrees)Figure 8. Depicted here is the case for a split signal where the path length differs by exactly one wavelength.w w w. a n r i t s u . c o m9
Now, consider that this same measurement is made at 1.1 GHz. Since the frequency is higherby 10 percent, the wavelength of the signal is shorter by 10 percent. The test-signal path lengthis now 0.1 wavelength longer than that of the reference signal (Figure 9). This test signal is: 1.1x 360 396 degrees. This is 36 degrees different from the phase measurement at 1 GHz. Thenetwork analyzer displays this phase difference as –36 degrees. The test signal at 1.1 GHz isdelayed by 36 degrees more than the test signal at 1 tSignalSplitterSame Path Length ButWavelength is Now Shorter1.1 Wavelengths 396 DegreesFigure 9. Depicted here is the case for a split signal where the path length differs by the same pathlength, but the wavelength is now shorter. Note that 1.1 wavelengths 396 degrees.Measured Phase 180 90 0 1.11.21.31.4Frequency in GHz-90 -180 Figure 10. This graphic depicts electrical delay.10Understanding Vector Network Analysis
A measurement frequency of 1.2 GHz produces a reading of –72 degrees, while 1.3 GHzproduces a reading of –108 degrees (Figure 10). There is an electrical delay between thereference and test signals. This delay is commonly referred to in the industry as the referencedelay. It is also called phase delay. In older network analyzers, the length of the reference pathhad to be constantly adjusted—relative to the test path—to make an appropriate measurementof phase versus frequency.To measure phase on a DUT, this phase-change versus frequency due to changes in theelectrical length must be removed. This allows the actual phase characteristics to be viewed.These characteristics may be much smaller than the phase change due to veSourceSplitterPhaseDetectorTestSignalBoth LineLengthsNow Equal1.1 Wavelengths 396 DegreesFigure 11. This graphic depicts a split signal where paths are equal in length.w w w. a n r i t s u . c o m11
The second approach involves handling the path-length difference in software. Figure 12displays the phase versus frequency of a device. This device has different effects on the outputphase at different frequencies. Because of these differences, the phase response is notperfectly linear. This phase deviation can be easily detected by compensating for the linearphase. Because the size of the phase difference increases linearly with frequency, the phasedisplay can be modified to eliminate this delay.Measured Phase 180 90 1.1 0 1.21.31.4Frequency in GHzSubtract LinearPhase FromMeasured Phase-90 -180 Figure 12. Here phase difference increases linearly with frequency.Anritsu VNAs offer automatic reference-delay compensation with the push of a button. Figure13 shows the resultant measurement when the path length is compensated.Resultant Phase 180 90 0 1.11.21.31.4Frequency in GHz-90 -180 Figure 13. Shown here is the resultant phase with path length.12Understanding Vector Network Analysis
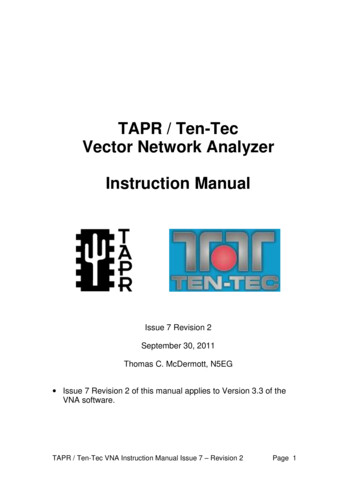
Network Analyzer MeasurementsNow, consider measuring the DUT using a two-port device; that is, a device with a connectoron each end. What measurements would be of interest? First, measure the reflectioncharacteristics at either end with the other end terminated into 50 ohms. If one of the inputsis designated as Port 1 of the device, then this is the reference port. Next, define the reflectioncharacteristics from the reference end as forward reflection, and those from the other end asreverse reflection (Figure 14).Port 1ForwardReflectionPort 2ReverseReflectionDUTFigure 14. Forward and reverse reflection measurements are shown in this graphic.S21 Forward TransmissionPort 1S11 ForwardReflectionPort 2DUTS22 ReverseReflectionS12 Reverse TransmissionFigure 15. The four scattering parameters are shown in this figure.Second, measure the forward and reverse transmission characteristics. However, instead ofsaying “forward,” “reverse,” “reflection,” and “transmission” all the time, a shorthand can beused—S-parameters. In a typical SXX nomenclature, the “S” stands for scattering, the firstnumber is the device port which is measuring the signal and the second number is the deviceport which is sourcing the signal. As an example, S21 is Port 2 measuring, and Port 1 is sourcingor transmitting. The four scattering parameters for a 2-port device shown in Figure 15, are:w w w. a n r i t s u . c o m13
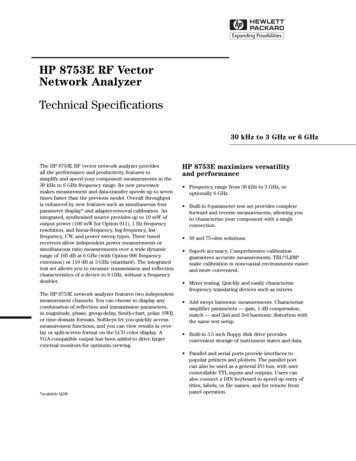
S11 forward reflectionS21 forward transmissionS22 reverse reflectionS12 reverse transmissionS-parameters can be displayed in many ways. An S-parameter consists of a magnitude and aphase. The magnitude is displayed in dB, just like the SNA, and is called the log magnitude.Another method of magnitude display is to use units instead of dB. When displaying magnitudein units, the value of the reflected or transmitted signal will be between 0 and 1 relative to thereference.Phase 180º0º-180ºFrequencyFigure 16. This waveform depicts linear phase with frequency.Phase can be displayed as “linear phase” (Figure 16). As discussed earlier, it’s impossible to tellthe difference between one cycle and the next. Therefore, after going through 360 degrees,the engineer ends up back at the beginning. Displaying
4 nderstandin Vector Network Analysis. In this Understanding Guide we will introduce the basic fundamentals of the Vector Network Analyzer (VNA). Specifictopics to be covered include phase and amplitude measurements, scattering parameters (S-parameters), and the po