Transcription
Journal of Petroleum Exploration and Production -yORIGINAL PAPER-EXPLORATION GEOLOGYThe Fourier transform infrared spectroscopy (FTIR) analysis for the claymineralogy studies in a clastic reservoirGolnaz Jozanikohan1· Mohsen Nosrati Abarghooei2Received: 17 August 2021 / Accepted: 27 December 2021 The Author(s) 2022AbstractThe complete characteristics knowledge of clay minerals is necessary in the evaluation studies of hydrocarbon reservoirs.Ten samples taken from two wells in a heterogeneous clastic gas reservoir formation in NE Iran were selected to conductthe transmission Fourier transform infrared spectroscopy (FTIR) tests for the clay mineralogy studies. The FTIR analysisshowed that there were clear signs of clay minerals in all samples. The wavenumber region of the clay minerals in FTIRtests was detected to be 3621, 3432, 1034, and 515 cm 1 for illite, 3567, 3432, 1613, 1088, 990, 687, 651, and 515 cm 1 formagnesium-rich chlorite, 3700, 3621, 3432, 1034, 687, and 463 cm 1 for kaolinite, and 3567, 1088, 990, and 463 cm 1 forglauconite. After screening of samples by the FTIR method, the samples were then analyzed by powder X-ray diffraction(PXRD), wavelength dispersive X-ray fluorescence (WDXRF), and scanning electron microscopy (SEM). The PXRD andSEM result showed illite was by far the most common clay present. Kaolinite, magnesium-rich chlorite, and traces of smectiteand the mixed-layer clays of both the illite–smectite and chlorite-smectite types were also recognized. The combination ofPXRD and WDXRF results could quantify the clay abundances in the each well too. It was concluded that the FTIR analysissuccessfully could show the absorption bonds of all constituent clays. However, the infrared absorption spectra of mixed-layerclays overlapped those of the respective constituents of each mixed-layer minerals. This can be considered as the evidenceof the usefulness of FTIR technique in the screening of the samples for the clay mineralogy studies.Keywords Transmission Fourier transform infrared spectroscopy (FTIR) · Powder X-ray diffraction (PXRD) · Wavelengthdispersive X-ray fluorescence (WDXRF) · The clay mineralsIntroductionThe clay minerals, even in the small amounts, strongly affectthe properties of petroleum reservoirs as well as the responseof most well logging tools (Attia et al. 2015; Abudeif et al.2016a, 2016b, 2018; Hasan et al. 2020; Radwan 2020;Radwan et al. 2020; Jiu et al. 2021). Thus, a comprehensive knowledge of clay mineralogy is needed for both thereservoir modeling and the interpretation of wire-line logdata (Hong et al. 2020; Wang et al. 2020; Radwan, 2021a;* Golnaz Jozanikohangjkohan@ut.ac.irMohsen Nosrati Abarghooeinosrati21503@gmail.com1School of Mining, College of Engineering, Universityof Tehran, 14399‑57131 Tehran, Iran2Department of Mining and Metallurgical Engineering, YazdUniversity, 8915818411 Yazd, IranRadwan et al., 2021a). In addition, clays may react with drilling fluids causing formation damage (Radwan et al. 2019a;Radwan et al. 2019b; Radwan 2020, 2021b; Radwan et al.2021b, 2021c), so a good knowledge of clay mineralogy mayinfluence the choice of drilling fluids and additives. Numberof techniques has been used to characterize the individualclay minerals (Ashraf et al. 2019; Ali et al. 2020) of whichthe X-ray diffraction (XRD) is the most popular one (Jozanikohan et al. 2016; Abd Elmola et al. 2020). The conventionalXRD method needs careful sample preparation besides several specialized treatments to identify particular clay minerals (Kumar & Lingfa 2020). However, such treatments runthe risk of destroying or altering clays of interest (Moore &Reynolds 1989). Infrared spectroscopy (IR) is a widely usedanalytical technique in the geosciences studies (Stanienda2016) and sometimes used as a screening tool to recognizethe samples containing clays for more sophisticated andtime-consuming procedures such as XRD. The FTIR analysis has several advantages over the XRD including: (i) the13Vol.:(0123456789)
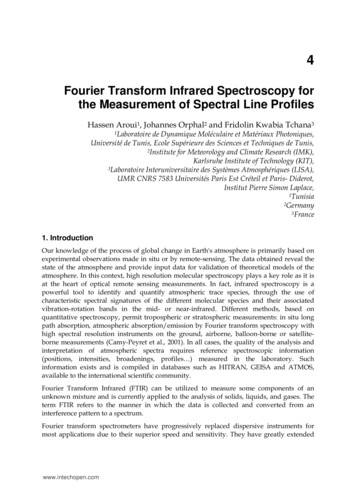
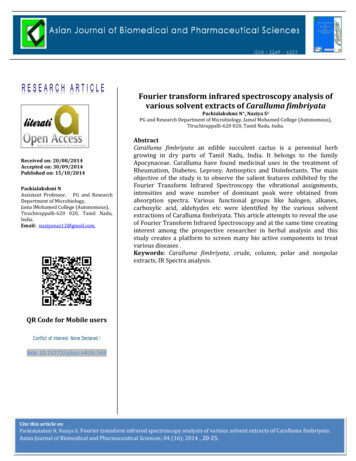
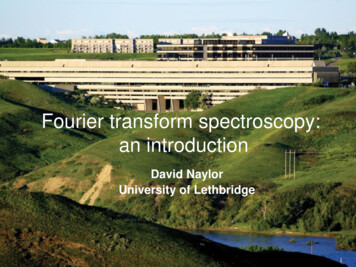
Journal of Petroleum Exploration and Production Technologypreparation of powder samples is quite easy and fast (KBrpellets normally take 5–8 min to be ready); (ii) the collectionof spectrum is fast (it takes almost 1–2 min), (iii) only smallamount of samples (about 0.3 g) are required; (iv) additionaltreatments of samples are not required, and (v) it is cheapcompared to the XRD method (Madejová & Komadel 2001;Ji et al. 2009; Pálková et al. 2020). The spectral absorptioncharacteristics in the IR spectra are qualitatively related tothe variations in the constituent minerals and can be used forinvestigating the crystalline structure, type of bonding, andsome chemical information on the clay minerals (Madejová,2003; Du et al. 2010; Yan et al. 2021). The Fourier transforms of IR spectra are being increasingly used to aid theclay mineral identification (Madejová, 2003; Vaculíková &Plevová, 2005; Nayak & Singh 2007; Worasith et al. 2011;Repacholi 1994; Djomgoue & Njopwouo 2013; Chen et al.2020; El-Shater et al. 2021). The high signal-to-noise ratiosas well as the high speed of data acquisition and accuracyenhancement in frequency measurements have made theFTIR method a suitable candidate for the initial analysismethod to characterize the clay minerals (Madejová, 2003;Ma et al. 2021).The clay minerals consist of hydroxyl groups, tetrahedraland octahedral sheets, and interlayer cations (Meunier 2005).The valuable “fingerprint” absorptions in clay mineral characterization are mainly contributed by the stretching andbending vibration bands of Si–O, Al–O, and O–H (Farmer2000). The absorption of IR radiation by individual clayminerals are determined by the strength, length, and forceconstants of chemical bonds in the structures of clay minerals as well as crystalline order, shape and size of particles,atomic mass, and some symmetry-related elements such asthe unit cell constraints of the symmetry, and finally thelocal site symmetry of each individual atom within the unitcell (Repacholi 1994). Different aspects of clay mineralogy,including the study of relationships between the clay chemical composition and the absorption band variations, andthe study of variations in the absorption features after acidtreatment/heating were carried out using the FTIR analysis(Madejová et al. 1998; Tyagi et al. 2006). In nature, clayminerals are often accompanied by quartz, K-feldspar andplagioclase, carbonates, iron oxide, and/or sulfide or sulfates(Meunier 2005). Differences in the absorption bands of thesenon-clay minerals make them clearly distinguishable fromeach other. The clay minerals can exclusively be differentiated from the other minerals by the absorption bands ofstructural OH and Si–O groups. However, each clay mineralmay have similar types of bonds, which make them moredifficult to distinguish (Farmer 2000).The contribution of the FTIR method in the oil and gasindustry has been included, but not limited to the determinations of oil acidity (Li 2009), the assessment of the shalegas and shale oil potentials (Wright et al. 2015), the study13of the petroleum fluid inclusions (Li & Parnell 2003), theassessment of the pyrolysis gases (Primpke et al. 2020),the identification of the insoluble fraction of pyrolysis oil(Scholze & Meier 2001), the composition characterizationof the collected bio-oils (Shen et al. 2010), the study of thechemical structures of individual macerals as well as theirrelative generation kinetics (Lin & Ritz 1993).Some previous FTIR studies on the pure clay mineralshave been carried out (Madejová, 2003; Nayak & Singh2007; Repacholi 1994; Du et al. 2010), but analogously littleconsideration has been given to the identification of the clayminerals in the clastic formations with complex lithologiesby the transmission FTIR method (Adamu 2010). Since theShurijeh formation is considered as a heterogeneous sandstone reservoirs, it needs to be mineralogically identifiedin the eastern part of Kopet-Dagh sedimentary Basin, NEIran. In this research, the ability of one of the most famousspectral analysis methods, i.e., transmission Fourier transform infrared (FTIR) spectroscopy, as a screening tool, hasbeen investigated to select the samples containing clays, forfurther studies along with the traditional methods such aspowder X-ray diffraction (PXRD), wavelength dispersiveX-ray fluorescence (WDXRF), and the scanning electronmicroscopy (SEM) analysis. The results of this study willaid the geoscientists in oil and gas upstream industries toevaluate and screen the samples for the purpose of clay mineralogy studies in reservoir evaluation stages more fast andconvenient, before conducting expensive and time-consuming analysis such as the XRD, SEM, and XRF.Experimental methodsMaterialsThe coring operation was conducted on the reservoir formation at depths of 3202.8–3210 m and 3180–3207.6 mof the gas-producing and non-producing wells, respectively. A total of 76 core samples was taken almost everyone and a half meter from the Shurijeh formation in agas-producing well and a non-producing one. The wellsare located in the Iranian part of eastern Kopet-DaghBasin, NE Iran (Fig. 1). The understudy reservoir formation is mainly composed of sandstone with interlayer ofclay minerals. Therefore, all of the collected core samplesdid not contain the clay minerals in the major quantities. Ten samples were carefully selected based on themacroscopic features related to the lithological variationssuch as texture, grain size, cementation, beddings, andlooseness degree to determine the samples containingthe most amounts of clay minerals for further detailedanalysis methods. Five samples, labeled with “GP,” weretaken from the gas-producing well between the depths of
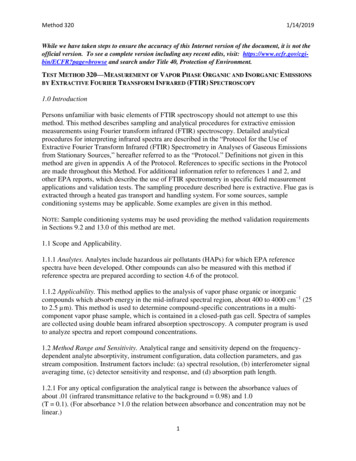
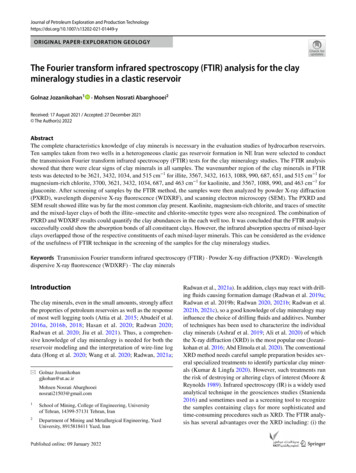
Journal of Petroleum Exploration and Production TechnologyFig. 1 Geographic location map of the studied area, modified from Jozanikohan et al. 20153204.6 and 3209.1 m, and the remaining samples, labeledwith “NP,” were selected from depths of 3180–3205.57 min the non-producing well. The outside parts of each coresample were carefully removed to avoid from the possiblecontaminations or oxidation effects. The samples werethen ground to pass through a 200-μm sieve and carefullymixed to give a homogeneous mixture. The location ofeach sample is shown in Fig. 2. All of the ten sampleswere made ready to be analyzed by the FTIR method.MethodsTransmission Fourier transform infrared (FTIR) spectroscopyThe vibrational spectra for all samples were obtainedusing a Bruker TENSOR 27 FTIR spectrometer, equippedwith an infrared source, potassium bromide beam splitter, and high sensitive DigiTectTMdetector system. Disksof 13-mm diameter and 1–2-mm thickness, consisting of13
Journal of Petroleum Exploration and Production TechnologyFig. 2 Schematic core samplelocations of the both wells.Sample codes and the lithological units are shown. Right:Gas-producing well, and Left:Non-producing wellapproximately 0.6 mg sample gently dispersed in 200 mgof KBr, were carefully heated at 120 C to minimize theamount of the absorbed water. Disks were then immediately and thoroughly scanned in the wavenumber region of4000–400 cm 1 in transmission mode with a resolution of4 cm 1 with 128 successive scans.Powder X‑ray diffraction (PXRD) analysisThe most important step in the quantitative XRD analysisis to prepare the samples with respect to all the possiblesources of error. To gain a preliminary knowledge of theexisting minerals, the randomly oriented powder sampleswere first exposed to the X-ray and analyzed. A Bruker AXS,D8 Advance X-ray powder diffractometer with CuKα radiation and a 2theta/theta goniometer was used for the XRDanalysis. Diffraction patterns of the samples were recordedby the step scanning from 4 to 70 degrees (2θ), with a stepsize of 0.02 and counting for 5 s per step at 40 kV and30 mA.Since the non-clays can cover up some basic reflectionsof the clay minerals, thus the non-clay separation is a necessary task which was performed based on the proceduredescribed by Moore & Reynolds (1989). The chemical13procedure for removal of XRD-proved non-clays, i.e.,carbonate and sulfate minerals was to use the mild heating of the samples in a C 2H3NaO2–CH3COOH buffer atpH 5 (Jackson and Barak 2005), and also with using thesodium salt of C 10H16N2O8 (EDTA) (Bodine and Fernalld1973), respectively. The iron oxide content of samples wasnegligible, and to avoid the risk of peak alteration in themixed-layer clay minerals and or dissolution of iron-richchlorite minerals, the iron content was not removed. Thephysical procedure for removal of other minerals such asquartz, plagioclase, and alkali feldspars was to settle themin a coarser residue of a wide-mouth glass tube, on thebasis of Stokes’ law. After several times of decantationthe supernate, the clay fraction ( 2 µm) was extractedafter 246 min at 20 C. To prevent the clays from formingthe polymineralic aggregates, a 0.1% solution of sodiumhexametaphosphate was used in the each removal stageto disperse the clay minerals into the individual colloidal particles. Four small homogeneous glass slides wereprepared from smearing the paste of 2 µm. The XRDanalyses were then performed from 4 to 40 (2θ) degrees onfour oriented clay small glass slides of naturally dried inthe air, saturated with the C2H6O2 (ethylene glycol) vapor,boiled in the hydrochloric acid, and heated.
Journal of Petroleum Exploration and Production TechnologyWavelength dispersive X‑ray fluorescence (WDXRF)𝛼 3 A b 3 𝛽 𝜔 3 Z 100k 3Elemental analysis of the Shurijeh samples was performed onan automated Philips MagiX PRO wavelength dispersive X-rayfluorescence (WDXRF) spectrometer. Loss on ignition (LOI)was also determined (Table 1). The mineral quantification based on a combined analysismethod (XRD‑XRF)Several distinguished researches have proved that the mineral quantification could be done by means of combination ofchemical and mineralogical data obtained from the XRF andXRD test, respectively (Paktunc 2001; Prandel et al. 2014;Jozanikohan et al. 2016; Zhang et al. 2020, 2021). Methodbasically includes solving a series of formulated simultaneous equations relating the chemical composition data to thepercentages of each individual mineral (Eq. 1 to i).𝛼 1 A b 1 𝛽 𝜔 1 Z 100k 1(1)𝛼 2 A b 2 𝛽 𝜔 2 Z 100k 2(2)(3)𝛼 i A b i 𝛽 𝜔 i Z 100k iwhere α i, β i, , ω i, and k i, display the ith elementpercentages in the each individual mineral phases and thewhole bulk rock, respectively. A, B, , and Z indicate thepresent phases percentages in the studied sample.In the current study, the combined XRD–XRF methodhas been used for the phase quantification purpose. Having identified the main constituents of the samples andthe relevant chemical formula from the PXRD analysis, aquantification method based on what explained above wereapplied, using the elemental analyses provided from theXRF data to estimate the mineral abundances.The average percentages of each individual phase andeach of the clay minerals are given in Tables 2 and 3,respectively.Table 1 XRF results of the Shurijeh core samplesCodeMgO (%)Al2O3 (%)SiO2 (%)SO3 (%)K2O (%)CaO (%)Fe2O3 (%)Na2O (%)LOI (%)Total 0Table 2 Mineral content of the Shurijeh core samplesCodeQuartz (%)Plagioclase (%)K-feldspar (%)Anhydrite (%)Carbonate (%)Hematite (%)Clays (%)Total 010010010010010013
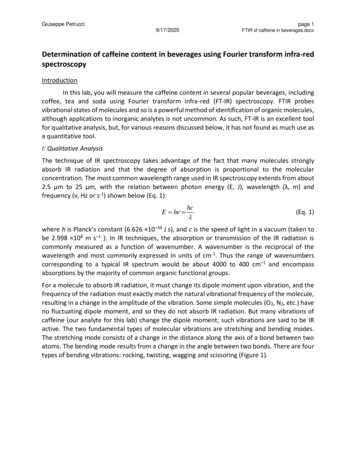
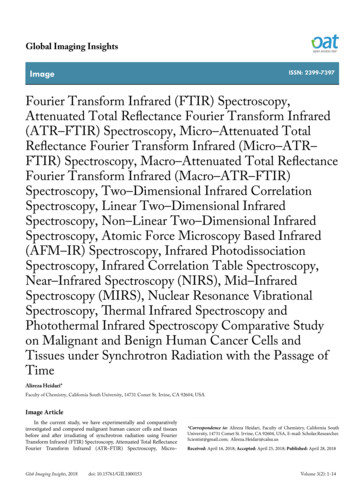
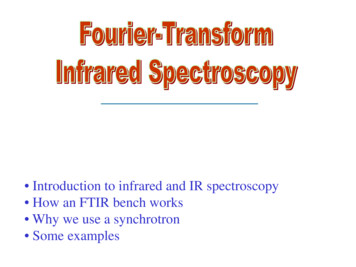
Journal of Petroleum Exploration and Production TechnologyTable 3 Clay contents of theShurijeh core samples, obtainedfrom the XRD testCodeKaolinite (%)Chlorite (%)Illite (%)Glauconite (%)Smectite (%)Mixedlayer Clays(%)Total 514.418.8The scanning electron microscopy (SEM) analysisThe scanning electron microscopy technique (SEM) wasengaged to characterize the morphology, geometry, and distribution patterns of clay minerals in some of the selectedsamples. The selection procedure was accomplished basedon the clay content of each sample determined by the XRDmethod. The selected samples (i.e., GP-3, GP-4, NP-2, andNP-3) were fully coated with thin layers of gold–palladiumfor 60 s. The SEM analyses were then conducted using aJEOL model JSM-840.The resultsThe data in Table 1 show the chemical composition of tenmentioned core samples in both wells, obtained from theXRF test.According to the whole-rock powder diffractometry,the main constituents of the samples from both wells arequartz, and plagioclase with the secondary minerals suchas clays, anhydrite, carbonates (dolomite and calcite), andK-feldspar (Fig. 3a). Hematite was observed in some fewsamples. These XRD results were found extremely useful inthe designing of the subsequent non-clay mineral removalsteps (Fig. 3b). The identified clay minerals were kaolinite, illite, glauconite, chlorite, smectite, and mixed layers ofillite–smectite, and chlorite–smectite types.The obtained SEM images are shown in Fig. 4. It isclear from Fig. 4 that the most common pore filling clayminerals included kaolinite with platy morphology andillite as microfibers. In all of the studied samples, kaolinitewere mainly found as several stacking of successive layers(e.g., Fig. 4a), and fully filled the pores. The fine illite fibers (Fig. 4b) were widely spread in the open pore space,changing the macro-porosities to micro-porosities. Theassemblages of mixed-layer clays such as illite–smectite13Fig. 3 a Whole-rock powder X-ray diffraction pattern of the samples under study (Sample code: NP-5); b The XRD diffraction pattern of the same sample. Chl Chlorite, Chl–Smectite Chlorite–smectite Ill Illite, Kao Kaolinite, Qtz Quartz, Pl Plagioclase,Hem Hematite, Anh Anhydrite, Dol Dolomiteare show in Fig. 4c. Figure 4d shows chlorite intercalatedwith kaolinite found as grain coatings. The restricted poregeometry characterized by the SEM test showed veryfine confined polygons with maximum 1.5 micro-meterdiameter.
Journal of Petroleum Exploration and Production TechnologyFig. 4 SEM images of thesamples understudy: a GP-3 at7000X magnification, 15 kV,and WD 23 mm; b GP-4 at25500X magnification, 30 kV,and WD 23 mm; c NP-2 at4000X magnification, 15 kV,and WD 24 mm; and d NP-3at 2500X magnification, 15 kV,and WD 24 mm. Kao: kaolinite, Ill: Illite, Ill/Sm: Illite–smectite, Chl: chloriteFigure 5 shows the infrared absorption spectra of theShurijeh core samples. The splitting bands in the regionof 800–400 cm 1 including 780, 693, 588, 533, 464, and428 cm 1 as well as one band at 1034 cm 1 indicate thefeldspar presence (Farmer 2000). According to the reportsof some researches (Ji et al. 2009), the IR transmissionspectra of carbonates include some distinctive features at3050–2850 c m 1, 2650–2500 c m 1, 1790–1820 c m 1,1400–1500 cm 1, 877 cm 1, 730 cm 1, and 710 cm 1. However, the peak at 877 cm 1 was only observed in the Shurijehsamples containing more than 10% carbonate (e.g., GP-4,NP-1, NP-3, NP-4, and NP-5). Dolomite, in comparison withcalcite, shows three characteristic absorptions at 3020, 2626,and 730 cm 1 (Ji et al. 2009). Since these FTIR bands are allpresent in the samples whose codes were mentioned above,the dolomite was identified as one of the components ofthe samples. The sulfates are demonstrated to have strongabsorption bands near 980 cm–1, 450 cm–1, 1150–1100 cm–1,and 675–590 cm–1 for S O4 different vibrations (Uusitaloet al. 2020). The vibrations observed at 650 cm–1, 525 cm 1,440–400 cm–1, and 300 cm–1 indicate the possible presenceof hematite (Ji et al. 2009). It is commonly believed that theSi–O stretching vibrations are observed at 800–1200 cm–1,and its relative bending bands are found in the 400–600 cm–1in the FTIR spectra of minerals (Matteson & Herron 1993).Although the samples were heated and dried before theanalysis, the clear band in the area 1640–1600 cm 1 could beassigned to the deformation vibrations of OH-adsorbed water(Kuligiewicz & Derkowski 2017) or it can be related to themagnesium-rich chlorite. The strong bands between 3400and 3750 cm–1 were assigned to the hydroxyl linkage (O–H)(Balan et al. 2001). However, the broad characteristic bandsat 3450 and 3622 cm–1 suggest the possibility of hydration orlayer hydrogen bonding in the samples (Kasprzhitskii et al.2018). The well-resolved bands at 1120–1000 cm 1 regionbelong to the Si–O stretching vibration of kaolinite (Madejová & Komadel 2001). Kaolinite (1:1 layer) always showsa narrow, weak absorption at 3620 cm 1 due to the innerOH hydroxyls. Other hydroxyls give bands at higher cm 1,while illite (2:1 layer) and smectite show wide absorption inthe region of 3650–2600 cm 1 with a shoulder peak (Balanet al. 2001). Most of the relatively strong O–H vibrationin smectite is from the water in the interlayer space of thesilica tetrahedral sheet, which results in a wide absorptionin the region of 3650–2600 cm 1 followed by the strongerabsorption in about 1600 cm 1 (Changwen et al. 2007). Thecorresponding values for each vibration bands are given inTable 4.The observed bands for each Shurijeh core samplein the range of 4000–400 c m –1 have been tentativelyassigned (Fig. 5 and Table 5). The presences of bandsat about 1086 cm 1, 798 cm 1, 778 cm 1, 695 cm 1, and468 cm 1 indicated that all of the samples were quartzrich. The absorption bands at 3696, 3622, 3450, 1033,914, 790, 693, 538, and 468 cm 1 distinctly indicated thatkaolinite was present in all of the samples. The observedabsorption bands of kaolinite were in the agreement withfindings of Yousefi et al. (2020). The clear signs of bandsat 3696, 3622, 3450, 2369, 1633, 1033 and 790 cm–1 indicated that illite was also present in all of the core samples,and similar results were reported by previous researchers (Pineau et al. 2020). To differentiate kaolinite fromillite, one should consider that the 1:1 layer clays (i.e.,kaolinite) always show a narrow and weak absorption in13
Journal of Petroleum Exploration and Production TechnologyFig. 5 FTIR spectra of core samples taken from the Shurijeh formation13
Journal of Petroleum Exploration and Production TechnologyTable 4 Important mineralIR bands with their possibleassignments (Farmer 2000;Balan et al. 2001; Nayak &Singh 2007)Band (cm 331094938914844790693538468Surface hydroxylsIn-phase symmetric stretching vibration; internal surface OH groupsOut-of-plane OH stretching vibrationsVibrations of two surface hydroxylsInner OH groups, lying between the sheets of tetrahedral and octahedral unitsAdsorbed water vibrations (H–O–H)H–O–H stretchingStretch vibration modes of S O4 tetrahedraStretch vibration modes of S O4 tetrahedraSi–O–Si, Si–O stretchingStretch vibration modes of S O4 tetrahedraDeformation bands of kaoliniteAl2OH bending bands of kaolinite AL–O–H vibrationsAlMgOHSi–O stretching, Si–O–Al stretching, (Al, Mg)–-O–H, Si–O–(Mg, Al) stretchingSi–O stretching, Si–O–Al stretchingSi–O bending, Si–O–Al stretchingSi–O bending, Si–O–Fe stretching3600 cm 1, while 2:1 layer clays (i.e., illite) display wideabsorption in the 2600 3650 c m 1 accompanied by ashoulder peak. The band at 914 cm–1 was only observedin samples containing more than 6% illite (e.g., GP-3,GP-4, NP-3, NP-4, and NP-5). The absorption bands at3560 cm 1, 3542–3534 cm 1, 1076 cm 1, 995 cm 1, and463 cm 1 were interpreted as being due to the presence ofglauconite. Peaks near 3574 cm 1, 3420 cm 1, 1630 cm 1,1090 c m 1, 995 c m 1, 740–700 c m 1, 661–650 c m 1,and 522 c m 1 were assigned to magnesium-rich chlorite. Characteristic features at 3621 c m 1, 3420 c m 1,1039 cm 1, 914 cm 1, and 468 cm 1 were considered forthe smectite presence. Whereas 1111 c m –1,1102 c m –1,1094 cm–1,1015 cm 1, 610 cm 1, 659 cm 1, and 591 cm 1were indicative of anhydrite, 3020 c m –1 , 2922 c m –1 ,2874 cm–1, 2626 cm–1, 1798 cm–1, 1426 cm–1, 876 cm–1,and 730 cm–1 showed the possibility of the carbonate presence. Core samples containing mixed-layer clay mineralsshowed overlapped absorptions of both clay types whichwere interlayered together. For instance, the overlap ofillite absorption band at 3630 cm 1 with smectite at 3635and 3406 cm 1 (due to the occurrence of absorption ofinterlayer water) were observed in the samples containingmixed-layer illite–smectite.Peak assignments were mostly consistent with thosein the previous literature (Repacholi 1994; Madejová &Komadel 2001; Madejová, 2003; Vaculíková & Plevová,2005; Changwen et al. 2007; Nayak & Singh 2007; Ji et al.2009; Liu et al. 2009; Papakosta et al. 2020; Pineau et al.2020; Yousefi et al. 2020).DiscussionFrom Fig. 5, it was obvious that the clay minerals werepresent in all samples; thus, it was decided to check theaccuracy of FTIR prediction with XRD, and XRF methodsto demonstrate the clay minerals existence in the samples.It is clear from the results of the WDXRF test (Table 1)that the silicon was present in the major quantities in bothwells, while the aluminum oxide was moderate and theother elements such as sulfur, calcium, potassium, sodium,magnesium, and iron were present in only minor amounts.Considering the mineralogy of the Shurijeh, the obtainedresults are meaningful.The combined bulk powder X-ray diffractometry, X-rayfluorescence, and scanning electron microscopy (SEM)analyses of core samples showed that the main mineralconstituents were quartz and plagioclase, with some quantities of other minerals such as the clay minerals, anhydrite, carbonates (calcite/dolomite), alkali feldspars, andhematite. The most important advantage of quantificationusing the XRF data is to allow for the quantitative calculations without the presence of any standard sample.The vast majority of clay minerals in the studied wellswere illite, chlorite, and kaolinite. The most abundant claymineral was illite in the both wells, but in few samples,there were signs of glauconite, smectite and mixed-layerclay minerals including I/S (illite–smectite) and chlorite–smectite. Among these rarely occurred clay minerals, glauconite was more common, while the smectite and13
Journal of Petroleum Exploration and Production TechnologyTable 5 Shurijeh formation FTIR bands with mineral assignmentsCode Mineral assignments (Band)GP-1 Quartz (1877, 1172, 1084, 779, 693, 518, and 463 c m 1), feldspar (1036, splitting bands in the region 800–400 c m 1 including 779, 693,585, and 463 c m 1), traces of carbonates (2926, 2530, 1791, 1426, and 731 c m 1), traces of anhydrite (995 and 585 c m 1), illite (3621,3439, 1036, and 518 cm 1), magnesium-rich chlorite (3575, 3423, 1618, 1084, 995,693, 649, and 518 cm 1), kaolinite (3717, 3621,3439, 1036, 693, and 463 cm 1), and glauconite (3575, 1084, 995, and 463 cm 1)GP-2 Quartz (1878, 1172, 1088, 779, 687, 515, and 463 cm 1), feldspar (1034, splitting bands in the region 800–400 c m 1 including 779, 687,595, and 463 c m 1), anhydrite (990 and 595 c m 1), traces of carbonates (2926, 2524, 1784, 1426, and 731 c m 1), illite (3621, 3432,1034, and 515 c m 1), magnesium-rich chlorite (3567, 3432, 1613, 1088, 990, 687, 651, and 515 cm 1), kaolinite (3700, 3621, 3432,1034, 687, and 463 c m 1), and glauconite (3567, 1088, 990, and 463 cm 1)GP-3 Quartz (1881, 1172, 1084, 780, 687, 522, and 467 cm 1), feldspar (1032, splitting bands in the region 800–400 c m 1 including 780, 687,585, and 467 c m 1), traces of carbonates (2927, 1791, and 1426 c m 1), traces of anhydrite (995 and 585 c m 1), traces of hematite (649and 522 cm 1), illite (3612, 3431, 1032, 914, and 522 cm 1), magnesium-rich chlorite (3578, 3431, 1629, 1084, 995, 687, 649, and522 cm 1), and kaolinite (3712, 3612, 3431, 1032, 687, and 467 cm 1)GP-4 Quartz (1875, 1172, 1081, 784, 690, 523, and 468 cm 1), feldspar (1032, splitting bands in the region 800–400 c m 1 including 784,690, 585, and 468 c m 1), carbonates (2926, 2529, 1791, 1443, 889, and 731 c m 1), traces of hematite (652 and 523 cm 1), illite (3612,3435, 1032, 914, and 523 cm 1), magnesium-rich chlorite (3578, 3435, 1625, 1081, 995, 690, 652, and 523 cm 1), kaolinite (3714,3612, 3435, 1032, 690, and 468 cm 1), and smectite (3612, 3420, 1032, 914, and 468 c m 1)GP-5 Quartz (1878, 1172, 1087, 782, 686, 514, and 463 cm 1), feldspar (1036, splitting bands in the region 800–400 c m 1 including 782, 686,592, and 463 c m 1), anhydrite (998 and 592 c m 1), traces of carbonates (2925, 2527, 1792, 1436, and 730 c m 1), illite (3621, 3436,1036, and 514 c m 1), magnesium-rich chlorite (3572, 3436, 1613, 1087, 998, 686, 649, and 514 cm 1), kaolinite (3712, 3621, 3436,1036, 686, and 463 c m 1), and glauconite (3572, 1087, 998, and 463 cm 1)NP-1 Quartz (1875, 1172, 1083, 781, 692, 520, and 464 cm 1), feldspar (1029, splitting bands in the region 800–400 c m 1 including 781, 692,587, and 464 c m 1), carbonates (3018, 2528, 1792, 1441, 886, and 731 c m 1), traces of an
Transmission Fourier transform infrared (FTIR) spectroscopy The vibrational spectra for all samples were obtained using a Bruker TENSOR 27 FTIR spectrometer, equipped with an infrared source, potassium bromide beam split-ter, and high sensitive DigiTectTMdetector system. Di