Transcription
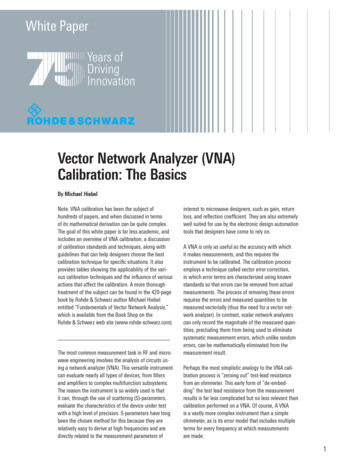
Keysight TechnologiesNetwork Analyzer BasicsTraining Deliverable
AbstractThis presentation covers the principles ofmeasuring high-frequency electrical networkswith network analyzers. You will learn whatkinds of measurements are made with networkanalyzers, and how they allow you to characterize both linear and nonlinear behavior ofyour devices. The session starts with RFfundamentals such as transmission lines andthe Smith chart, leading to the concepts ofreflection, transmission and S-parameters.The next section covers the major componentsin a network analyzer, including the advantagesand limitations of different hardware approaches.Error modeling, accuracy enhancement, andvarious calibration techniques will then be presented. Finally, some typical swept-frequencyand swept-power measurements commonlyperformed on filters and amplifiers will becovered. An appendix is also included withinformation on advanced topics, with pointersto more information.2
Network Analysisis Not.This module is not about computer networks!When the name “network analyzer” was coinedmany years ago, there were no such things ascomputer networks. Back then, networksalways referred to electrical networks. Today,when we refer to the things that networkanalyzers measure, we speak mostly aboutdevices and components.What Types of DevicesAre Tested?Here are some examples of the types ofdevices that you can test with networkanalyzers. They include both passive andactive devices (and some that have attributesof both). Many of these devices need to becharacterized for both linear and nonlinearbehavior. It is not possible to completelycharacterize all of these devices with justone piece of test equipment.The next slide shows a model covering the widerange of measurements necessary for complete linear and nonlinear characterizationof devices. This model requires a variety ofstimulus and response tools. It takes a largerange of test equipment to accomplish all ofthe measurements shown on this chart. Someinstruments are optimized for one test only(like bit-error rate), while others, like networkanalyzers, are much more general purpose innature. Network analyzers can measure bothlinear and nonlinear behavior of devices,although the measurement techniques aredifferent (frequency versus power sweeps forexample). This module focuses on sweptfrequency and swept-power measurementsmade with network analyzers3
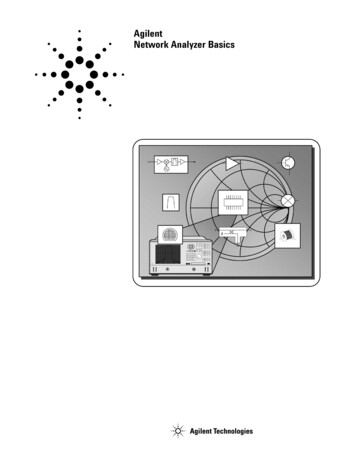
Device TestMeasurement ModelHere is a key to many of theabbreviations used at right:Response84000Ded. TestersVSA8400 series high-volume RFIC testerDedicated (usually one-box) testersVector signal analyzerSAVNASpectrum analyzerVector signal analyzerTG/SASNATracking generator/spectrum analyzerScalar network analyzerNF Mtr.Imped. An.Power Mtr.Det./ScopeNoise-figure meterImpedance analyzer (LCR meter)Power meterDiode ��nConstell.EVMEyeGDHarm. Dist.NFRegrowthAdjacent channel powerAM to PM conversionBit-error rateGain compressionConstellation diagramError-vector magnitudeEye diagramGroup delayHarmonic distortionNoise figureSpectral regrowthRtn LsVSWRReturn lossVoltage standing wave ratio
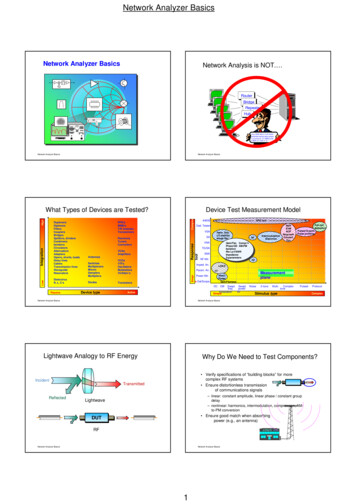
Lightwave Analogyto RF EnergyOne of the most fundamental concepts ofhigh-frequency network analysis involvesincident, reflected and transmitted wavestraveling along transmission lines. It is helpfulto think of traveling waves along a transmissionline in terms of a lightwave analogy. We canimagine incident light striking some opticalcomponent like a clear lens. Some of the lightis reflected off the surface of the lens, but mostof the light continues on through the lens. Ifthe lens were made of some lossy material,then a portion of the light could be absorbedwithin the lens. If the lens had mirrored surfaces, then most of the light would be reflectedand little or none would be transmittedthrough the lens. This concept is valid for RFsignals as well, except the electromagneticenergy is in the RF range instead of the opticalrange, and our components and circuits areelectrical devices and networks instead oflenses and mirrors.Network analysis is concerned with the accurate measurement of the ratios of the reflectedsignal to the incident signal, and the transmitted signal to the incident signal.5
Why Do We Need toTest Components?–––Components are tested for a variety of reasons.Many components are used as “buildingblocks” in more complicated RF systems.For example, in most transceivers there areamplifiers to boost LO power to mixers, andfilters to remove signal harmonics. Often, R&Dengineers need to measure these componentsto verify their simulation models and theiractual hardware prototypes. For componentproduction, a manufacturer must measurethe performance of their products so theycan provide accurate specifications. This isessential so prospective customers will knowhow a particular component will behave intheir application.---When used in communications systems to passsignals, designers want to ensure the component or circuit is not causing excessive signaldistortion. This can be in the form of linear distortion where flat magnitude and linear phaseshift versus frequency is not maintained overthe bandwidth of interest, or in the form ofnonlinear effects like intermodulation distortion.Often it is most important to measure howreflective a component is, to ensure that itabsorbs energy efficiently. Measuringantenna match is a good example.6
The Need for BothMagnitude and PhaseIn many situations, magnitude-only data issufficient for out needs. For example, we mayonly care about the gain of an amplifier or thestop-band rejection of a filter. However, as wewill explore throughout this paper, measuringphase is a critical element of network analysis.Complete characterization of devices andnetworks involves measurement of phaseas well as magnitude. This is necessary fordeveloping circuit models for simulation and todesign matching circuits based on conjugatematching techniques. Time-domain characterization requires magnitude and phaseinformation to perform the inverse-Fouriertransform. Finally, for best measurementaccuracy, phase data is required to performvector error correction.–––––Agenda----In this section we will review reflection andtransmission measurements. We will see thattransmission lines are needed to convey RFand microwave energy from one point toanother with minimal loss, that transmissionlines have a characteristic impedance, and thata termination at the end of a transmission linemust match the characteristic impedance ofthe line to prevent loss of energy due toreflections. We will see how the Smith chartsimplifies the process of converting reflectiondata to the complex impedance of the termination. For transmission measurements, we willdiscuss not only simple gain and loss but distortion introduced by linear devices. We willintroduce S-parameters and explain why theyare used instead of h-, y-, or z-parameters atRF and microwave frequencies.---------7
Transmission Line BasicsThe need for efficient transfer of RF power isone of the main reasons behind the use oftransmission lines. At low frequencies wherethe wavelength of the signals are much largerthan the length of the circuit conductors, asimple wire is very useful for carrying power.Current travels down the wire easily, andvoltage and current are the same no matterwhere we measure along the wire.–––At high frequencies however, the wavelengthof signals of interest are comparable to ormuch smaller than the length of conductors.In this case, power transmission can best bethought of in terms of traveling waves.––––Of critical importance is that a lossless transmission line takes on a characteristic impedance(Zo). In fact, an infinitely long transmission lineappears to be a resistive load! When the transmission line is terminated in its characteristicimpedance, maximum power is transferred tothe load. When the termination is not Zo, theportion of the signal which is not absorbed bythe load is reflected back toward the source.This creates a condition where the envelopevoltage along the transmission line varies withposition. We will examine the incident andreflected waves on transmission lines withdifferent load conditions in following slides8
Transmission Line Z0–––RF transmission lines can be made in a varietyof transmission media. Common examples arecoaxial, waveguide, twisted pair, coplanar,stripline and microstrip. RF circuit design onprinted-circuit boards (PCB) often use coplanaror microstrip transmission lines. The fundamental parameter of a transmission line is itscharacteristic impedance Zo. Zo describes therelationship between the voltage and currenttraveling waves, and is a function of the variousdimensions of the transmission line and thedielectric constant (εt ) of the non-conductingmaterial in the transmission line. For most RFsystems, Zo is either 50 or 75 ohms.For low-power situations (cable TV, for example) coaxial transmission lines are optimizedfor low loss, which works out to about 75 ohms(for coaxial transmission lines with air dielectric). For RF and microwave communicationand radar applications, where high power is oftenencountered, coaxial transmission lines aredesigned to have a characteristic impedanceof 50 ohms, a compromise between maximumpower handling (occurring at 30 ohms) andminimum loss.9
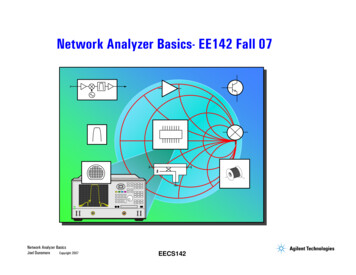
Power TransferEfficiencyBefore we begin our discussion about transmission lines, let us look at the condition formaximum power transfer into a load, given asource impedance of Rs. The graph aboveshows that the matched condition (RL RS)results in the maximum power dissipated inthe load resistor. This condition is true whetherthe stimulus is a DC voltage source or anRF sinusoid.For maximum transfer of energy into atransmission line from a source or from atransmission line to a load (the next stage ofan amplifier, an antenna, etc.), the impedanceof the source and load should match the characteristic impedance of the transmission line.In general, then, Zo is the target for input andoutput impedances of devices and networks.When the source impedance is not purelyresistive, the maximum power transfer occurswhen the load impedance is equal to the complex conjugate of the source impedance. Thiscondition is met by reversing the sign of theimaginary part of the impedance. For example,if RS 0.6 j0.3, then the complexconjugate RS* 0.6 - j0.3.Sometimes the source impedance is adjustedto be the complex conjugate of the loadimpedance. For example, when matching to anantenna, the load impedance is determined bythe characteristics of the antenna. A designerhas to optimize the output match of the RFamplifier over the frequency range of theantenna so that maximum RF power istransmitted through the antenna.10
Transmission LineTerminated With Z 0Let’s review what happens when transmissionlines are terminated in various impedances,starting with a Zo load. Since a transmissionline terminated in its characteristic impedanceresults in maximum transfer of power to theload, there is no reflected signal. This resultis the same as if the transmission line wasinfinitely long. If we were to look at the envelope of the RF signal versus distance alongthe transmission line, it would be constant (nostanding-wave pattern). This is because thereis energy flowing in one direction only.11
Transmission Line Terminatedwith Short, OpenNext, let’s terminate our line in a short circuit.Since purely reactive elements cannot dissipate any power, and there is nowhere else forthe energy to go, a reflected wave is launchedback down the line toward the source. ForOhm’s law to be satisfied (no voltage acrossthe short), this reflected wave must be equal involtage magnitude to the incident wave, andbe 180 out of phase with it. This satisfies thecondition that the total voltage must equal zeroat the plane of the short circuit. Our reflectedand incident voltage (and current) waves willbe identical in magnitude but traveling in theopposite direction.Now let us leave our line open. This time,Ohm’s law tells us that the open can supportno current. Therefore, our reflected currentwave must be 180 out of phase with respectto the incident wave (the voltage wave will bein phase with the incident wave). This guarantees that current at the open will be zero.Again, our reflected and incident current (andvoltage) waves will be identical in magnitude,but traveling in the opposite direction. For boththe short and open cases, a standing-wavepattern will be set up on the transmission line.The valleys will be at zero and the peaks attwice the incident voltage level. The peaks andvalleys of the short and open will be shifted inposition along the line with respect to eachother, in order to satisfy Ohm’s law asdescribed above.12
Transmission LineTerminated with 25 ΩFinally, let’s terminate our line with a 25 Ωresistor (an impedance between the full reflection of an open or short circuit and the perfecttermination of a 50 Ω load). Some (but not all)of our incident energy will be absorbed in theload, and some will be reflected back towardsthe source. We will find that our reflected voltage wave will have an amplitude 1/3 that ofthe incident wave, and that the two waves willbe 180o out of phase at the load. The phaserelationship between the incident and reflectedwaves will change as a function of distancealong the transmission line from the load. Thevalleys of the standing-wave pattern will nolonger be zero, and the peak will be less thanthat of the short/open case.The significance of standing waves should notgo unnoticed. Ohm’s law tells us the complexrelationship between the incident and reflectedsignals at the load. Assuming a 50-ohmsource, the voltage across a 25-ohm loadresistor will be two thirds of the voltage acrossa 50-ohm load. Hence, the voltage of thereflected signal is one third the voltage of theincident signal and is 180 out of phase with it.However, as we move away from the loadtoward the source, we find that the phasebetween the incident and reflected signalschanges! The vector sum of the two signalstherefore also changes along the line, producing the standing wave pattern. The apparentimpedance also changes along the linebecause the relative amplitude and phase ofthe incident and reflected waves at any givenpoint uniquely determine the measured impedance. For example, if we made a measurementone quarter wavelength away from the 25-ohmload, the results would indicate a 100-ohmload. The standing wave pattern repeatsevery half wavelength, as does the apparentimpedance.13
High-FrequencyDevice CharacterizationNow that we fully understand the relationshipof electromagnetic waves, we must alsorecognize the terms used to describe them.Common network analyzer terminology hasthe incident wave measured with the R (forreference) receiver. The reflected wave is measured with the A receiver and the transmittedwave is measured with the B receiver. Withamplitude and phase information of thesethree waves, we can quantify the reflectionand transmission characteristics of our deviceunder test (DUT). Some of the common measured terms are scalar in nature (the phasepart is ignored or not measured), while othersare vector (both magnitude and phase are measured). For example, return loss is a scalarmeasurement of reflection, while impedanceresults from a vector reflection measurement.Some, like group delay, are purely phaserelated measurements.Ratioed reflection is often shown as A/R andratioed transmission is often shown as B/R,relating to the measurement receivers usedin the network analyzer14
Reflection ParametersLet’s now examine reflection measurements.The first term for reflected waves is reflectioncoefficient gamma (ΓΓ). Reflection coefficient isthe ratio of the reflected signal voltage to theincident signal voltage. It can be calculatedas shown above by knowing the impedancesof the transmission line and the load. Themagnitude portion of gamma is called rho (ρ).A transmission line terminated in Zo will haveall energy transferred to the load; henceVrefl 0 and ρ 0. When ZL is not equal to Zo,some energy is reflected and ρ is greater thanzero. When ZL is a short or open circuit, allenergy is reflected and ρ 1. The range ofpossible values for ρ is therefore zero to one.Since it is often very convenient to showreflection on a logarithmic display, the secondway to convey reflection is return loss. Returnloss is expressed in terms of dB, and is a scalarquantity. The definition for return loss includesa negative sign so that the return loss value isalways a positive number (when measuringreflection on a network analyzer with a logmagnitude format, ignoring the minus signgives the results in terms of return loss).Return loss can be thought of as the numberof dB that the reflected signal is below theincident signal. Return loss varies betweeninfinity for a Zo impedance and 0 dB for anopen or short circuit.As we have already seen, two waves traveling inopposite directions on the same transmissionline cause a “standing wave”. This conditioncan be measured in terms of the voltagestanding-wave ratio (VSWR or SWR for short).VSWR is defined as the maximum value of theRF envelope over the minimum value of theenvelope. This value can be computed as(1 ρ)/(1–ρ). VSWR can take ?15
impedance graphically? Since there is a one-toone correspondence between complex reflection coefficient and impedance, we can mapone plane onto the other. If we try to map thepolar plane onto the rectilinear impedanceplane, we find that we have problems. First ofall, the rectilinear plane does not have valuesto infinity. Second, circles of constant reflection coefficient are concentric on the polarplane but not on the rectilinear plane, makingit difficult to make judgments regarding twodifferent impedances. Finally, phase anglesplot as radii on the polar plane but plot asarcs on the rectilinear plane, making it difficultto pinpoint.Smith Chart ReviewOur network analyzer gives us complex reflection coefficient. However, we often want toknow the impedance of the DUT. The previousslide shows the relationship between reflectioncoefficient and impedance, and we could manually perform the complex math to find theimpedance. Although programmable calculators and computers take the drudgery outof doing the math, a single number does notalways give us the complete picture. In addition, impedance almost certainly changes withfrequency, so even if we did all the math, wewould end up with a table of numbers thatmay be difficult to interpret.A simple, graphical method solves this problem. Let’s first plot reflection coefficient usinga polar display. For positive resistance, theabsolute magnitude of varies from zero(perfect load) to unity (full reflection) at someangle. So we have a unit circle, which marksthe boundary of the polar plane shown on theslide. An open would plot at 1 0o; a short at1 180o; a perfect load at the center, and soon. How do we get from the polar data to16The proper solution was first used in the1930’s, when Phillip H. Smith mapped theimpedance plane onto the polar plane, creatingthe chart that bears his name (the venerableSmith chart). Since unity at zero degreeson the polar plane represents infinite impedance, both plus and minus infinite reactances,as well as infinite resistance can be plotted.On the Smith chart, the vertical lines onthe rectilinear plane that indicate values ofconstant resistance map to circles, and thehorizontal lines that indicate values of constantreactance map to arcs. Zo maps to the exactcenter of the chart.In general, Smith charts are normalized to Zo;that is, the impedance values are divided byZo. The chart is then independent of the characteristic impedance of the system in question.Actual impedance values are derived by multiplying the indicated value by Zo. For example,in a 50-ohm system, a normalized value of0.3 - j0.15 becomes 15 - j7.5 oh
Jul 31, 2014 · Network Analyzer Basics Training Deliverable. Abstract This presentation covers the principles of measuring high-frequency electrical networks with network analyzers. You will learn what kinds of measurements are made with netw