Transcription
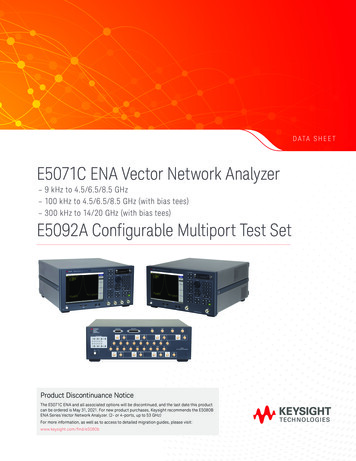
Network Analyzer Basics- EE142 Fall 07Network Analyzer BasicsJoel DunsmoreCopyright 2007EECS142
Lightwave Analogy to RF twork Analyzer BasicsJoel DunsmoreCopyright 2007EECS142
Why Do We Need to Test Components? Verify specifications of “building blocks” for more complex RF systemsCreate models for simulationCheck our simulation models against a real circuitEnsure good match when absorbingpower (e.g., an antenna)KPWRNetwork Analyzer BasicsJoel DunsmoreCopyright 2007EECS142FM 97
The Need for Both Magnitude and PhaseS211. Complete characterizationof linear networksS11S22S122. Complex impedance neededto design matching circuits4. Time-domain characterizationMag3. Complex values neededfor device modelingTime5. Vector-error correctionHigh-frequency transistor modelErrorBaseCollectorEmitterNetwork Analyzer BasicsJoel DunsmoreCopyright 2007EECS142MeasuredActual
Transmission Line Basics I-Low frequencies wavelengths wire length current (I) travels down wires easily for efficient power transmission measured voltage and current not dependent on position along wireHigh frequencies wavelength or length of transmission medium need transmission lines for efficient power transmission matching to characteristic impedance (Zo) is very importantfor low reflection and maximum power transfer measured envelope voltage dependent on position along lineNetwork Analyzer BasicsJoel DunsmoreCopyright 2007EECS142
Transmission line Zo Zo determines relationship between voltage and current wavesZo is a function of physical dimensions and εrZo is usually a real impedance (e.g. 50 or 75 ohms)1.5Twisted-pairattenuation is lowest at77 ohms1.4Waveguide1.3abCoaxialεrhnormalized values1.250 ohm standard1.11.00.90.8hpower handling capacity peaksat 30 ohms0.7w10.6ww20.510CoplanarNetwork Analyzer BasicsJoel DunsmoreCopyright 2007203040characteristic impedancefor coaxial airlines (ohms)MicrostripEECS1425060 70 80 90 100
Power Transfer EfficiencyRSFor complex impedances, maximum powertransfer occurs when ZL ZS* (conjugate match)RLRs1.2 jXLoad Power(normalized)1-jX0.80.6RL0.40.20012345678910RL / RSMaximum power is transferred when RL RSNetwork Analyzer BasicsJoel DunsmoreCopyright 2007EECS142
Transmission Line Terminated with ZoZs ZoZo characteristic impedanceof transmission lineZoV incVrefl 0! (all the incident poweris absorbed in the load)For reflection, a transmission line terminated in Zobehaves like an infinitely long transmission lineNetwork Analyzer BasicsJoel DunsmoreCopyright 2007EECS142
Transmission Line Terminated with Short, OpenZs ZoV incVreflIn-phase (0o) for open,out-of-phase (180o) for shortFor reflection, a transmission line terminated ina short or open reflects all power back to sourceNetwork Analyzer BasicsJoel DunsmoreCopyright 2007EECS142
Transmission Line Terminated with 25 ΩZs ZoZL 25 ΩV incVreflStanding wave pattern does notgo to zero as with short or openNetwork Analyzer BasicsJoel DunsmoreCopyright 2007EECS142
High-Frequency Device NSMISSIONREFLECTIONReflectedIncident SWRS-ParametersS11, S22Network Analyzer BasicsJoel DunsmoreCopyright 2007ReflectionCoefficientΓ, nceR jX,G jB BRGroupDelayGain / LossS-ParametersS21, se
Reflection ParametersReflectionCoefficientΓVreflected ρVincidentReturn loss -20 log(ρ),ρΦ EmaxEmin ZL ZOZ L ZOΓVoltage Standing Wave RatioVSWR EmaxEmin 1 ρ1-ρFull reflection(ZL open, short)No reflection(ZL Zo)0ρ1 dBRL0 dB1VSWR Network Analyzer BasicsJoel DunsmoreCopyright 2007EECS142
Transmission ParametersVVIncidentDUTTransmission Coefficient ΤVInsertion Loss (dB) - 20 LogVVGain (dB) 20 LogVNetwork Analyzer BasicsJoel DunsmoreCopyright 2007TransV TransmittedTransmittedVTransIncident - 20 logInc 20 logIncEECS142 τττ φ
Linear Versus Nonlinear BehaviorA * Sin 360o * f (t - to)ALinear behavior: Timeto Sin 360o * f * tATimef1phase shift to * 360o * fDUTInputinput and output frequencies are the same(no additional frequencies created)output frequency only undergoesmagnitude and phase changeFrequencyOutputNonlinear behavior:f1 FrequencyTime fNetwork Analyzer BasicsJoel DunsmoreCopyright 2007Frequency1EECS142output frequency may undergofrequency shift (e.g. with mixers)additional frequencies created(harmonics, intermodulation)
Criteria for Distortionless TransmissionLinear NetworksLinear phase overbandwidth of interestConstant amplitude overbandwidth of interestPhaseMagnitudeFrequencyFrequencyNetwork Analyzer BasicsJoel DunsmoreCopyright 2007EECS142
Magnitude Variation with FrequencyF(t) sin wt 1/3 sin 3wt 1/5 sin 5wtTimeTimeMagnitudeLinear NetworkFrequencyNetwork Analyzer BasicsJoel DunsmoreCopyright 2007FrequencyEECS142Frequency
Phase Variation with FrequencyF(t) sin wt 1 /3 sin 3wt 1 /5 sin 5wtLinear NetworkTimeMagnitudeTimeFrequency0 FrequencyFrequency-180 -360 Network Analyzer BasicsJoel DunsmoreCopyright 2007EECS142
Deviation from Linear PhaseUse electrical delay to removelinear portion of phase responseRF filter responseLinear electrical length addedDeviation from linear phasePhase 1 /DivooPhase 45 /Div(Electrical delay function) FrequencyyieldsFrequencyLow resolutionNetwork Analyzer BasicsJoel DunsmoreCopyright 2007FrequencyHigh resolutionEECS142
Group DelayFrequencyωtgGroup delay ripple ωPhasetoφAverage delay φFrequencyGroup Delay (t ) g d φdωφωφ 1360o*dφdf in radians in radians/sec group-delay ripple indicates phase distortionaverage delay indicates electrical length of DUTaperture of measurement is very importantin degreesf in Hertz (ω 2 π f)Network Analyzer BasicsJoel DunsmoreCopyright 2007EECS142
PhasePhaseWhy Measure Group Delay?ff d φdωGroupDelayGroup Delay d φdωfSame p-p phase ripple can result in different group delayNetwork Analyzer BasicsJoel DunsmoreCopyright 2007EECS142f
Characterizing Unknown DevicesUsing parameters (H, Y, Z, S) to characterize devices: gives linear behavioral model of our devicemeasure parameters (e.g. voltage and current) versus frequency undervarious source and load conditions (e.g. short and open circuits)compute device parameters from measured datapredict circuit performance under any source and load conditionsH-parametersV1 h11I1 h12V2I2 h21I1 h22V2Network Analyzer BasicsJoel DunsmoreCopyright 2007Y-parametersI1 y11V1 y12V2I2 y21V1 y22V2Z-parametersV1 z11I1 z12I2V2 z21I1 z22I2h11 V1I1V2 0(requires short circuit)h12 V1V2I1 0(requires open circuit)EECS142
Why Use S-Parameters?relatively easy to obtain at high frequencies measure voltage traveling waves with a vector network analyzer don't need shorts/opens which can cause active devices to oscillate or self-destruct relate to familiar measurements (gain, loss, reflection coefficient .) can cascade S-parameters of multiple devices to predict system performance can compute H, Y, or Z parameters from S-parameters if desired can easily import and use S-parameter files in our electronic-simulation tools a1S 21IncidentTransmittedb2S 11ReflectedDUTb1TransmittedS 22ReflectedPort 2Port 1S 12Incidentb 1 S 11 a 1 S 12 a 2b 2 S 21 a 1 S 22 a 2Network Analyzer BasicsJoel DunsmoreCopyright 2007EECS142a2
Measuring S-Parametersa1ForwardS 11 S 21 SbSIncidentIncidenta2 0b1 a1ba2 0S 22 2 a1a2 0S 12 a1 entSDUTb2 a2bEECS142a1 0b222Reversea212a1 01 a2ReflectedLoadNetwork Analyzer BasicsJoel DunsmoreCopyright dentbTransmitted21Incident
Equating S-Parameters with CommonMeasurement TermsS11 forward reflection coefficient (input match)S22 reverse reflection coefficient (output match)S21 forward transmission coefficient (gain or loss)S12 reverse transmission coefficient (isolation)Remember, S-parameters are inherentlycomplex, linear quantities -- however, weoften express them in a log-magnitude formatNetwork Analyzer BasicsJoel DunsmoreCopyright 2007EECS142
Generalized Network Analyzer Block SEPARATIONINCIDENT (R)REFLECTED(A)TRANSMITTED(B)RECEIVER / DETECTORPROCESSOR / DISPLAYNetwork Analyzer BasicsJoel DunsmoreCopyright 2007EECS142
Source Supplies stimulus for systemSwept frequency or powerTraditionally NAs used separate sourceMost Agilent analyzers sold today haveintegrated, synthesized sourcesNetwork Analyzer BasicsJoel DunsmoreCopyright 2007EECS142
IncidentTransmittedDUTSignal SeparationReflectedSOURCESIGNALSEPARATIONINCIDENT (R)REFLECTED(A)TRANSMITTED(B)RECEIVER / DETECTORPROCESSOR / DISPLAYmeasure incident signal for reference separate incident and reflected signals splitterbridgeDetectordirectionalcouplerNetwork Analyzer BasicsJoel DunsmoreCopyright 2007Test PortEECS142
Consider the Wheatstone Bridge:If the bridge is balanced Vd Vd-, and Idet 0Vd R1 R 4R2 VinR3 Vin Then; Vd R2R3R1 R 2R3 R 4 I det 0VinIdetFurther, it can be shown, that the input impedance of abalanced bridge follows the equation: Zin 2 R1 R3 R2 R 4Network Analyzer BasicsJoel DunsmoreCopyright 2007EECS142
We can morph this Wheatstone Bridge into a “Directional Bridge”with explicit ports by noting that the floating voltage source can bereplaced with a transformer coupled port, and Rdet can beconnected through a transmission line (representing a cable or port)RsR1Vd R4Vd-VsR2R3Isolated PortNetwork Analyzer BasicsJoel DunsmoreCopyright 2007EECS142
We would like the bridge to be matched so Rs2 R1*R3 R2*R4.In this condition, Vin Vs/2.If we fix R4 Rs, then R2 Rs as well, and we can replace R4 witha transmission line or cable of impedance Rs. Now we have threewell defined ports, and we can see that the port replacing thedetector port is isolated.Network Analyzer BasicsJoel DunsmoreCopyright 2007EECS142
So, in the isolation direction it is clear that no signal appears atthe isolated port, as the current divides equally across the bridge,if the test port is terminated in RsNetwork Analyzer BasicsJoel DunsmoreCopyright 2007EECS142
Now we can set the forward loss of the bridge. The voltage onthe test port is equal to the voltage across R1. We have completeflexibility to set any ratio we want. In this case let’s choose thevoltage to be 5/6 of Vin. Then Vd Vd- (1/6)Vin. The loss fromInput Port to output port is 20*log(5/6) -1.58 dB.These are quite convenient values: R4 50 - R2 50R1/(R2 R1) 5/6 - R1 5*R2 250;And because R1*R3 R2*R4 - R3 10;Network Analyzer BasicsJoel DunsmoreCopyright 2007EECS142
Now lets look how to “reverse” the power flow, and see what couplesinto the isolated port (we’ll now call it the Coupled Port) when we putthe source at the test port, and redraw the figure (no connectionchanges) to highlight the coupled port.Now the coupled port appears in oneleg of the bridge. Next we’ll move thesource from the input to the test port(and make the input into a port as well)Network Analyzer BasicsJoel DunsmoreCopyright 2007EECS142
Finally, we can compute the coupling factor of the bridge. In thecoupling direction, the voltage across the coupled port is 1/6 *VTP,or -15.5 dB. We can set either the loss of the bridge or thecoupling, but once we set one, the other is determined.Network Analyzer BasicsJoel DunsmoreCopyright 2007EECS142
Just as clearly, with the signal driven from the test port, there willbe the same loss to the Input Port as there was in the otherdirection, but now the signal will be coupled to the Coupled PortNetwork Analyzer BasicsJoel DunsmoreCopyright 2007EECS142
Let’s check two cases: Assume the test port is open circuit (R4infinite), then the voltage at the isolated point will be(1/2)*(5/6)*(1/6)*Vs, exactly the same as the combination of lossand coupling, assuming a total reflection at the test port.RsR1Test PortOpenVd VsInput PortR2R3Isolated PortNetwork Analyzer BasicsJoel DunsmoreCopyright 2007EECS142
Now Assume the test port is short circuit (R4 0). Surprisingly (ornot, if you’re a real electrical engineer) the voltage at the isolatedport will be (1/2)*(5/6)*(1/6)*Vs, exactly the same as the open, butwith a sign change! Thus it is again the combination of loss andcoupling, assuming a total reflection at the test port, but thereflection is negative.RsR1Test PortShortVd VsInput PortR2R3Isolated PortNetwork Analyzer BasicsJoel DunsmoreCopyright 2007EECS142
DirectivityDirectivity is a measure of how well a coupler canseparate signals moving in opposite directionsD I/(C * L), I, C, L positive (loss).Isolation (I)(undesired leakage signal)Coupling (desired reflected signal)Test portDirectional CouplerLoss (L)Network Analyzer BasicsJoel DunsmoreCopyright 2007EECS142
Interaction of Directivity with the DUT(Without Error Correction)0Data MaxDirectivityDeviceReturn LossDUT RL 40 dB30Add in-phase60DeviceFrequencyNetwork Analyzer BasicsJoel DunsmoreCopyright 2007DeviceDirectivityData MinDirectivityAdd out-of-phase(cancellation)EECS142Data Vector Sum
Broadband Diode DetectionEasy to make broadband Inexpensive compared to tuned receiver Good for measuring frequency-translating devices Improve dynamic range by increasing power Medium sensitivity / dynamic range 10 MHzNetwork Analyzer BasicsJoel DunsmoreCopyright 200726.5 GHzEECS142
Narrowband Detection – Tuned ReceiverADC / DSPBest sensitivity / dynamic range Provides harmonic / spurious signal rejection Improve dynamic range by increasing power,decreasing IF bandwidth, or averaging Trade off noise floor and measurement speed 26.5 GHz10 MHzNetwork Analyzer BasicsJoel DunsmoreCopyright 2007EECS142
Errors due to reflections, other signalsError Due to Interfering Signal100-Error (dB, deg)10 Neg MagErrorphase error1Pos. Magerror0.10.010.0010-5-10 -15 -20 -25 -30 -35 -40 -45 -50 -55 -60 -65 -70Interfering signal (dB)Network Analyzer BasicsJoel DunsmoreCopyright 2007EECS142In Log Mag format,the –dB error islarger than the dBerror
ctedSIGNALSEPARATIONINCIDENT (R)REFLECTED(A)TRANSMITTED(B)RECEIVER / DETECTORPROCESSOR / DISPLAY markerslimit linespass/fail indicatorslinear/log formatsgrid/polar/Smith chartsNetwork Analyzer BasicsJoel DunsmoreCopyright 2007EECS142
Measurement Error ModelingLCAAL-CERSystematic errors due to imperfections in the analyzer and test setup assumed to be time invariant (predictable)Random errors vary with time in random fashion (unpredictable) main contributors: instrument noise, switch and connector repeatabilityDrift errors due to system performance changing after a calibration has been done primarily caused by temperature etwork Analyzer BasicsJoel DunsmoreCopyright 2007EECS142UnknownDevice
Systematic Measurement ErrorsRABCrosstalkDirectivityDUTFrequency response reflection tracking (A/R) transmission tracking (B/R)SourceMismatchSix forward and six reverse error termsyields 12 error terms for two-port devicesNetwork Analyzer BasicsJoel DunsmoreCopyright 2007EECS142LoadMismatch
Types of Error Correction response (normalization)simple to performonly corrects for tracking errorsthrustores reference trace in memory,then does data divided by memoryvectorrequires more standardsrequires an analyzer that can measure phaseaccounts for all major sources of systematic error SHORTS11 aS 11 mNetwork Analyzer BasicsJoel DunsmoreCopyright 2007thruOPENLOADEECS142
What is Vector-Error Correction? Process of characterizing systematic error termsmeasure known standardsremove effects from subsequent measurements1-port calibration (reflection measurements)only 3 systematic error terms measureddirectivity, source match, and reflection trackingFull 2-port calibration (reflection and transmission measurements)12 systematic error terms measuredusually requires 12 measurements on four known standards (SOLT)Standards defined in cal kit definition filenetwork analyzer contains standard cal kit definitionsCAL KIT DEFINITION MUST MATCH ACTUAL CAL KIT USED!User-built standards must be characterized and entered into user cal-kit Network Analyzer BasicsJoel DunsmoreCopyright 2007EECS142
Reflection: One-Port ModelIdealRF inError AdapterRF in1ED DirectivityS11AESEDS11AES Source MatchS11MS11MS11M MeasuredERTTo solve for error terms, wemeasure 3 standards to generate3 equations and 3 unknowns ERT Reflection trackingS11A ActualS11AS11M ED ERT1 - ES S11AAssumes good termination at port two if testing two-port devicesIf using port 2 of NA and DUT reverse isolation is low (e.g., filter passband):assumption of good termination is not validtwo-port error correction yields better results Network Analyzer BasicsJoel DunsmoreCopyright 2007EECS142
Before and After One-Port Calibration02.0data before 1-port calibration20VSWRReturn Loss (dB)1.1401.01data after 1-port calibration601.0016000Network Analyzer BasicsJoel DunsmoreCopyright 2007MHzEECS14212000
Crosstalk: Signal Leakage Between TestPorts During TransmissionCan be a problem with:high-isolation devices (e.g., switch in open position)high-dynamic range devices (some filter stopbands) Isolation calibrationadds noise to error model (measuring near noise floor of system)only perform if really needed (use averaging if necessary)if crosstalk is independent of DUT match, use two terminationsif dependent on DUT match, use DUT with termination on output LOADNetwork Analyzer BasicsJoel DunsmoreCopyright 2007DUTDUTEECS142LOADDUT
Errors and Calibration StandardsUNCORRECTEDRESPONSE1-PORTSHORTDUTOPENthru ConvenientGenerally not accurateNo errors removedLOAD Easy to performUse when highestaccuracy is not requiredRemoves frequencyresponse errorENHANCED-RESPONSE For reflection measurementsNeed good termination for highaccuracy with two-port devicesRemoves these errors:DirectivitySource matchReflection trackingCombines response and 1-portCorrects source match for transmission measurementsNetwork Analyzer BasicsJoel DunsmoreCopyright 2007SHORTOPENOPENLOADLOADDUT SHORTDUT FULL 2-PORTEECS142thruDUT Highest accuracyRemoves these errors:DirectivitySource, load matchReflection trackingTransmission trackingCrosstalk
Reflection Example Using a One-Port CalLoad match:18 dB (.126)Directivity:40 dB (.010)Remember: convert all dB values tolinear for uncertainty calculations!ρ or loss(linear) 10 (DUT-dB)2016 dB RL (.158)1 dB loss (.891).158Measurement uncertainty:-20 * log (.158 .100 .010) 11.4 dB (-4.6dB)(.891)(.126)(.891) .100-20 * log (.158 - .100 - .010) 26.4 dB ( 10.4 dB)Network Analyzer BasicsJoel DunsmoreCopyright 2007EECS142
Transmission Example Using Response CalRL 18 dB (.126)RL 14 dB (.200)Thru calibration (normalization) builds error intomeasurement due to source and load match interactionCalibration Uncertainty (1 ρS ρL) (1 (.200)(.126) 0.22 dBNetwork Analyzer BasicsJoel DunsmoreCopyright 2007EECS142
Filter Measurement with Response CalSource match 14 dB (.200)DUT1 dB loss (.891)16 dB RL (.158)Load match 18 dB (.126)1(.126)(.158) .020(.126)(.891)(.200)(.891) .020(.158)(.200) .032Total measurement uncertainty: 0.60 0.22 0.82 dB-0.65 - 0.22 - 0.87 dBNetwork Analyzer BasicsJoel DunsmoreCopyright 2007Measurement uncertainty 1 (.020 .020 .032) 1 .072 0.60 dB- 0.65 dBEECS142
Measuring Amplifiers with a Response CalSource match 14 dB (.200)DUT16 dB RL (.158)Load match 18 dB (.126)1(.126)(.158) .020(.158)(.200) .032Measurement uncertainty 1 (.020 .032) 1 .052 0.44 dB- 0.46 dBTotal measurement uncertainty: 0.44 0.22 0.66 dB-0.46 - 0.22 - 0.68 dBNetwork Analyzer BasicsJoel DunsmoreCopyright 2007EECS142 pag
Analyzer must make forward and reverseFile Size: 1MB