Transcription
AgilentNetwork Analyzer Basics
AbstractThis presentation covers the principlesof measuring high-frequency electricalnetworks with network analyzers.You will learn what kinds ofmeasurements are made with networkanalyzers, and how they allow you tocharacterize both linear and nonlinearbehavior of your devices. The sessionstarts with RF fundamentals suchas transmission lines and the Smithchart, leading to the conceptsof reflection, transmission andS-parameters. The next section coversthe major components in a networkanalyzer, including the advantagesand limitations of different hardwareapproaches. Error modeling, accuracyenhancement, and various calibrationtechniques will then be presented.Finally, some typical swept-frequencyand swept-power measurementscommonly performed on filtersand amplifiers will be covered.An appendix is also included withinformation on advanced topics,with pointers to more information.2
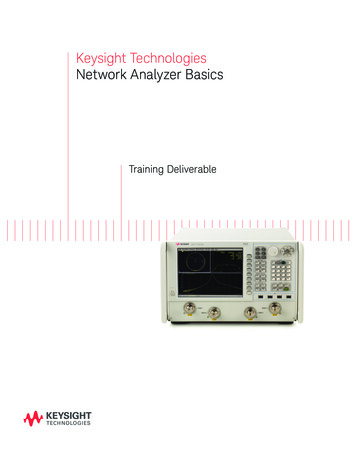
Network Analysis is Not.This module is not about computernetworks! When the name “networkanalyzer” was coined many years ago,there were no such things as computernetworks. Back then, networksalways referred to electrical networks.Today, when we refer to the thingsthat network analyzers measure,we speak mostly about devices andcomponents.What Types of Devices AreTested?Here are some examples of the typesof devices that you can test withnetwork analyzers. They includeboth passive and active devices (andsome that have attributes of both).Many of these devices need to becharacterized for both linear andnonlinear behavior. It is not possibleto completely characterize all of thesedevices with just one piece of testequipment.The next slide shows a model coveringthe wide range of measurementsnecessary for complete linear andnonlinear characterization of devices.This model requires a variety ofstimulus and response tools. It takesa large range of test equipment toaccomplish all of the measurementsshown on this chart. Some instrumentsare optimized for one test only (likebit-error rate), while others, likenetwork analyzers, are much moregeneralpurpose in nature. Networkanalyzers can measure both linearand nonlinear behavior of devices,although the measurement techniquesare different (frequency versus powersweeps for example). This modulefocuses on swept-frequency andswept-power measurements madewith network analyzers3
Device Test Measurement ModelHere is a key to many of theabbreviations used at right:4Response84000Ded. TestersVSA8400 series high-volume RFIC testerDedicated (usually one-box) testersVector signal analyzerSAVNASpectrum analyzerVector signal analyzerTG/SASNATracking generator/spectrum analyzerScalar network analyzerNF Mtr.Imped. An.Power Mtr.Det./ScopeNoise-figure meterImpedance analyzer (LCR meter)Power meterDiode �nConstell.EVMEyeGDHarm. Dist.NFRegrowthAdjacent channel powerAM to PM conversionBit-error rateGain compressionConstellation diagramError-vector magnitudeEye diagramGroup delayHarmonic distortionNoise figureSpectral regrowthRtn LsVSWRReturn lossVoltage standing wave ratio
Lightwave Analogy to RF EnergyOne of the most fundamental conceptsof high-frequency network analysisinvolves incident, reflected andtransmitted waves traveling alongtransmission lines. It is helpful tothink of traveling waves along atransmission line in terms of alightwave analogy. We can imagineincident light striking some opticalcomponent like a clear lens. Some ofthe light is reflected off the surfaceof the lens, but most of the lightcontinues on through the lens. Ifthe lens were made of some lossymaterial, then a portion of the lightcould be absorbed within the lens.If the lens had mirrored surfaces,then most of the light would bereflected and little or none wouldbe transmitted through the lens.This concept is valid for RF signalsas well, except the electromagneticenergy is in the RF range instead ofthe optical range, and our componentsand circuits are electrical devicesand networks instead of lenses andmirrors.Network analysis is concerned withthe accurate measurement of theratios of the reflected signal to theincident signal, and the transmittedsignal to the incident signal.5
Why Do We Need to TestComponents?Components are tested for a varietyof reasons. Many components areused as “building blocks” in morecomplicated RF systems. For example,in most transceivers there are amplifiersto boost LO power to mixers, andfilters to remove signal harmonics.Often, R&D engineers need to measurethese components to verify theirsimulation models and their actualhardware prototypes. For componentproduction, a manufacturer mustmeasure the performance of theirproducts so they can provide accuratespecifications. This is essential soprospective customers will know howa particular component will behavein their application.When used in communicationssystems to pass signals, designerswant to ensure the component orcircuit is not causing excessive signaldistortion. This can be in the form oflinear distortion where flat magnitudeand linear phase shift versus frequencyis not maintained over the bandwidthof interest, or in the form of nonlineareffects like intermodulation distortion.Often it is most important to measurehow reflective a component is, to ensurethat it absorbs energy efficiently.Measuring antenna match is a goodexample.6
The Need for Both Magnitudeand PhaseIn many situations, magnitude-onlydata is sufficient for out needs. Forexample, we may only care about thegain of an amplifier or the stop-bandrejection of a filter. However, as wewill explore throughout this paper,measuring phase is a critical elementof network analysis.Complete characterization of devicesand networks involves measurementof phase as well as magnitude.This is necessary for developingcircuit models for simulation andto design matching circuits basedon conjugatematching techniques.Time-domain characterizationrequires magnitude and phaseinformation to perform the inverseFourier transform. Finally, for bestmeasurement accuracy, phase datais required to perform vector errorcorrection.AgendaIn this section we will review reflectionand transmission measurements. Wewill see that transmission lines areneeded to convey RF and microwaveenergy from one point to another withminimal loss, that transmission lineshave a characteristic impedance, andthat a termination at the end of atransmission line must match thecharacteristic impedance of the lineto prevent loss of energy due toreflections. We will see how theSmith chart simplifies the processof converting reflection data to thecomplex impedance of the termination.For transmission measurements,we will discuss not only simple gainand loss but distortion introducedby linear devices. We will introduceS-parameters and explain why they areused instead of h-, y-, or z-parametersat RF and microwave frequencies.7
Transmission Line BasicsThe need for efficient transfer of RFpower is one of the main reasonsbehind the use of transmissionlines. At low frequencies where thewavelength of the signals are muchlarger than the length of the circuitconductors, a simple wire is veryuseful for carrying power. Currenttravels down the wire easily, andvoltage and current are the same nomatter where we measure alongthe wire.At high frequencies however, thewavelength of signals of interest arecomparable to or much smaller thanthe length of conductors. In this case,power transmission can best bethought of in terms of traveling waves.Of critical importance is that alossless transmission line takes ona characteristic impedance (Zo). Infact, an infinitely long transmissionline appears to be a resistive load!When the transmission line isterminated in its characteristicimpedance, maximum power istransferred to the load. When thetermination is not Zo, the portion ofthe signal which is not absorbed bythe load is reflected back towardthe source. This creates a conditionwhere the envelope voltage along thetransmission line varies with position.We will examine the incident andreflected waves on transmissionlines with different load conditionsin following slides8
Transmission Line Z0RF transmission lines can be made ina variety of transmission media.Common examples are coaxial, waveguide, twisted pair, coplanar, striplineand microstrip. RF circuit design onprinted-circuit boards (PCB) often usecoplanar or microstrip transmissionlines. The fundamental parameter of atransmission line is its characteristicimpedance Zo. Zo describes therelationship between the voltageand current traveling waves, and isa function of the various dimensionsof the transmission line and thedielectric constant (εr) of the nonconducting material in the transmissionline. For most RF systems, Zo is either50 or 75 ohms.For low-power situations (cable TV,for example) coaxial transmissionlines are optimized for low loss, whichworks out to about 75 ohms (forcoaxial transmission lines with airdielectric). For RF and microwavecommunication and radar applications,where high power is often encountered,coaxial transmission lines aredesigned to have a characteristicimpedance of 50 ohms, a compromisebetween maximum power handling(occurring at 30 ohms) and minimumloss.9
Power Transfer EfficiencyBefore we begin our discussion abouttransmission lines, let us look at thecondition for maximum power transfer into a load, given a source impedance of Rs. The graph above showsthat the matched condition(RL RS) results in the maximumpower dissipated in the load resistor.This condition is true whether thestimulus is a DC voltage source or anRF sinusoid.For maximum transfer of energy intoa transmission line from a source orfrom a transmission line to a load (thenext stage of an amplifier, an antenna,etc.), the impedance of the source andload should match the characteristicimpedance of the transmission line.In general, then, Zo is the target forinput and output impedances ofdevices and networks.When the source impedance is notpurely resistive, the maximumpower transfer occurs when the loadimpedance is equal to the complexconjugate of the source impedance.This condition is met by reversingthe sign of the imaginary part ofthe impedance. For example, ifRS 0.6 j0.3, then the complexconjugate RS* 0.6 - j0.3.Sometimes the source impedance isadjusted to be the complex conjugateof the load impedance. For example,when matching to an antenna, theload impedance is determined by thecharacteristics of the antenna. Adesigner has to optimize the outputmatch of the RF amplifier over thefrequency range of the antenna sothat maximum RF power is transmittedthrough the antenna10
Transmission Line TerminatedWith Z0Let’s review what happens whentransmission lines are terminatedin various impedances, starting witha Zo load. Since a transmission lineterminated in its characteristicimpedance results in maximumtransfer of power to the load, thereis no reflected signal. This result isthe same as if the transmission linewas infinitely long. If we were to lookat the envelope of the RF signal versusdistance along the transmission line, itwould be constant (no standing-wavepattern). This is because there isenergy flowing in one direction only.11
Transmission Line Terminatedwith Short, OpenNext, let’s terminate our line in ashort circuit. Since purely reactiveelements cannot dissipate any power,and there is nowhere else for theenergy to go, a reflected wave islaunched back down the line towardthe source. For Ohm’s law to besatisfied (no voltage across the short),this reflected wave must be equal involtage magnitude to the incidentwave, and be 180 out of phase withit. This satisfies the condition thatthe total voltage must equal zero atthe plane of the short circuit. Ourreflected and incident voltage (andcurrent) waves will be identical inmagnitude but traveling in theopposite direction.Now let us leave our line open. Thistime, Ohm’s law tells us that the opencan support no current. Therefore,our reflected current wave must be180 out of phase with respect to theincident wave (the voltage wave willbe in phase with the incident wave).This guarantees that current at theopen will be zero. Again, our reflectedand incident current (and voltage)waves will be identical in magnitude,but traveling in the opposite direction.For both the short and open cases, astanding-wave pattern will be set upon the transmission line. The valleyswill be at zero and the peaks at twicethe incident voltage level. The peaksand valleys of the short and open willbe shifted in position along the linewith respect to each other, in order tosatisfy Ohm’s law as described above.12
Transmission Line Terminatedwith 25 ΩFinally, let’s terminate our line with a25 Ω resistor (an impedance betweenthe full reflection of an open or shortcircuit and the perfect termination ofa 50 Ω load). Some (but not all) of ourincident energy will be absorbed inthe load, and some will be reflectedback towards the source. We will findthat our reflected voltage wave willhave an amplitude 1/3 that of theincident wave, and that the two waveswill be 180o out of phase at the load.The phase relationship between theincident and reflected waves willchange as a function of distance alongthe transmission line from the load.The valleys of the standing-wavepattern will no longer be zero, andthe peak will be less than that of theshort/open case.The significance of standing wavesshould not go unnoticed. Ohm’s lawtells us the complex relationshipbetween the incident and reflectedsignals at the load. Assuming a50-ohm source, the voltage acrossa 25-ohm load resistor will be twothirds of the voltage across a 50-ohmload. Hence, the voltage of thereflected signal is one third thevoltage of the incident signal and is180 out of phase with it. However, aswe move away from the load towardthe source, we find that the phasebetween the incident and reflectedsignals changes! The vector sum ofthe two signals therefore also changesalong the line, producing the standingwave pattern. The apparent impedancealso changes along the line becausethe relative amplitude and phase ofthe incident and reflected waves atany given point uniquely determinethe measured impedance. For example,if we made a measurement onequarter wavelength away from the25-ohm load, the results wouldindicate a 100-ohm load. The standingwave pattern repeats every halfwavelength, as does the apparentimpedance.13
High-Frequency DeviceCharacterizationNow that we fully understand therelationship of electromagnetic waves,we must also recognize the terms usedto describe them. Common networkanalyzer terminology has the incidentwave measured with the R (forreference) receiver. The reflectedwave is measured with the A receiverand the transmitted wave is measuredwith the B receiver. With amplitudeand phase information of these threewaves, we can quantify the reflectionand transmission characteristics ofour device under test (DUT). Someof the common measured terms arescalar in nature (the phase part isignored or not measured), whileothers are vector (both magnitude andphase are measured). For example,return loss is a scalar measurementof reflection, while impedance resultsfrom a vector reflection measurement.Some, like group delay, are purelyphase-related measurements.Ratioed reflection is often shownas A/R and ratioed transmission isoften shown as B/R, relating to themeasurement receivers used in thenetwork analyzer14
Reflection ParametersLet’s now examine reflectionmeasurements. The first term forreflected waves is reflection coefficientgamma (Γ). Reflection coefficient isthe ratio of the reflected signal voltageto the incident signal voltage. It can becalculated as shown above by knowingthe impedances of the transmissionline and the load. The magnitudeportion of gamma is called rho (ρ).A transmission line terminated in Zowill have all energy transferred to theload; hence Vrefl 0 and ρ 0. WhenZL is not equal to Zo , some energy isreflected and ρ is greater than zero.When ZL is a short or open circuit,all energy is reflected and ρ 1.The range of possible values for ρis therefore zero to one.Since it is often very convenient toshow reflection on a logarithmicdisplay, the second way to conveyreflection is return loss. Return lossis expressed in terms of dB, and is ascalar quantity. The definition forreturn loss includes a negative signso that the return loss value is alwaysa positive number (when measuringreflection on a network analyzer witha log magnitude format, ignoring theminus sign gives the results in termsof return loss). Return loss can bethought of as the number of dB thatthe reflected signal is below theincident signal. Return loss variesbetween infinity for a Zo impedanceand 0 dB for an open or short circuit.As we have already seen, two wavestraveling in opposite directions onthe same transmission line cause a“standing wave”. This condition canbe measured in terms of the voltagestanding-wave ratio (VSWR or SWRfor short). VSWR is defined as themaximum value of the RF envelopeover the minimum value of theenvelope. This value can be computedas (1 ρ)/(1–ρ). VSWR can take ?15
graphically? Since there is a one-to-onecorrespondence between complexreflection coefficient and impedance,we can map one plane onto the other.If we try to map the polar plane ontothe rectilinear impedance plane, wefind that we have problems. First ofall, the rectilinear plane does nothave values to infinity. Second, circlesof constant reflection coefficient areconcentric on the polar plane but noton the rectilinear plane, making itdifficult to make judgments regardingtwo different impedances. Finally,phase angles plot as radii on thepolar plane but plot as arcs on therectilinear plane, making it difficultto pinpoint.Smith Chart ReviewOur network analyzer gives us complex reflection coefficient. However,we often want to know the impedanceof the DUT. The previous slide showsthe relationship between reflectioncoefficient and impedance, and wecould manually perform the complexmath to find the impedance. Althoughprogrammable calculators andcomputers take the drudgery outof doing the math, a single numberdoes not always give us the completepicture. In addition, impedance almostcertainly changes with frequency, soeven if we did all the math, we wouldend up with a table of numbers thatmay be difficult to interpret.A simple, graphical method solvesthis problem. Let’s first plot reflectioncoefficient using a polar display.For positive resistance, the absolutemagnitude of Γ varies from zero(perfect load) to unity (full reflection)at some angle. So we have a unitcircle, which marks the boundaryof the polar plane shown on theslide. An open would plot at 1 0o;a short at 1 180o; a perfect load atthe center, and so on. How do we getfrom the polar data to impedance16The proper solution was first used inthe 1930’s, when Phillip H. Smithmapped the impedance plane onto thepolar plane, creating the chart thatbears his name (the venerable Smithchart). Since unity at zero degreeson the polar plane represents infiniteimpedance, both plus and minusinfinite reactances, as well as infiniteresistance can be plotted. On theSmith chart, the vertical lines on therectilinear plane that indicate valuesof constant resistance map to circles,and the horizontal lines that indicatevalues of constant reactance map toarcs. Zo maps to the exact center ofthe chart.In general, Smith charts are normalizedto Zo; that is, the impedance valuesare divided by Zo. The chart is thenindependent of the characteristicimpedance of the system in question.Actual impedance values are derivedby multiplying the indicated value byZo. For example, in a 50-ohm system,a normalized value of 0.3 - j0.15becomes 15 - j7.5 ohms; in a 75-ohmsystem, 22.5 - j11.25 ohms.Fortunately, we no longer have to gothrough the exercise ourselves. Outnetwork analyzer can display theSmith chart, plot measured data onit, and provide adjustable marke
Network Analyzer Basics. 2 Abstract This presentation covers the principles of measuring high-frequency electrical networks with network analyzers. You will learn what kinds of measurements are made with network analyzers, and how they allow you to characterize both linear and nonlinear


![IN THE SUPREME COURT OF T]-lE STATE OF MONTANA](/img/7/526b198c923f8.jpg)