Transcription
Spectrum Analyzer BasicsSpectrum Analyzer Basicswww. agilent.com/find/backtobasics
AbstractLearn why spectrum analysis is important for a variety of applications and how to measure systemand device performance using a spectrum analyzer. To introduce you to spectrum analyzers, thetheory of operation will be discussed. In addition, the major components inside the analyzer andwhy they are important will be examined. Next, you will learn the spectrum analyzer specificationsthat are important for your application. Finally, features of a spectrum analyzer that make it moreeffective in making measurements will be introduced.
Agenda Spectrum Analyzer BasicsOverview: What is spectrum analysis? What measurements do we make?Theory of Operation: Spectrum analyzer hardwareSpecifications: Which are important and why?Features Making the analyzer more obasicsSlide 1This paper is intended to be a beginning tutorial on spectrum analysis. It is written for those who are unfamiliar withspectrum analyzers, and would like a basic understanding of how they work, what you need to know to use them totheir fullest potential, and how to make them more effective for particular applications.It is written for new engineers and technicians, therefore a basic understanding of electrical concepts is recommended.We will begin with an overview of spectrum analysis. In this section, we will define spectrum analysis as well aspresent a brief introduction to the types of tests that are made with a spectrum analyzer.From there, we will learn about spectrum analyzers in terms of the hardware inside, what the importance of eachcomponent is, and how it all works together.In order to make measurements on a spectrum analyzer and to interpret the results correctly, it is important tounderstand the characteristics of the analyzer. Spectrum analyzer specifications will help you determine if a particularinstrument will make the measurements you need to make, and how accurate the results will be.Spectrum analyzers also have many additional features that help make them more effective for particular applications.We will discuss briefly, some of the more important and widely used features in this section.And finally, we will wrap up with a summary.3-1
Agenda Spectrum Analyzer BasicsOverviewTheory of agilent.com/find/backtobasicsSlide 2Let's begin with an overview of spectrum analysis.3-2
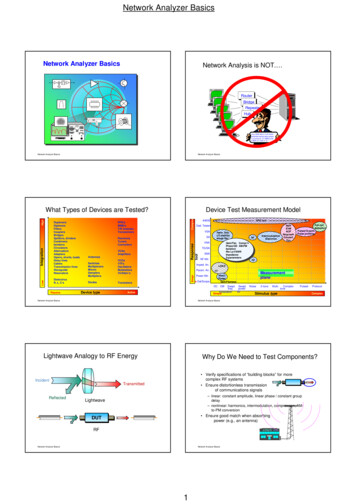
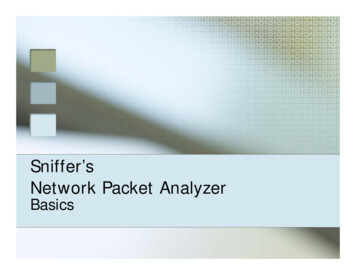
OverviewWhat is Spectrum Analysis?8563ASpectrum Analyzer BasicsSPECTRU M A NALYZER9 kH z - 2 6.5 GH zwww.agilent.com/find/backtobasicsSlide 3If you are designing, manufacturing, or doing field service/repair of electrical devices or systems, you need a tool thatwill help you analyze the electrical signals that are passing through or being transmitted by your system or device. Byanalyzing the characteristics of the signal once its gone through the device/system, you can determine the performance,find problems, troubleshoot, etc.How do we measure these electrical signals in order to see what happens to them as they pass through ourdevice/system and therefore verify the performance? We need a passive receiver, meaning it doesn't do anything to thesignal - it just displays it in a way that makes it easy to analyze the signal. This is called a spectrum analyzer.Spectrum analyzers usually display raw, unprocessed signal information such as voltage, power, period, waveshape,sidebands, and frequency. They can provide you with a clear and precise window into the frequency spectrum.Depending upon the application, a signal could have several different characteristics. For example, in communications, inorder to send information such as your voice or data, it must be modulated onto a higher frequency carrier. Amodulated signal will have specific characteristics depending on the type of modulation used. When testing non-lineardevices such as amplifiers or mixers, it is important to understand how these create distortion products and what thesedistortion products look like. Understanding the characteristics of noise and how a noise signal looks compared to othertypes of signals can also help you in analyzing your device/system.Understanding the important aspects of a spectrum analyzer for measuring all of these types of signals will help youmake more accurate measurements and give you confidence that you are interpreting the results correctly.3-3
OverviewTypes of Tests Made.ModulationNoiseDistortionSpectrum Analyzer Basicswww.agilent.com/find/backtobasicsSlide 4The most common spectrum analyzer measurements are: modulation, distortion, and noise.Measuring the quality of the modulation is important for making sure your system is working properly and that theinformation is being transmitted correctly. Understanding the spectral content is important, especially incommunications where there is very limited bandwidth. The amount of power being transmitted (for example, toovercome the channel impairments in wireless systems) is another key measurement in communications. Tests such asmodulation degree, sideband amplitude, modulation quality, occupied bandwidth are examples of common modulationmeasurements.In communications, measuring distortion is critical for both the receiver and transmitter. Excessive harmonic distortionat the output of a transmitter can interfere with other communication bands. The pre-amplification stages in a receivermust be free of intermodulation distortion to prevent signal crosstalk. An example is the intermodulation of cable TVcarriers that moves down the trunk of the distribution system and distorts other channels on the same cable. Commondistortion measurements include intermodulation, harmonics, and spurious emissions.Noise is often the signal you want to measure. Any active circuit or device will generate noise. Tests such as noisefigure and signal-to-noise ratio (SNR) are important for characterizing the performance of a device and/or itscontribution to overall system noise.For all of these spectrum analyzer measurements, it is important to understand the operation of the spectrum analyzerand the spectrum analyzer performance required for your specific measurement and test specifications. This will helpyou choose the right analyzer for your application as well as get the most out of it.3-4
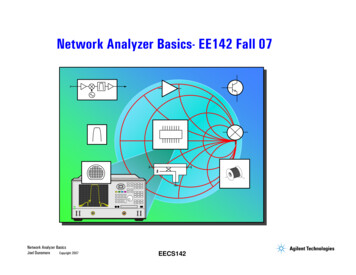
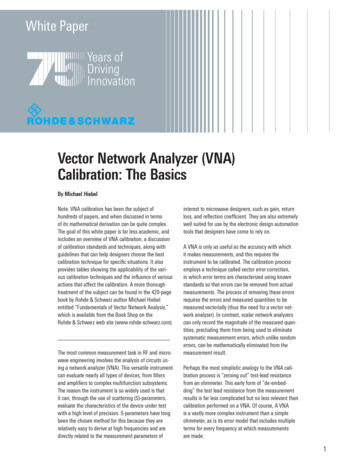
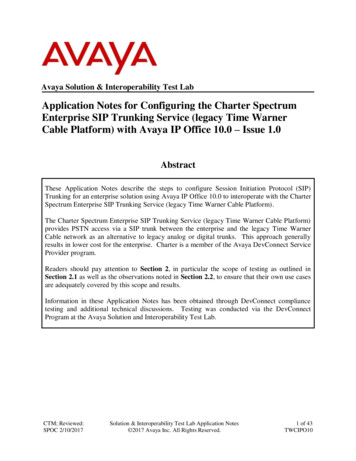
OverviewFrequency versus Time DomainAmplitude(power)encyfrequtimeTime domainMeasurementsSpectrum Analyzer BasicsFrequency sSlide 5Traditionally, when you want to look at an electrical signal, you use an oscilloscope to see how the signal varies with time. This is veryimportant information; however, it doesn't give you the full picture. To fully understand the performance of your device/system, you will alsowant to analyze the signal(s) in the frequency-domain. This is a graphical representation of the signal's amplitude as a function of frequencyThe spectrum analyzer is to the frequency domain as the oscilloscope is to the time domain. (It is important to note that spectrum analyzerscan also be used in the fixed-tune mode (zero span) to provide time-domain measurement capability much like that of an oscilloscope.)The figure shows a signal in both the time and the frequency domains. In the time domain, all frequency components of the signal are summedtogether and displayed. In the frequency domain, complex signals (that is, signals composed of more than one frequency) are separated intotheir frequency components, and the level at each frequency is displayed.Frequency domain measurements have several distinct advantages. For example, let's say you're looking at a signal on an oscilloscope thatappears to be a pure sine wave. A pure sine wave has no harmonic distortion. If you look at the signal on a spectrum analyzer, you may findthat your signal is actually made up of several frequencies. What was not discernible on the oscilloscope becomes very apparent on thespectrum analyzer.Some systems are inherently frequency domain oriented. For example, many telecommunications systems use what is called FrequencyDivision Multiple Access (FDMA) or Frequency Division Multiplexing (FDM). In these systems, different users are assigned differentfrequencies for transmitting and receiving, such as with a cellular phone. Radio stations also use FDM, with each station in a givengeographical area occupying a particular frequency band. These types of systems must be analyzed in the frequency domain in order to makesure that no one is interfering with users/radio stations on neighboring frequencies. We shall also see laterhow measuring with a frequency domain analyzer can greatly reduce the amount of noise present in the measurement because of its ability tonarrow the measurement bandwidth.From this view of the spectrum, measurements of frequency, power, harmonic content, modulation, spurs, and noise can easily be made.Given the capability to measure these quantities, we can determine total harmonic distortion, occupied bandwidth, signal stability, outputpower, intermodulation distortion, power bandwidth, carrier-to-noise ratio, and a host of other measurements, using just a spectrum analyzer.3-5
OverviewDifferent Types of AnalyzersFourier AnalyzerParallel filters measured simultaneouslyALCD shows full spectraldisplayf1Spectrum Analyzer Basicsf2fwww.agilent.com/find/backtobasicsSlide 6Now that we understand why spectrum analyzers are important, let's take a look at the different types of analyzersavailable for measuring RF.There are basically two ways to make frequency domain measurements (what we call spectrum analysis): Fouriertransform and swept-tuned.The Fourier analyzer basically takes a time-domain signal, digitizes it using digital sampling, and then performs themathematics required to convert it to the frequency domain*, and display the resulting spectrum. It is as if the analyzeris looking at the entire frequency range at the same time using parallel filters measuring simultaneously. It is actuallycapturing the time domain information which contains all the frequency information in it. With its real-time signalanalysis capability, the Fourier analyzer is able to capture periodic as well as random and transient events. It also canprovide significant speed improvement over the more traditional swept analyzer and can measure phase as well asmagnitude. However it does have its limitations, particularly in the areas of frequency range, sensitivity, and dynamicrange. We shall discuss what these terms are and why they are important in a later section.Fourier analyzers are becoming more prevalent, as analog-to-digital converters (ADC) and digital signal processing (DSP)technologies advance. Operations that once required a lot of custom, power-hungry discrete hardware can now beperformed with commercial off-the-shelf DSP chips, which get smaller and faster every year. These analyzers can offersignificant performance improvements over conventional spectrum analyzers, but often with a price premium.* The frequency domain is related to the time domain by a body of knowledge generally known as Fourier theory (namedfor Jean Baptiste Joseph Fourier, 1768-1830). Discrete, or digitized signals can be transformed into the frequencydomain using the discrete Fourier transform.3-6
OverviewDifferent Types of AnalyzersSwept AnalyzerAFilter 'sweeps' over range ofinterestLCD shows fullspectral displayf1Spectrum Analyzer Basicsf2fwww.agilent.com/find/backtobasicsSlide 7The most common type of spectrum analyzer is the swept-tuned receiver. It is the most widely accepted, generalpurpose tool for frequency-domain measurements. The technique most widely used is superheterodyne. Heterodynemeans to mix - that is, to translate frequency - and super refers to super-audio frequencies, or frequencies above theaudio range. Very basically, these analyzers "sweep" across the frequency range of interest, displaying all thefrequency components present. We shall see how this is actually accomplished in the next section. The swept-tunedanalyzer works just like the AM radio in your home except that on your radio, the dial controls the tuning and instead ofa display, your radio has a speaker.The swept receiver technique enables frequency domain measurements to be made over a large dynamic range and awide frequency range, thereby making significant contributions to frequency-domain signal analysis for numerousapplications, including the manufacture and maintenance of microwave communications links, radar,telecommunications equipment, cable TV systems, and broadcast equipment; mobile communication systems; EMIdiagnostic testing; component testing; and signal surveillance.For the remainder of this paper, the term spectrum analyzer will refer only to the swept tuned analyzer. This is the typeof analyzer that we will learn about in detail.3-7
Agenda OverviewTheory of trum Analyzer Basicswww.agilent.com/find/backtobasicsSlide 8Based on the previous slide, you might be picturing the inside of the analyzer consisting of a bandpass filter that sweepsacross the frequency range of interest. If the input signal is say, 1 MHz, then when the bandpass filter passes over 1MHz, it will "see" the input signal and display it on the screen.Although this concept would work, it is very difficult and therefore expensive to build a filter which tunes over a widerange. An easier, and therefore less expensive, implementation is to use a tunable local oscillator (LO), and keep thebandpass filter fixed. We will see when we go into more detail, that in this concept, we are sweeping the input signalpast the fixed filter, and as it passes through the fixed bandpass filter, it is displayed on the screen. Don't worry if itseems confusing now - as we discuss the block diagram, the concept will become clearer.Let's now go into more detail as to how the swept spectrum analyzer works.3-8
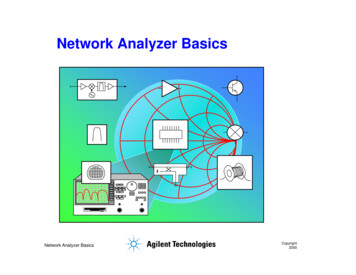
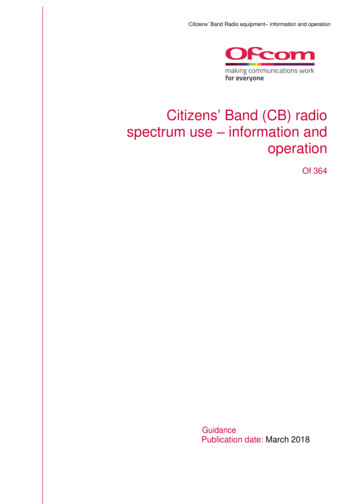
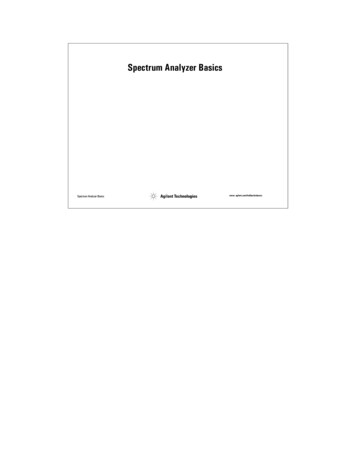
Theory of OperationSpectrum Analyzer Block DiagramRF inputattenuatorIF gainIF filterdetectormixerInputsignalLogAmpPre-SelectorOr Low CrystalReferenceSpectrum Analyzer BasicsCRT displaywww.agilent.com/find/backtobasicsSlide 9The major components in a spectrum analyzer are the RF input attenuator, mixer, IF (Intermediate Frequency) gain, IFfilter, detector, video filter, local oscillator, sweep generator, and LCD display. Before we talk about how these pieceswork together, let's get a fundamental understanding of each component individually.3-9
Theory of OperationMixerf sigMIXERinputRFLOf LO f sigf LO - f sigIFf sigf LOf LOSpectrum Analyzer Basicswww.agilent.com/find/backtobasicsSlide 10We'll start with the mixerA mixer is a three-port device that converts a signal from one frequency to another (sometimes called a frequencytranslation device).We apply the input signal to one input port, and the Local Oscillator signal to the other.By definition, a mixer is a non-linear device, meaning that there will be frequencies at the output that were not presentat the input.The output frequencies that will be produced by the mixer are the original input signals, plus the sum and differencefrequencies of these two signals.It is the difference frequency that is of interest in the spectrum analyzer, which we will see shortly. We call this signalthe IF signal, or Intermediate Frequency signal.3-10
Theory of OperationIF FILTERIF FilterInputSpectrumIF Bandwidth(RBW)DisplaySpectrum Analyzer Basicswww.agilent.com/find/backtobasicsSlide 11The IF filter is a bandpass filter which is used as the "window" for detecting signals. It's bandwidth is also called theresolution bandwidth (RBW) of the analyzer and can be changed via the front panel of the analyzer.By giving you a broad range of variable resolution bandwidth settings , the instrument can be optimized for the sweepand signal conditions, letting you trade-off frequency selectivity (the ability to resolve signals), signal-to-noise ratio(SNR), and measurement speed.We can see from the slide that as RBW is narrowed, selectivity is improved (we are able to resolve the two inputsignals). This will also often improve SNR. The sweep speed and trace update rate, however, will degrade withnarrower RBWs. The optimum RBW setting depends heavily on the characteristics of the signals of interest.3-11
Theory of OperationDetectorDETECTORamplitude"bins"Positive detection: largest valuein bin displayedNegative detection: smallest valuein bin displayedSample detection: last value in bin displayedSpectrum Analyzer Basicswww.agilent.com/find/backtobasicsSlide 12The analyzer must covert the IF signal to a baseband or video signal so it can be digitized and then viewed on theanalyzer display. This is accomplished with an envelope detector whose video output is then digitized with an analog-todigital converter (ADC). The digitized output of the ADC is then represented as the signal’s amplitude on the Y-axis ofthe display. This allows for several different detector modes that dramatically affect how the signal is displayed.In positive detection mode, we take the peak value of the signal over the duration of one trace element, whereas innegative detection mode, its the minimum value. Positive detection mode is typically used when analyzing sinusoids,but is not good for displaying noise, since it will not show the true randomness of the noise.In sample detection, a random value for each bin is produced. This is best for looking at noise or noise-like signals. Forburst or narrowband signals, it is not a good mode to use, as the analyzer might miss the signals of interest.When displaying both signals and noise, the best mode is the normal mode, or the rosenfell mode. This is a "smart"mode, which will dynamically change depending upon the input signal. For example, If the signal both rose and fellwithin a sampling bin, it assumes it is noise and will use pos & neg det alternately. If it continues to rise, it assumes asignal and uses pos peak det.3-12
Theory of OperationVideo FilterVIDEOFILTERSpectrum Analyzer Basicswww.agilent.com/find/backtobasicsSlide 13The video filter is a low-pass filter that is located after the envelope detector and before the ADC. This filterdetermines the bandwidth of the video amplifier, and is used to average or smooth the trace seen on the screen.The spectrum analyzer displays signal-plus-noise so that the closer a signal is to the noise level, the more the noisemakes the signal more difficult to read. By changing the video bandwidth (VBW) setting, we can decrease the peak-topeak variations of noise. This type of display smoothing can be used to help find signals that otherwise might beobscured in the noise.3-13
Theory of OperationOther ComponentsLOSWEEPGENRF INPUTATTENUATORfrequencyLCD DISPLAYIF GAINSpectrum Analyzer Basicswww.agilent.com/find/backtobasicsSlide 14And finally, a brief description of the last few components.The local oscillator (LO) s a Voltage Controlled Oscillator (VCO) which in effect tunes the analyzer. The sweepgenerator actually tunes the LO so that its frequency changes in proportion to the ramp voltage.The sampling of the video signal by the ADC is also synchronized with the sweep generator to create the frequencydomain on the x-axis. Because the relationship between the local oscillator and the input signal is known, the horizontalaxis of the display can be calibrated in terms of the input signal’s frequency.The RF input attenuator is a step attenuator located between the input connector and the first mixer. It is also calledthe RF attenuator. This is used to adjust the level of the signal incident upon the first mixer. This is important in orderto prevent mixer gain compression and distortion due to high-level and/or broadband signals.The IF gain is located after the mixer but before the IF, or RBW, filt
Spectrum analyzer specifications will help you determine if a particular instrument will make the measurements you need to make, and how accurate the results will be. Spectrum analyzers also have many additional features that h