Transcription
Best in Class – Dashboards for Oil&Gas ProjectsPM World JournalVol. VI, Issue X – October 2017www.pmworldjournal.netby Stephen J.C. PatersonFeatured PaperBest in Class – Dashboards for Oil and Gas ProjectsStephen J.C. PatersonAbstractReporting, effective reporting is key to a projects success during its life-span, while insufficientor incorrectly analyzed reporting dooms a project to failure. In today’s environment with theadvances in technology, managers and executives are reading reports on the move so conciseanalysis is key. The author reviews several sources including “Guild of Project ControlsGPCCAR”, “DAU Gold Card” and “NDIA’s A guide to managing programs using predictivemeasures” to determine the optimum metric content for a project management dashboard for theoil and gas sector. Along the way, the paper researches the attributes and the target audience,before determining utilization of two metric groups, “common” and “unique” along with arecommended shortlist. The paper concludes by recommending content for page 1, page 2 andsubsequent pages, from the shortlist, before providing recommended formats for the same.Keywords: Dashboard, Project Reporting, Progress Reporting, Business Report Writing, ProjectManagement, Charts, TablesIntroductionHaving spent more than 30 years in project controls on Oil and Gas construction projects, onshore and off-shore, one of the most important activities in the project life-span is effectivereporting. The art of reporting, and it is an art, is providing the correct information and analysisof the same to the key people to allow them to make informed decisions to make the projectsuccessful.During these years, the author has been involved in the development of various dashboards totrack progress, key KPI’s, performance, and highlight issues requiring attention. However, eachProject Manager, usually had different requirements, and while some indicators could beduplicated from project to project others needed to be developed to suit the project team’s needs.Based on the famous statement by William Cameron which is often attributed to none other thanAlbert Einstein, that “not everything that can be measured matters and not everything thatmatters can be measured”1 this paper is going to review the following problem statement, “Whatshould the ideal project management dashboard contain?”. While the authors research is basedon dashboards supporting the Oil and Gas Industry, it is only to be expected that other industrieswould have similar requirements.Specifically, this paper wants to explore;1Quoteinvestigator. (2010, May 26). 1963, Informal Sociology, a casual introduction to sociological thinking by William Bruce Cameron, Page13, Random House, New York. (Google Books snippet view) (Checked on paper: Fifth printing, January 1967; Copyright 1963).Retrieved August 6, 2017, from e-cameron/ 2017 Stephen J.C. Patersonwww.pmworldlibrary.netPage 1 of 21
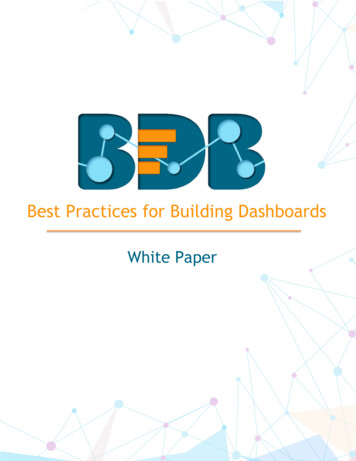
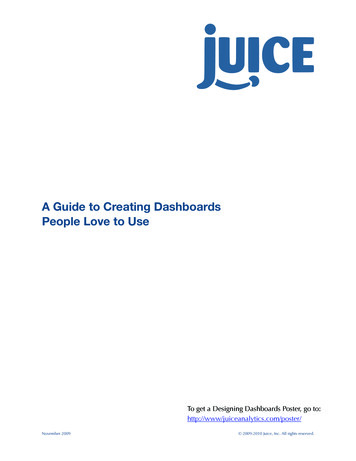
PM World JournalBest in Class – Dashboards for Oil&Gas ProjectsVol. VI, Issue X – October 2017www.pmworldjournal.net1.2.3.4.5.by Stephen J.C. PatersonFeatured PaperProposed content and format for the first page of a dashboard.Proposed content and format for the second page of a dashboard.Proposed content and format for third and subsequent pages of a dashboard.Considerations for ready prepared formats by software providers.Proposed update to the Guild of Project Controls GPCCAR Communications module. 2Attributes of a dashboardReview of the following documents, revealed the depth of metrics and key performanceindicators available to generate a meaningful dashboard: Guild of Project Controls GPCCAR Module 9. 3DAU Gold Card. 4NDIA’s A Guide to Managing Programs using Predictive Measures. 5Oracle P6 EPPM standard dashboard reports. 6Microsoft Project & Portfolio Management (PPM) standard dashboard reports. 7The GPCCAR Module 9 section 09.5.3.4 “Dashboard Reports” shows four examples, and refersto the DAU Gold Card, and section 09.5.5 “References & Templates” refers to the NDIAdocument mentioned above. Of the four examples provided, a good example of is the first onewhich shows the “Figure 21 - S-Curve from a Real Programme”, see figure 1 below, as itprovides a metrics ribbon along the top to provide management with an excellent view of thecurrent status.2Guild of Project Controls. (2015, October 3). Module 07 Baselining and communicating the schedule - Guild of project controls compendiumand reference (CaR) Project Controls - planning, scheduling, cost management and forensic analysis (Planning Planet). Retrieved August 6,2017, from ing-and-communicating-the-schedule3Guild of Project Controls. (2015, October 3). Guild of project controls compendium and reference (CaR) Project controls - planning,scheduling, cost management and forensic analysis (Planning planet). Retrieved August 6, 2017, ject-performance-forecasting4Defense Acquisition University. (2015). EVM general reference (gold-card). Retrieved from Gold-Card)5National Defense Industrial Association / Integrated Program Management Division. (2014). A guide to managing programs using predictivemeasures. Retrieved from http://www.ndia.org/6Primavera P6 Enterprise Project Portfolio Management [Computer program] 16.2. Redwood shores, CA, USA: ORACLE (2016).7Microsoft Project & Portfolio Management (PPM) [Computer program] 2016. Redmond, WA, USA: Microsoft Corporation (2016). 2017 Stephen J.C. Patersonwww.pmworldlibrary.netPage 2 of 21
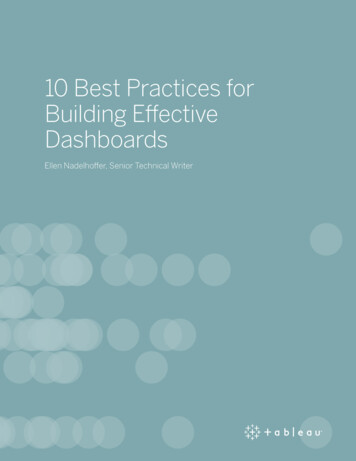
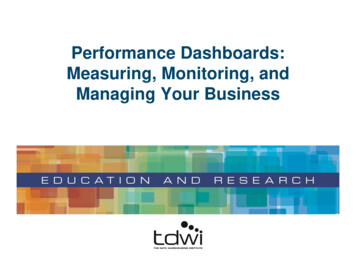
Best in Class – Dashboards for Oil&Gas ProjectsPM World JournalVol. VI, Issue X – October 2017www.pmworldjournal.netby Stephen J.C. PatersonFeatured PaperFigure 1 – GPCCAR Dashboard Example8The DAU Gold Card is a one page document that defines terminology and equations for EarnedValue (EV) and quite easily could be adapted into a one page dashboard. It covers the overallstatus, cost and schedule variances, efficiencies, performance against baseline and forecasting.What is nice about this layout is that the equations are also shown, and eliminates manyquestions from management as it’s already spelled out for them in the template.8Guild of Project Controls. (2015, October 3). 09.5.3.4 Dashboard reports - Guild of project controls compendium and reference ProjectControls - planning, scheduling, cost management and forensic analysis (Planning Planet). Retrieved July 31, 2017, ject-performance-forecasting 2017 Stephen J.C. Patersonwww.pmworldlibrary.netPage 3 of 21
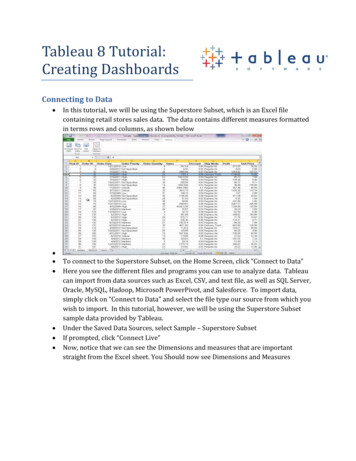
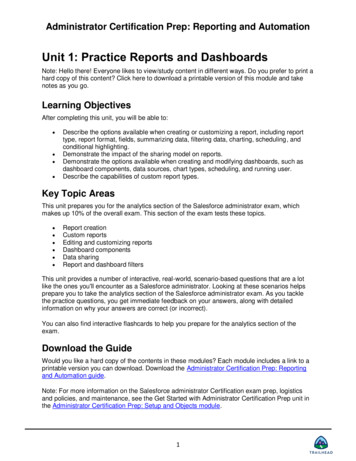
PM World JournalBest in Class – Dashboards for Oil&Gas ProjectsVol. VI, Issue X – October 2017www.pmworldjournal.netby Stephen J.C. PatersonFeatured PaperFigure 2 – DAU Gold Card 9NDIA’s “A guide to managing programs using predictive measures” has several equations likethat contained in the DAU Gold plus others that are schedule, resource and risk & opportunityrelated.9Defense Acquisition University. (2015). EVM general reference (gold-card). Retrieved from Gold-Card) 2017 Stephen J.C. Patersonwww.pmworldlibrary.netPage 4 of 21
PM World JournalBest in Class – Dashboards for Oil&Gas ProjectsVol. VI, Issue X – October 2017www.pmworldjournal.netby Stephen J.C. PatersonFeatured PaperFigure 3 – Extract from Table of Contents of NDIA’s predictive measures guide10Oracle’s P6 Dashboards are a facility provided in the Enterprise Primavera PortfolioManagement (EPPM) version of the software, please note that users of the standalone P6Professional version do not have this facility and need to export data to create dashboards in MSExcel. Reviewing the P6 online help indicates that these dashboards use ‘portlets’ a name for apre-determined metric, and a dashboard can be customized with up to 12 of these portlets. Theonline help facility runs through the operating instructions to create and customize the portletsbut is lacking in graphics. It does however provide a list of available fields; ACWP, BAC,10National Defense Industrial Association / Integrated Program Management Division. (2014). A guide to managing programs using predictivemeasures – table of contents, Pages i & ii. Retrieved from http://www.ndia.org/ 2017 Stephen J.C. Patersonwww.pmworldlibrary.netPage 5 of 21
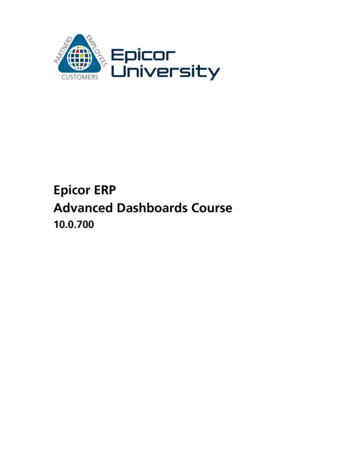
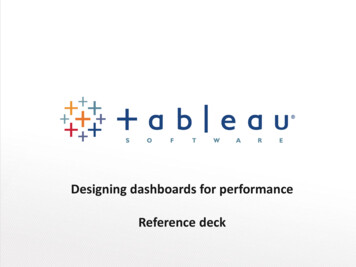
Best in Class – Dashboards for Oil&Gas ProjectsPM World JournalVol. VI, Issue X – October 2017www.pmworldjournal.netby Stephen J.C. PatersonFeatured PaperBCWP, BCWS, BEI, CPI, CV, EAC, SPI, SV, VAC and TCPI. Therefor with some setting up, aP6 user has the fields to construct a customized “Gold Card” template.Further research revealed a white paper by Charles Wright called “Understanding Dashboards inP6 EPPM R8.0 ”11 which provided a clearer picture of how they function along with generateddashboard graphics, refer to figure 4 below. P6 has three categories of dashboards available, “P6Dashboard”, “Workspace” and “Workgroup” which have seventeen standard portlets, 9 standardOracle Primavera Contract Management (O-PCM) portlets, and unlimited number of portfolioviews that can be customized. Note, that the O-PCM portlets are only available when PCM,which is a separate oracle product, and EPPM are integrated. Reviewing the document indicatesthat these dashboards take some training, trial and error to perfect so it does not appear to be aneasy process.Figure 4 – Examples of P6 Dashboards1211Wright, C. (2012). Understanding dashboards in P6. Retrieved from rstandingDashboards-in-P6.pdf12Example P6 dashboards from Wright, C. (2012). Understanding dashboards in P6. Retrieved from standing-Dashboards-in-P6.pdf 2017 Stephen J.C. Patersonwww.pmworldlibrary.netPage 6 of 21
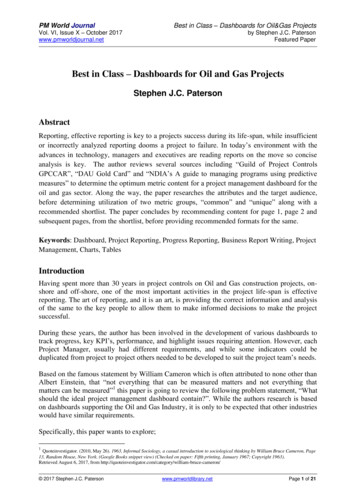
Best in Class – Dashboards for Oil&Gas ProjectsPM World JournalVol. VI, Issue X – October 2017www.pmworldjournal.netby Stephen J.C. PatersonFeatured PaperMicrosoft Project Portfolio Management (PPM) dashboards are facility with the “Reports” menudropdown options, which provides five options “Burndown”, “Cost Overview”, “ProjectOverview”, “Upcoming Tasks” and “Work Overview”. All appear to be able to be customizedby the user should there be a need to do so. Review of the customization fields shows that thefollowing are available; ACWP, BAC, BCWP, BCWS, CPI, CV, CV%, EAC, SPI, SV, SV%,VAC and TCPI. This allows any PPM user to be able to construct a customized “Gold Card”template. Research shows extensive coverage of dashboard development in both written andvideo tutorials for users wanting to learn to create customized ones. It’s only to be expectedsince PPM is one of the Microsoft Office 13 suite programs.Figure 5 – Example of a customized PPM Dashboard14So, from the sources mentioned above there are several predictive measures or indicators,whichever term is preferred, that can be utilized in the development of an informative dashboardto monitor and control any project / program across a wide range of industries.Based on the 30 years of first-hand experience in oil and gas sector, here are additional metricsthat need to be included in the evaluation and analysis: An analysis narrative section.HSE statistic and leading indicators.Quality statistics and lag indicators.Key Milestone Table or Icicle chart.A section for drill-down metrics, the progress of which is included in the overall EVfigure.As well as the above documents, extensive research online pointed to several companies15 16 17 1819 20 21 22who provide a Dashboard software, some free, some with monthly tariffs. They seem13Microsoft Office [Computer program] 2016. Redmond, WA, USA: Microsoft Corporation (2016).ExcelTutorials. (2015, November 12). Official Trailer for Project Portfolio Dashboard [Video file]. Retrieved fromhttps://www.youtube.com/watch?v QZnJOQJYo3c15Creating a project dashboard in projectmanager.com. (n.d.). Retrieved from 6Dashboard gallery - Your one-stop shop for pre-built dashboards - Klipfolio. (n.d.). Retrieved from https://www.klipfolio.com/gallery17Online project management software - ProjectManager.com. (2017). Retrieved from https://www.projectmanager.com18Project Dashboard Visual Project Snapshots for Project Managers. (2017). Retrieved from roject management dashboard - Software bug tracking tool. (2016, November 9). Retrieved from -dashboard/14 2017 Stephen J.C. Patersonwww.pmworldlibrary.netPage 7 of 21
PM World JournalBest in Class – Dashboards for Oil&Gas ProjectsVol. VI, Issue X – October 2017www.pmworldjournal.netby Stephen J.C. PatersonFeatured Paperto provide similar service to what an in-house Project Controls Team would generate but it’sgenerated by people dedicated to producing these types of reports so it looks professional inappearance. There also appears to be wall screen dashboards offered, letting them run throughthe contents of the dashboard on various separate slides on the screen.Targeting the Audience – Dashboard VisibilityBe it Contractor, Client or both, dashboards are about getting the message to the Team,Management and the Stakeholders, in a concise way that minimal questions are asked when thereceived. As this could very well turn out to be many individuals, some thought needs to begiven as to what metrics go on each page 1, 2, 3, etc., as it may well take several pages for thecomplete dashboard.It is normal practice for the dashboard to originate from the contractor as a contractualrequirement from the client either to supplement or replace the weekly report. This in turn istaken by the client and consolidated into condensed report for the project team and home officemanagement, who in turn further dissect and send up-line to the Senior executives andstakeholders.Ideally, Page 1 should provide the concise status of where the project is and where it is headedalong with risks, mitigations and actions being implemented. Normally the items that seniormanagement and stakeholders target. Page 2 would expect the peripheral metrics which don’tquite make the first page but still key for the project management team, and page 3 onwardscontain the drill-down metrics and that are more useful for the project team that are dealing withthe day to day issues.In today’s “age of technology”, where individuals have access to smart phones, tablets,notebooks, etc., the format of the dashboard becomes more of an issue. Images need to beclearly read by the user while he/she is on the move. Some people may choose to view thedashboard on their phone but images will be small, others may use a tablet or notebook to viewallowing slightly larger images, ultimately the definition will depend on the resolution of theproduct being used.On several projects, there were two main ways to target both contractor and client project teamsso the latest information was available for their viewing; i) the dashboard was plotted on A1/A0size paper and displayed in the numerous hallways around the office, and ii) the components thatmade up the compact dashboards were put onto individual slides and compiled into a revolvingslideshow on wall screens in the hallways that had them installed around the project office. Thiswas a very effective way of providing visibility to a large project team. It also had a big effect onoffice visitors, be it sub-contractors, supply chain representatives, visiting executives or VIPs,everyone commented on how informative the status was. As previously mentioned, theseservices now appear to be offered by several of the online companies that specialize indashboard development services.As mentioned above the author has been working several years preparing dashboards,predominantly for client teams and senior management, and recognizes that the more20Project management dashboards iDashboards software. (2017). Retrieved from gementdashboards/21Smartsheet: Work Management and Automation Solutions. (2017). Retrieved from https://www.smartsheet.com/landing-b22What is a dashboard? (2017). Retrieved from ashboards/fundamentals/what-is-adashboard.aspx 2017 Stephen J.C. Patersonwww.pmworldlibrary.netPage 8 of 21
PM World JournalBest in Class – Dashboards for Oil&Gas ProjectsVol. VI, Issue X – October 2017www.pmworldjournal.netby Stephen J.C. PatersonFeatured Paperinformation available, the harder it becomes to remain on one page of paper, be it, A4, A3, USLetter or 11 x 17, the task always remains daunting. Someone comes up with a let’s add this orthat suggestion, which ultimately comes as a trade-off as space to be utilized is at a premium orthe dashboard increases in size. The key is to get the message contained in the informationacross to the audience along with solutions as to what is being/has been implemented againstproblem areas/issues. The best approach is to pull together an initial format then initiate severalreview cycles with the senior managers incorporating a listing of agreed upon comments.MetricsIn reviewing the available metrics, there are two groups; 1) Metrics common to all the reviewedsources, and 2) Unique metrics that are not across all the sources.As the “Common metrics” are across all the sources reviewed, these can be eliminated frombeing discussed further. Table 1 provides a listing of the “Common” metrics.Table 1 – Common Metrics23The “Unique” metrics are shown in table 2 and are referenced against the specific source, pleasenote that the GPCCAR references the “DAU Gold Card” and “NDIA” in several areas as beingthe recommended sources for metrics, however the uniqueness of the metrics is based on thesource document. It is unlikely that all of these metrics would be used in a dashboard, so theproject team would need to select those deemed suitable for use in their particular dashboard.23By author 2017 Stephen J.C. Patersonwww.pmworldlibrary.netPage 9 of 21
PM World JournalBest in Class – Dashboards for Oil&Gas ProjectsVol. VI, Issue X – October 2017www.pmworldjournal.netby Stephen J.C. PatersonFeatured PaperTable 2 – Unique Metrics24NDIA lists some additional metrics, but these appear to be more in line with US Governmentprojects or product type applications and while these metrics may be extremely useful in theirapplication, these have not been considered for inclusion in an Oil and Gas industry typedashboard. Table 3 provides a listing of the “Other” metrics in the NDIA document.24By author 2017 Stephen J.C. Patersonwww.pmworldlibrary.netPage 10 of 21
PM World JournalBest in Class – Dashboards for Oil&Gas ProjectsVol. VI, Issue X – October 2017www.pmworldjournal.netby Stephen J.C. PatersonFeatured PaperTable 3 – Other Metrics25With the preclusion of Table 3 from the available metrics, it is expected that the dashboards bedeveloped from the metrics outlined in Tables 1 “Common” and 2 “Unique”. As the table 1metrics are common to all sources, review of the 18 “Unique” metrics needs further analysis todetermine which of them are worth including in the dashboard.25By author / Information Source: NDIA Guide to Managing Programs using Predictive Measures 2017 Stephen J.C. Patersonwww.pmworldlibrary.netPage 11 of 21
PM World JournalBest in Class – Dashboards for Oil&Gas ProjectsVol. VI, Issue X – October 2017www.pmworldjournal.netby Stephen J.C. PatersonFeatured PaperHit Task % This metric looks at the number of tasks that were completed on or before the baselinefinish, and divides it by the number of tasks baselined to be finished within the reportingtimeframe. The formula provides a performance ratio. 1.00 Ahead of Schedule / 1.00 On Schedule/ 1.00 Behind Schedu
6 Primavera P6 Enterprise Project Portfolio Management [Computer program] 16.2. Redwood shores, CA, USA: ORACLE (2016). 7 Microsoft Project & Portfolio Management (PPM) [Computer progr