Transcription
NITI AayogMinistry of Health& Family Welfare
Ministry of Health& Family WelfareNITI AayogHEALTHY STATESPROGRESSIVE INDIAReport on the Ranks of States and Union TerritoriesHEALTH INDEX June 2019
Visit http://social.niti.gov.in/ to download this report.
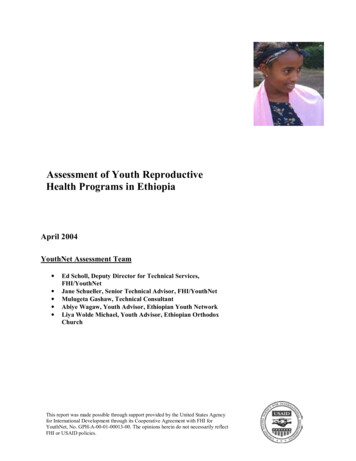
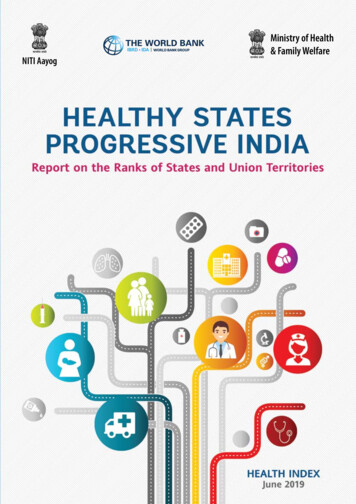
Table of ContentsFOREWORD viiAcknowledgements viiiABBREVIATIONS ixEXECUTIVE SUMMARY 1BACKGROUND 111.OVERVIEW 122.ABOUT THE INDEX – DEFINING AND MEASURING 132.1. Aim 132.2. Objective 132.3. Salient Features 132.4. Methodology 2.4.1. Computation of Index scores and rank 2.4.2. Categorization of States for ranking 2.4.3. The Health Index score – List of indicators and weightage 131314152.5. Limitation of the Index 19PROCESS – FROM IDEA TO PRACTICE 203.1. Key Stakeholders – Roles and Responsibilities 203.2. Process Flow 3.2.1. Development of the Index 3.2.2. Submission of data on the portal 3.2.3. Independent validation of data 3.2.4. Index and rank generation 20202121223.Results and Findings 234.UNVEILING PERFORMANCE 244.1. Performance of Larger States 4.1.1. Overall performance 4.1.2. Incremental performance 4.1.3. Domain–specific performance 4.1.4. Incremental performance on indicators 24242628304.2. Performance of Smaller States 4.2.1. Overall performance 4.2.2. Incremental performance 323233Table of Contentsiii
4.2.3. Domain – specific performance 4.2.4. Incremental performance on indicators 34354.3. Performance of Union Territories 4.3.1. Overall performance 4.3.2 Incremental performance 4.3.3 Domain–specific performance 4.3.4. Incremental performance on indicators 36363738404.4. States and Union Territories Performance on Indicators 40WAY FORWARD 715.72INSTITUTIONALIZATION - TAKING THE INDEX AHEAD ANNEXURES Annexure 1. Data Validation Process Annexure 2. Snapshot: State-wise Performance on Indicators Annexure 3. State Factsheets 73747789LIST OF TABLESTable E.1 Categorization of Larger States on incremental performance and overall performance Table E.2 Categorization of Smaller States on incremental performance and overall performance Table E.3 Categorization of UTs on incremental performance and overall performance Table 2.1 Categorization of States and UTs Table 2.2 Health Index Summary Table 2.3 Health Index: Indicators, definitions, data sources, Base and Reference Years Table 3.1 Key stakeholders: roles and responsibilities Table 3.2 Timeline for development of Health Index 2018 Table 4.1 Larger States: Overall performance in Reference Year – Categorization Table 4.2 Larger States: Incremental performance from Base to Reference Year – Categorization Table 4.3 Smaller States: Overall performance in Reference Year – Categorization Table 4.4 Smaller States: Incremental performance from Base to Reference Year – Categorization Table 4.5 UTs: Overall performance in Reference Year – Categorization Table 4.6 UTs: Incremental performance from Base to Reference Year – Categorization 6781515162021262732333738LIST OF FIGURESFigure E.1 Larger States - Incremental scores and ranks, with overall performance scores andranks in Base and Reference Years Figure E.2 Smaller States - Incremental scores and ranks, with overall performance scores andranks in Base and Reference Years Figure E.3 UTs - Incremental scores and ranks, with overall performance scores and ranks inBase and Reference Years Figure E.4 Composite Index scores in Reference Year and per capita Net State Domestic Productat current prices (INR) in 2016-17 Figure E.5 Incremental change in Composite Index scores from Base to Reference Year andComposite Index score in Base Year Figure 3.1 Steps for validating data Figure 4.1 Larger States: Overall Performance – Composite Index score and rank, Base andReference Years Figure 4.2 Larger States: Overall and Incremental Performance, Base and Reference Years andincremental rank ivHealthy States, Progressive India578910222527
Figure 4.3 Larger States: Overall and domain-specific performance, Reference Year Figure 4.4 Larger States: Performance in the Health Outcomes domain, Base and Reference Years Figure 4.5 Larger States: Performance in the Key Inputs/Processes domain, Base and Reference Years Figure 4.6 Larger States: Number of indicators/sub-indicators, by category of incrementalperformance Figure 4.7 Smaller States: Overall performance – Composite Index score and rank, Base andReference Years Figure 4.8 Smaller States: Overall and incremental performance, Base and Reference Years andincremental rank Figure 4.9 Smaller States: Overall and domain-specific performance, Reference Year Figure 4.10 Smaller States: Performance in the Health Outcomes domain, Base and Reference Years Figure 4.11 Smaller States: Performance in the Key Inputs/Processes domain, Base andReference Years Figure 4.12 Smaller States: Number of indicators/sub-indicators, by category of incrementalperformance Figure 4.13 UTs: Overall performance – Composite Index score and rank, Base and Reference Years Figure 4.14 UTs: Overall and incremental performance, Base and Reference Years and incremental rank Figure 4.15 UTs: Overall and domain-specific performance, Reference Year Figure 4.16 UTs: Performance in the Health Outcomes domain, Base and Reference Years Figure 4.17 UTs: Performance in the Key Inputs/Processes domain, Base and Reference Years Figure 4.18 UTs: Number of indicators/sub-indicators, by category of incremental performance Figure 4.19 Indicator 1.1.1 - Neonatal Mortality Rate - Larger States Figure 4.20 Indicator 1.1.2 - Under-five Mortality Rate - Larger States Figure 4.21 Indicator 1.1.3 - Total Fertility Rate - Larger States Figure 4.22 Indicator 1.1.4 - Proportion of Low Birth Weight among newborns - Larger States Figure 4.23 Indicator 1.1.4 - Proportion of Low Birth Weight among newborns - Smaller States and UTs Figure 4.24 Indicator 1.1.5 - Sex Ratio at Birth - Larger States Figure 4.25 Indicator 1.2.1 - Full immunization coverage - Larger States Figure 4.26 Indicator 1.2.1 - Full immunization coverage - Smaller States and UT Figure 4.27 Indicator 1.2.2 - Proportion of institutional deliveries - Larger States Figure 4.28 Indicator 1.2.2 - Proportion of institutional deliveries - Smaller States and UTs Figure 4.29 Indicator 1.2.3 - Total case notification rate of tuberculosis - Larger States Figure 4.30 Indicator 1.2.3 - Total case notification rate of tuberculosis - Smaller States and UTs Figure 4.31 Indicator 1.2.4 - Treatment success rate of new microbiologically confirmedtuberculosis cases - Larger States Figure 4.32 Indicator 1.2.4 - Treatment success rate of new microbiologically confirmedtuberculosis cases – Smaller States and UTs Figure 4.33 Indicator 2.1.1: Data Integrity Measure – ANC registered within first trimester – Larger States Figure 4.34 Indicator 2.1.1: Data Integrity Measure – ANC registered within first trimester SmallerStates and UTs Figure 4.35 Indicator 2.1.1: Data Integrity Measure – institutional deliveries – Larger States Figure 4.36 Indicator 2.1.1: Data Integrity Measure – institutional deliveries – Smaller States and UTs Figure 4.37 Indicator 2.2.1 - Average occupancy of an officer (in months), for three key posts atState level for last three years - Larger States Figure 4.38 Indicator 2.2.1 - Average occupancy of an officer (in months), for three key posts atState level for last three years - Smaller States and UTs Figure 4.39 Indicator 2.2.2 - Average occupancy of a District Chief Medical Officer (CMO) orequivalent post (heading District Health Services full-time) (in months) in lastthree years - Larger States Table of 44454546474748494950505151525253v
Figure 4.40 Indicator 2.2.2 - Average occupancy of a District Chief Medical Officer (CMO) orequivalent post (heading District Health Services full-time) (in months) in lastthree years - Smaller States and UTs Figure 4.41 Indicator 3.1.1a - Vacancy of ANMs at sub-centres - Larger States Figure 4.42 Indicator 3.1.1a - Vacancy of ANMs at sub-centres - Smaller States and UTs Figure 4.43 Indicator 3.1.1b - Vacancy of Staff Nurse at PHCs and CHCs – Larger States Figure 4.44 Indicator 3.1.1b - Vacancy of Staff Nurse at PHCs and CHCs – Smaller States and UTs Figure 4.45 Indicator 3.1.1c - Vacancy of Medical Officers at PHCs – Larger States Figure 4.46 Indicator 3.1.1c - Vacancy of Medical Officers at PHCs – Smaller States and UTs Figure 4.47 Indicator 3.1.1d - Vacancy of Specialists at district hospitals – Larger States Figure 4.48 Indicator 3.1.1d - Vacancy of Specialists at district hospitals – Smaller States and UTs Figure 4.49 Indicator 3.1.2 - Proportion of total staff (regular contractual) with e-payslip generated in theIT enabled Human Resources Management Information System (HRMIS) – Larger States Figure 4.50 Indicator 3.1.2 - Proportion of total staff (regular contractual) with e-payslip generatedin the IT enabled Human Resources Management Information System (HRMIS) –Smaller States and UTs Figure 4.51 Indicator 3.1.3.a - Proportion of facilities functional as First Referral Units - Larger States Figure 4.52 Indicator 3.1.3a - Proportion of facilities functional as First Referral Units - Smaller Statesand UTs Figure 4.53 Indicator 3.1.3b - Proportion of functional 24x7 PHCs - Larger States Figure 4.54 Indicator 3.1.3b - Proportion of functional 24x7 PHCs - Smaller States and UTs Figure 4.55 Indicator 3.1.4 - Cardiac Care Units in districts - Larger States Figure 4.56 Indicator 3.1.4 - Cardiac Care Units in districts - Smaller States and UTs Figure 4.57 Indicator 3.1.5 - Proportion of ANC registered within first trimester against totalregistrations - Larger States Figure 4.58 Indicator 3.1.5 - Proportion of ANC registered within first trimester against totalregistrations - Smaller States and UTs Figure 4.59 Indicator 3.1.6 - Level of registration of births - Larger States Figure 4.60 Indicator 3.1.6 - Level of registration of births - Smaller States and UTs Figure 4.61 Indicator 3.1.7 - Completeness of Integrated Disease Surveillance Programmereporting of P form - Larger States Figure 4.62 Indicator 3.1.7: Completeness of Integrated Disease Surveillance Programmereporting of P form - Smaller States and UTs Figure 4.63 Indicator 3.1.7 - Completeness of Integrated Disease Surveillance Programmereporting of L form - Larger States Figure 4.64 Indicator 3.1.7 - Completeness of Integrated Disease Surveillance Programmereporting of L form - Smaller States and UTs Figure 4.65 Indicator 3.1.8 - Proportion of CHCs with grading of 4 points or above - Larger States Figure 4.66 Indicator 3.1.8 - Proportion of CHCs with grading of 4 points or above – Smaller Statesand UTs Figure 4.67 Indicator 3.1.10 - Average number of days for transfer of Central NHM fund fromState Treasury to implementation agency based on all tranches of the last fiscal year Larger States Figure 4.68 Indicator 3.1.10 - Average number of days for transfer of Central NHM fund fromState Treasury to implementation agency based on all tranches of the last fiscalyear - Smaller States and UTs viHealthy States, Progressive 6666767686970
ForewordNITI Aayog is committed to establishing the Health Index as an annual systematic tool to focus the attentionof the States/UTs on achieving better health outcomes. This is further complemented with the MoHFW’sdecision to link a part of NHM funds to the progress achieved by the States on this Index. I am delighted topresent the second edition of the Health Index, which analyses the overall performance and incrementalimprovement in the States and the UTs for the period 2015-16 (Base Year) and 2017-18 (Reference Year),i.e., a two-year period.It would be recalled that to motivate States to improve population health and reduce disparities in the spiritof cooperative and competitive federalism, the National Institution for Transforming India (NITI) Aayog hadbrought out a publication in 2018 titled, “Healthy States: Progressive India”. It was a compilation of thestate of health systems prevalent in the State/UTs of India, which was published in collaboration with theMinistry of Health & Family Welfare (MoHFW) and with technical assistance from the World Bank.The Health Index highlights the progress reached by the individual States and UTs and is an importantinstrument in understanding the variations and complexity of the nation’s performance in health. Ithighlights the areas each State should focus on to facilitate improvement in overall health outcomes. Thelessons learned in the first and second rounds of Health Index will guide us in making further improvementof the Health Index in the coming years. Through the first round of implementation, stakeholders havegained valuable experience on gathering data to measure and analyse health/performance across Statesand UTs over time. The release of the first round of Health Index had triggered many useful discussions,including how best to measure health performance, how to strengthen the data collection system, how toidentify barriers and motivate actions using data, and how to promote positive competition and learningamong the States and UTs. I expect similar kind of discussions, wherein States/UTs can easily identifyStates that have shown marked improvement in performance from Round one. I would also think of this asa useful stock – taking tool through which progress towards SDG Goal# 3 can be tracked.I would like to take this opportunity to extend my appreciation to all those who contributed to this editionof the Health Index. I thank the Union Ministry, State Governments and Union Territory Administrations forsharing timely information as well as sharing their suggestions for improving the Index. I look forward tocontinued support for this Index, which will impact and transform the health of the population and makeIndia healthy.Amitabh KantChief Executive OfficerNITI AayogGovernment of IndiaForewordvii
ACKNOWLEDGEMENTSNITI Aayog in collaboration with the World Bank and the Ministry of Health and Family Welfare (MoHFW)embarked on a journey in 2017 to develop the first comprehensive State Health Index and published thefirst edition of “Healthy States, Progressive India - Report on the Ranks of States and Union Territories”to bring about a transformational change in the health of the people in India. The second edition of thisexercise was conducted over a period of eight months in 2018-19. It involved extensive engagementwith the States in the process of data collection; mentoring of States in the data submission processon an online portal hosted by NITI Aayog and an independent validation of data submitted. The timelycompletion of the second round of the State Health Index could not have been possible without thesupport and cooperation of all the partners.We would like to acknowledge various program divisions under Ministry of Health and Family Welfare,Additional Chief Secretaries/Principal Secretaries (Health) and Mission Directors, National Health Missionand State Nodal officers of various States and UTs for their complete support during the process and forworking in close co-ordination with NITI Aayog during its entire course.We are extremely grateful to the World Bank team including Mr. Junaid Kamal Ahmad, Country Director andthe technical team led by Ms. Sheena Chhabra, Senior Health Specialist and Task Team Leader along with Dr.Rattan Chand, Senior Consultant, Dr. Di Dong, Young Professional, and Dr. Valerie Ulep, Consultant, for theirtechnical assistance to NITI Aayog during the entire process including the authorship of this report. Supportof Dr. Nikhil Utture, Ms. Manveen Kohli and Ms. Anagha Khot is appreciated. Peer Review of the final reportby the World Bank team comprising of Dr. Rekha Menon, Practice Manager, Dr. Ajay Tandon, Lead Economist,Dr. Mickey Chopra, Global Lead on Service Delivery, and Dr. Owen Smith, Senior Economist, is also greatlyacknowledged.We recognize the effort made by the Sambodhi Research and Communication’s Independent ValidationAgency team comprising of Mr. Sudhanshu Malhotra, Mr Vijay Avinandan, Dr Vikash Choudhry andMr. Shekhar Kedia for completing the task on time. The online portal was developed and maintained bySilvertouch Technologies, led by Ms. Surbhi Singhal and Mr. Aman.We thankfully acknowledge the mentor organizations including RRC - NE, MoHFW (led by Dr. HimanshuBhushan and Dr. Bhaswat Das), TERI (led by Ms. Meena Sehgal) and USAID India (Mr. Gautam Chakraborty)through SWASTI team for the valuable support to the States/UTs during the data submission phase ofthe project.We are grateful to Shri Amitabh Kant, CEO, NITI Aayog for his inspiration and guidance that made this reportpossible, the Health Division team led by Dr. K. Madan Gopal, Senior Consultant; Dr. S. Rajesh, Director,and Mr. Ranganadham Srinadh, Research Assistant who contributed to the planning, implementation andcoordination of the entire exercise.Alok Kumar, IASAdviser, HealthNITI AayogGovernment of IndiaviiiHealthy States, Progressive India
AbbreviationsAHPIAssociation of Healthcare Providers (India)ANCAntenatal CareANMAuxiliary Nurse MidwifeARTAntiretroviral TherapyBCGBacillus Calmette–Guérin vaccineBYBase YearCCUCardiac Care UnitCEOChief Executive OfficerCHCCommunity Health CentreCMOChief Medical OfficerCRSCivil Registration SystemC-SectionCaesarean SectionDHDistrict HospitalDPTDiphtheria, Pertussis, and TetanusEAGEmpowered Action GroupENTEar-Nose-ThroatFLVFirst Level VerificationFRUFirst Referral UnitHIVHuman Immunodeficiency VirusHMISHealth Management Information SystemHRMISHuman Resources Management Information SystemIDSPIntegrated Disease Surveillance ProgrammeIMRInfant Mortality RateINRIndian RupeesIVAIndependent Validation AgencyISOInternational Organization for StandardizationITInformation TechnologyLBWLow Birth WeightL FORMIDSP Reporting Format for Laboratory SurveillanceMISManagement Information SystemMMRMaternal Mortality RatioAbbreviationsix
MOMedical OfficerMoHFWMinistry of Health and Family WelfareNANot ApplicableNABHNational Accreditation Board for Hospitals and Healthcare ProvidersNACONational AIDS Control OrganizationNCDsNon-communicable DiseasesNENorth-EasternNFHSNational Family Health SurveyNHMNational Health MissionNHPNational Health PolicyNITI AayogNational Institution for Transforming IndiaNMRNeonatal Mortality RateNQASNational Quality Assurance StandardsOPVOral Polio VaccineORGIOffice of the Registrar General and Census Commissioner of IndiaP FORMIDSP Reporting Format for Presumptive SurveillancePHCPrimary Health CentrePLHIVPeople Living with HIVRRC-NERegional Resource Centre for North Eastern StatesRNTCPRevised National Tuberculosis Control ProgrammeRUReporting UnitRYReference YearSCSub-CentreSDGSustainable Development GoalsSDHSub-District HospitalSRBSex Ratio at BirthSRSSample Registration SystemSNStaff NurseSNOsState Nodal OfficersTATechnical AssistanceTBTuberculosisTFRTotal Fertility RateU5MRUnder-five Mortality RateUSAIDUnited States Agency for International DevelopmentUTsUnion TerritoriesxHealthy States, Progressive India
EXECUTIVESUMMARY
Executive SummaryBackground and Methodology1.Accompanying the rapid economic growth, India has made significant improvements in health. Inthe last decade, millions of Indians were alleviated from poverty. Health system and health outcomeshave also significantly improved. Despite the remarkable progress, health remains a critical areathat needs improvement. When benchmarked against countries with similar levels of economicdevelopment, India is lagging on some critical health indicators. Moreover, there are huge disparitiesacross States and Union Territories (UTs). The health outcomes of some States are comparable to thatof some upper middle-income countries and high income countries (for example, Neonatal MortalityRate (NMR) in Kerala is similar to that of Brazil or Argentina), while some other States have healthoutcomes similar to that in the poorest countries in the world (for example, NMR in Odisha is close tothat of Sierra Leone). To motivate States to improve population health and reduce disparities in thespirit of cooperative and competitive federalism, the National Institution for Transforming India (NITI)Aayog launched the Health Index to measure the performance of States and UTs. In February 2018,the first round of the Health Index (referred to as Health Index-2017) was released, which measuredthe annual and incremental performance of the States and UTs over the period of 2014-15 (BaseYear) to 2015-16 (Reference Year). NITI Aayog in collaboration with MoHFW and the World Bank,is committed to establish the Health Index as an annual systematic tool to propel States towardsundertaking multi-pronged interventions that will bring better health outcomes. The second round ofHealth Index (referred to as Health Index-2018) examined the overall performance and incrementalimprovement in the States and UTs for the period 2015-16 (Base Year) to 2017-18 (Reference Year), i.e.,a two-year period. The details of the Health Index and indicators can be found in Tables 2.2 and 2.3.2.Multiple stakeholders contributed to the Health Index-2018. The NITI Aayog provided overallstewardship in collaboration with the Ministry of Health and Family Welfare (MoHFW), while theWorld Bank continued to provide technical assistance, the States and UTs, national and internationalexperts contributed to the completion of the Health Index exercise.3.Health Index is a composite score incorporating 23 indicators covering key aspects of healthsector performance. The indicators, methodology and categorization of States and UTs in the HealthIndex-2018 are consistent with the 2017 round with a total of 23 indicators grouped into domainsof Health Outcomes, Governance and Information, and Key Inputs/Processes. The interactive webportal developed and hosted by NITI Aayog with pre-specified format from the 2017 round was usedby the States and UTs to submit data on identified indicators for the Health Index-2018. The Stateswere informed about the Health Index including indicator definitions, data sources and process fordata submission. Data were submitted by States on the online portal hosted by NITI Aayog exceptfor 12 indicators for which the data were pre-filled as these were available in the public domain. Thedata were then validated by an Independent Validation Agency (IVA) and were used as an input forExecutive Summary3
generation of Index values and ranks. For generation of ranks, the States were classified into threecategories (Larger States, Smaller States and UTs) to ensure comparability among similar entities.Key Results4.The Health Index scores for 2017-18 (Reference Year) revealed large disparities in overallperformance across States and UTs. Among the Larger States, the overall Health Index score of thebest-performing State is more than two and half times of the overall score of the least-performingState. Kerala championed the Larger States with an overall score of 74.01, while Uttar Pradesh wasthe least performing State with an overall score of 28.61 (Figure E.1). Among the Smaller States,scores varied between 38.51 in Nagaland and 74.97 in Mizoram (Figure E.2). Among the UTs, thescores varied between 41.66 in Daman and Diu to 63.62 in Chandigarh (Figure E.3). Overall, thereis room for improvement in all States, even among the best-performing States there is substantialroom for improvement. Among the least performing States/UTs, particularly, there is an urgent needto accelerate efforts to narrow the performance gap between States and UTs.5.States vary in progress towards achieving Sustainable Development Goals (SDG). Several Stateshave made good progress towards achieving SDG goals included in the Index. Kerala and TamilNadu have already reached the 2030 SDG target for NMR, which is 12 neonatal deaths per 1,000live births. Maharashtra and Punjab are also close to achieving the target. Kerala, Tamil Nadu,Maharashtra and Punjab have already achieved the SDG target related to Under-Five MortalityRate (U5MR), which is 25 deaths per 1,000 live births. Other States and UTs still need significantimprovements to meet SDG targets.6.The changes in Health Index scores from 2015-16 to 2017-18 varied significantly across States andUTs, implying different levels of momentum to improve performance. Only about half the States andUTs had an improvement in the overall score between 2015-16 and 2017-18. The degree of changein incremental performance scores differed across the three categories of States. The magnitude ofchange was bigger in UTs compared to Larger and Smaller States. The indicators which contributedto increase or decrease in overall performance scores can be found from the snapshot of State-wiseperformance on indicators (Annexure 2).State-wise factsheets depicting their respective position according to the overall performance andincremental performance, level of each indicator, and their incremental performance from 2015-16 to2017-18 is included in Annexure 3. The changes in Health Index scores can be contributed by manyfactors. For example, a decline of a State’s Health Index score from Base Year to Reference Yearcould be due to worse performance on some indicators in the Reference Year that outweighs theimprovements on other indicators.7.4Among the Larger States, Haryana, Rajasthan and Jharkhand are the top three States in terms ofincremental performance, while Kerala, Andhra Pradesh, and Maharashtra are the top three States interms of overall performance. In terms of incremental performance in Index scores from Base Year toReference Year, the top three ranked States in the group of Larger States are Haryana (up 6.55 points),Rajasthan (up 6.30 points) and Jharkhand (up 5.99 points). However, in terms of overall performance,these States are among the bottom two-third of the range of Index scores, with Kerala (74.01), AndhraPradesh (65.13) and Maharashtra (63.99) showing the highest scores. Andhra Pradesh and Maharashtraare the only two States that are among the top one-third States on both overall performance as well asincremental performance. Andhra Pradesh has the highest proportion of indicators (63 percent) amongthe Larger States which fall in the category of “Most Improved” or “Improved”.Healthy States, Progressive India
Figure E.1 Larger States - Incremental scores and ranks, with overall performance scores and ranks in Base andReference YearsStatesKerala304050607074.01Andhra 61.2062.41Jammu & sgarh45.3336.79RajasthanUttarakhandUttar Pradesh28.6130Base Year (2015-16)Reference Year .0935.97Bihar 32.1141.5343.1038.39Odisha748.8540.20Madhya .0057.17West Bengal-1.7039.4338.4633.6940506070Overall Performance Index Score104.9763.3855.3951661.1460.41Tamil Nadu0165.21Himachal PradeshKarnataka-5-2.5563.5263.01Punjab80 -1076.55-3.4680 -10-50510Incremental ChangeOverallReferenceYear RankIncrementalRankNote: As West Bengal did not submit data on the portal, the overall and incremental performance scores were generated basedon pre-filled indicator data for 12 indicators and for the remaining 11 indicators the data from the Base Year were repeated for theReference Year.8.Among the Larger States, seven of the top ten States on overall performance also continued toimprove on their Health Index scores from the Base Year (2015-16) to the Reference Year (2017-18),while several of the least-performing States (mostly EAG1 States) further deteriorated, leading to awider performance gap across Larger States (Table E.1). Among the top ten performers, seven hadmade further improvements in overall performance scores (Andhra Pradesh, Maharashtra, Gujarat,Himachal Pradesh, Jammu & Kashmir, Karnataka and Telangana). However, among the six leastperforming States (Uttar Pradesh, Bihar, Odisha, Madhya Pradesh, Uttarakhand, and Rajasthan), fivehad decline in the overall performance scores, with the exception of Rajasthan which improved thescore by 6.30 points. Among the eight EAG States, only three of the States Rajasthan, Jharkhandand Chhattisgarh showed improvement in the overall performance between 2015-16 and 2017-18.While it is important to identify the challenges faced by the EAG States that hinders improvement inperformance, the impressive improvement in some EAG States provides learning opportunities for therest to identify effective actions to improve their overall performance scores.1. EAG States - Empowered Action Group States includes Bihar, Chhattisgarh, Jharkhand, Madhya Pradesh, Rajasthan,Uttarakhand, Uttar Pradesh, and Odisha.Executive Summary5
Table E.1 Categorization of Larger States on incremental performance and overall performanceOverall PerformanceIncremental PerformanceNot Improved(0 or less)AspirantsAchieversFront-runnersMadhya PradeshOdishaUttarakhandUttar PradeshBiharWest BengalKeralaPunjabTamil NaduLeast Improved(0.01-2.0)Moderately Improved(2.01-4.0)Most Improved(more than 4.0)–ChhattisgarhGujaratHimachal Pradesh––MaharashtraJammu & AssamAndhra PradeshNote: The States are categorized on the basis of Reference Year Index score range: Front-runners: top one-third (Indexscore 58.88), Achievers: middle one-third (Index score between 43.74 and 58.88), Aspirants: lowest one-third (Index score 43.74). The States are categorized into four groups based on incremental performance: ‘Not Improved’ ( 0 incremental change), ‘LeastImproved’ (0.01 to 2.0 points increase), ‘Moderately Improved’ (2.01 to 4.0 points increase), and ‘Most Improved’ ( 4 points increase).9.The decline in the ove
Figure 4.40 Indicator 2.2.2 - Average occupancy of a District Chief Medical Officer (CMO) or equivalent post (heading District Health Services full-time) (in months) in last three years - Smaller States and UTs 53 Figure 4.41 Indicator 3.1.1a - Vacancy of ANMs at sub-centres - Larger States 54