Transcription
Hiérarchie: Interactive Visualization for Hierarchical Topic ModelsAlison Smith, Timothy Hawes, and Meredith MyersDECISIVE ANALYTICS CorporationArlington, VA{alison.smith, timothy.hawes, meredith.myers}@dac.usAbstractBlei, 2012) and by the author (Smith et al., 2014)has focused on visualizing the results of topicmodeling to support these two goals, but thesevisualizations do not scale beyond 10 to 20 topics1 . Topic models with a small number of topics may not accurately represent very diverse corpora; instead, representative topic models requirea number of topics an order of magnitude higher,for which current visualization methods are notsuitable. We propose a visualization that displayshierarchically arranged topics. As opposed to aflat model, which can be thought of as an unordered heap of topics, a hierarchical structure allows a user to “drill into” topics of interest, meaning this technique supports directed exploration ofa corpus regardless of the number of topics in themodel.Although methods that use inherently hierarchical generative models do exist, we take a simplerecursive approach that scales to large datasets anddoes not change or depend on the underlying topicmodeling implementation. In principle, this technique could be applied to a range of topic modeling algorithms. We present this hierarchical modelto the user through an intuitive interactive visualization, Hiérarchie. Additionally, we demonstratethe capability with a Case Study on analyzing thenews coverage surrounding the Malaysia Airlinesflight that went missing on March 8, 2014.Existing algorithms for understandinglarge collections of documents often produce output that is nearly as difficultand time consuming to interpret as reading each of the documents themselves.Topic modeling is a text understandingalgorithm that discovers the “topics” orthemes within a collection of documents.Tools based on topic modeling become increasingly complex as the number of topics required to best represent the collection increases. In this work, we presentHiérarchie, an interactive visualizationthat adds structure to large topic models,making them approachable and useful toan end user. Additionally, we demonstrateHiérarchie’s ability to analyze a diversedocument set regarding a trending newstopic.1IntroductionIn computational linguistics and related fields, significant work has been invested in the developmentof algorithms for gaining insight from large bodies of text. The raw output of these techniquescan be so complex that it is just as difficult andtime consuming to understand as reading the text.Therefore, it is an especially challenging problemto develop visualizations that add analytic value,making complex analysis accessible by helping auser to understand and interact with the output ofthese algorithms.Topic Modeling is a common, data-driven technique for summarizing the content of large textcorpora. This technique models documents as distributions of topics and topics as distributions ofwords. In practice, topic models are used to provide a high-level overview and guided explorationof a corpus. Prior work by others (Chaney and2Related WorkLatent Dirichlet Allocation (LDA) (Blei et al.,2003b) is an unsupervised algorithm for performing statistical topic modeling that uses a “bag ofwords” approach, treating each document as a setof unordered words. Each document is represented as a probability distribution over some topics, and each topic is a probability distribution over1Either the visualization becomes too confusing to understand or using the visualization to explore the corpus takestoo much time — or both.71Proceedings of the Workshop on Interactive Language Learning, Visualization, and Interfaces, pages 71–78,Baltimore, Maryland, USA, June 27, 2014. c 2014 Association for Computational Linguistics
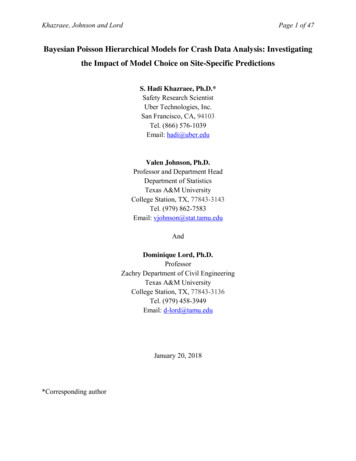
words. LDA is an effective, scalable approach tomodeling a large text corpus; however, the resultis a flat topic model with no hierarchical structurefor a visualization to exploit.not easily support data-dense hierarchies, such ashierarchical topic models. Nested lists can be hardto navigate as they fail to maintain the same sizeand approximate structure during exploration. Anicicle plot, which is a vertical representation ofa partition chart, suffers from similar renderingconstraints and limits positioning, sizing, andreadability of text labeling. Treemaps use nestedrectangles to display hierarchical data, but havebeen criticized as not cognitively plausible (Fabrikant and Skupin, 2005), making them difficultto interpret. Additionally, as is the case fornested lists and icicle plots, treemaps obscure thestructure of the underlying data to accommodatelayout and sizing constraints.Hiérarchie uses an interactive sunburstchart (Stasko et al., 2000), which is a partitionchart with radial orientation that supports visualizing large or small hierarchies without requiringscrolling or other interaction. The sunburst chartimplementation used by Hiérarchie is directlybased upon the Sequences Sunburst (Rodden,2013) and Zoomable Sunburst (Bostock, 2012b)examples that are implemented in the Data-DrivenDocuments library (Bostock, 2012a).Approaches exist for learning topic hierarchiesfrom data, such as the Nested Chinese restaurantprocess (Blei et al., 2003a) and Pachinko Allocation (Li and McCallum, 2006). These approachesbuild the intuitions of the hierarchy into the modeling algorithm. This adds additional complexityand tightly couples the hierarchical process withthe underlying modeling algorithm.Our Hierarchical Topic Modeling method usesa simple top-down recursive approach of splittingand re-modeling a corpus to produce a hierarchical topic model that does not require a specific underlying topic modeling algorithm. This work ismost similar to Dirichlet Compound MultinomialLatent Dirichlet Allocation, DCM-LDA, whichprocesses the corpus via a bottom-up approach.DCM-LDA first trains unique topic models basedon co-occurrence of words in each document, andthen clusters topics across documents (Mimno andMcCallum, 2007).Existing visualizations support analysis and exploration of topic models. Topical Guide (Gardneret al., 2010), TopicViz (Eisenstein et al., 2012),and the topic visualization of (Chaney and Blei,2012) provide visualization and interaction withtopic models for corpus exploration and understanding. These visualizations typically represent topics as word clouds, where the topic modelas a whole is presented as an unordered set oftopics. This approach is not optimal for efficient exploration and understanding, and the seaof word clouds quickly becomes overwhelming asthe number of topics grows. Termite (Chuang etal., 2012) uses a tabular layout to represent a topicmodel and supports easy comparison of wordswithin and across topics. The Termite visualization organizes the model into clusters of relatedtopics based on word overlap. This visualizationtechnique is space saving and the clustering speedscorpus understanding. Our approach clusters topics by document overlap instead of word overlapand is hierarchical, providing multiple levels of related topics for intuitive corpus exploration.3Hierarchical Topic ModelingThe HLDA algorithm takes a simple, top-downapproach for producing hierarchical topic modelsby recursively splitting and re-modeling a corpus.Standard LDA discovers the distribution of wordsin topics and topics in documents through an inference process; our implementation uses Gibbs sampling (Griffiths and Steyvers, 2004) for inference.As a result of this process, each word in a document is assigned to a topic. At the end of sampling,HLDA uses these word-to-topic assignments toconstruct new synthetic documents for each topicfrom each of the initial documents. These synthetic documents contain only those words fromthe original document that are assigned to the topicand make up the synthetic corpus for the topic. So,if there are 10 topics in the topic model, up to 10new synthetic documents — one for each topic —will be created for each document, and these documents will be merged into the topic’s syntheticcorpus.For each topic, t, we then construct a new topicmodel, mt , using the synthetic corpus corresponding to t. The discovered topics in mt representthe subtopics of t. This process, illustrated inNested lists, icicle plots (Kruskal andLandwehr, 1983), and treemaps (Shneiderman, 1998) are commonly used for visualizinghierarchical data, but they have limitations and do72
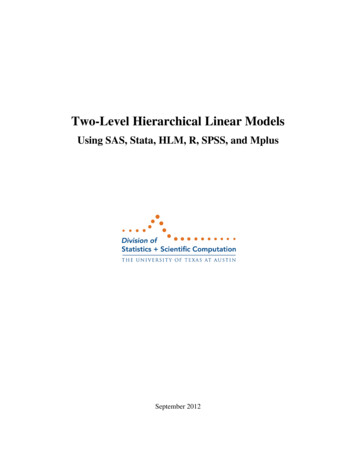
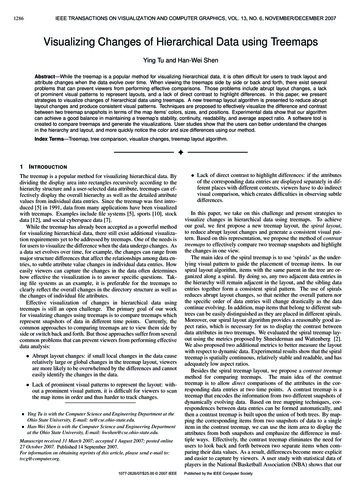
Figure 1: Overview of the HLDA algorithm. The algorithm runs LDA over the original corpus whichresults in a topic model and word-topic assignments. These word-topic assignments are used to createsynthetic documents — one for each document/topic pair. The synthetic documents are grouped intosynthetic corpora by topic, and LDA is run for each of the synthetic corpora. This process continuesrecursively until the synthetic corpus and documents are too small to model. The result is a hierarchy oftopic distributions.Figure 1, can be repeated recursively, until thesynthetic corpus and synthetic documents are toosmall to model.2 While the number of topics ateach level in the hierarchy must be specified, theoverall number of topics discovered by this approach is a byproduct of the algorithm.This modeling approach is a wrapper algorithmthat can be applied to any modeling approach thatassigns individual tokens in documents to specifictopics.4to explore the topics at all levels of the hierarchy3. Accessibility - view the underlying data associated with the topicsMany of the visualizations we considered forviewing topic hierarchies obscure or misrepresentthe true structure of their underlying data, largelydue to the amount of space required for rendering.Others provide less skewing of the structure, yet,for large hierarchies, require a high degree of userinteraction (clicking and navigating) to expose theunderlying data. We found that a sunburst chart isbest suited to our purposes as it supports visualizing large or small hierarchies without requiringscrolling or other interaction. Unlike other hierarchical visualizations, the sunburst can accommodate the size of a typical computer screen withouthiding or minimizing structure.Figure 2 displays a top-level view of theHiérarchie visualization for a dataset of Tweets,Reddit comments, and news articles regarding theMalaysia Airlines flight. Each level of the hierarchical topic model is represented as a ring of theSunburst chart where the arcs comprising the ringsrepresent the individual topics. By not labelingeach arc, or “slice,” within the sunburst, the highlevel overview of the hierarchical topic model ispresented to the user with minimal complexity.The initial, high-level view of the sunburstchart follows the design principle of overviewfirst, zoom and filter, details on demand (Shnei-HiérarchieTo effectively visualize the topic hierarchy output from HLDA, it is important to properly convey the relevance and structure of the topics. Intuitive interaction with the visualization is important so users can easily explore topics and identifypatterns. Without effective visualization, formingconclusions becomes as difficult as approachingthe raw documents without the benefit of algorithmic analysis.In practice, a diverse set of visualizations areused to display hierarchical data. An effective visualization of a hierarchical topic model shouldsupport the following Use Cases:1. Accuracy - display topics without hiding orskewing the hierarchical structure2. Granularity - interact with the visualization2This is parameterized and can be set based on tolerablequality degradation from short documents or small corpora.73
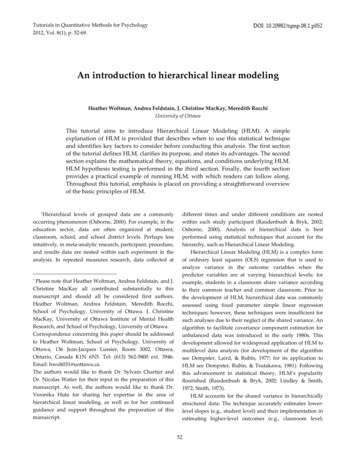
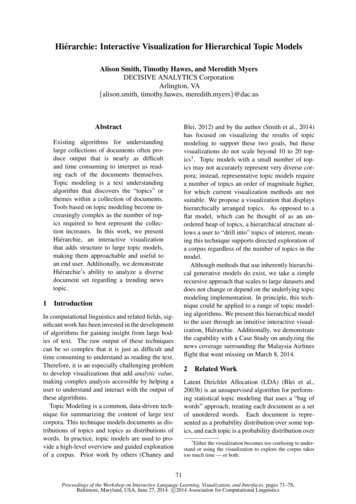
Figure 2: The top-level view of the Hiérarchie visualization. This visualization uses a sunburst chart,which is optimal for displaying the topic hierarchy created by the HLDA algorithm without hiding orskewing the hierarchical structure.trail displays the hierarchical path leading to thecurrent topic (Aery, 2007). A contextual anchor,or contextual snapshot (Mindek et al., 2013), isused to provide additional context to the user. Thecontextual anchor displays the entire hierarchicaltopic model to the user at all times. When the userselects a topic slice to view a section of the hierarchy in more detail, the contextual anchor highlights the position of the selected topic within thehierarchical topic model. This offers context tothe user, regardless of their location within the hierarchy. An example of the breadcrumb trail andcontextual anchor is displayed in Figure 3.derman, 1996) and does not display details for every topic, requiring user interaction to expose additional data. In our sunburst visualization, userinteraction allows for exploration of the information at a finer granularity. When hovering over atopic of interest, the words of the topic are displayed in the empty center of the sunburst. This isan efficient use of space and prevents disorientation, since minimal eye movement is required between the slice of interest (where the user’s mouseis located) and the center list of topics.When a user selects a slice of interest, the sunburst zooms in to display the selected topic andsub-topics. This allows the user to analyze a specific section of the hierarchy. This interaction isshown in Figures 4 and 5. The sunburst has reoriented to display the selected sub-topic, (plane,crash, crashed) as the visualization root.To provide a clean and meaningful display oftopic information for each slice, only one slice’sinformation can be shown at a time. As the sunburst zooms to display selected topics, it is useful to provide context for the location of the topicwithin the overall topic hierarchy. Therefore, twocontextual visualizations — a breadcrumb trailand a contextual anchor — are provided. Breadcrumb trails are often utilized to provide contextduring navigation, such as when navigating a filestructure or large retail website. The breadcrumb5Case StudyThe search for Malaysia Flight MH-370 was ongoing during the composition of this paper, withfew clues indicating what might have actually occurred. In an attempt to organize the various theories, we collected 1600 Tweets and 970 Reddit comments containing the keyword “MH370”in addition to 27 Daily Beast articles returned bya URL filter for any of the key words “malay,”“370”, “flight,” “missing,” “hijack,” “radar,” “pilot,” “plane,” “airplane,” and “wreckage.” Thiscorpus offers a diverse sampling of discussionconcerning the missing airliner that is too largefor a human alone to quickly analyze. We pro74
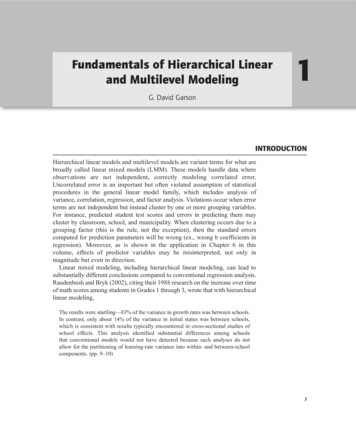
plane, crash, crashedplane, landed, landplane, think, peoplepilot, plane, hijackingterrorist, terrorism, passportssuicide, pilot, oceanShah, Anwar, politicalplane, China, worldphone, phones, cellevidence, think, makeTable 1: The 10 high-level topics of the modelgenerated from running HLDA on the MalaysiaFlight MH-370 corpus. The bolded topics suggestspecific theories regarding the status of the plane.Figure 3: Our simple breadcrumb trail and contextual anchor offer constant context as the user explores the visualization. Highlighted slices withinthe contextual anchor are those currently displayed in the sunburst visualization.crash, water, crashedfailure, catastrophic, maydaymechanical, failure, daysplane, ocean, didplane, error, lostcessed the corpus with HLDA using 10 topics foreach level. This number of topics balances granularity and accuracy. Using too many narrow topics results in information overload, whereas toofew broad topics could be difficult to understand3 .We then visualized the resulting hierarchical topicmodel with Hiérarchie as shown in Figure 2. Aswe were most interested in looking at the various theories surrounding the flight, we chose toexplore one of the high-level topics, (plane, people, pilot, think, know), in more detail, becausemany of this topic’s sub-topics suggest specifictheories related to the outcome of MH-370. Table 1 shows the 10 sub-topics for the “theory”topic represented by their 3 most probable terms.The bolded topics are those that suggest theories.Figure 4 shows the sunburst graph reoriented after the selection of the main “theory” topic. Thesunburst graph is labeled with the sub-topics thatrepresent the selection of interesting theories.These topics suggest four primary theories: thatthe plane landed, the plane crashed, the planewas hijacked by terrorists, or the pilot crashedthe plane in an act of suicide. Hovering over the(plane, crash, crashed) topic shows the sub topics,and clicking the topic reorients the sunburst chart,Table 2: A selection of the sub-topics of discussion surrounding a plane crash scenario. Thesesub-topics suggest more detailed discussion. Forexample, that the plane crash may have resultedfrom a catastrophic mechanical failure or other error.as shown in Figure 5. The sub-topics under (plane,crash, crashed) suggest more detailed discussionof a crash scenario, such as the plane crashing intothe water, and that there may have been a catastrophic mechanical failure or other error. Table 2contains a selection of these sub-topics.An alternate theory is suggested by the (terrorist, terrorism, passports) topic, which is shown inFigure 6. The sub-topics here suggest more detailed discussion involving terrorism as the causefor the plane’s disappearance. Table 3 contains aselection of these sub-topics.The hierarchical topic model produced byHLDA and visualized with Hiéarchie provide automated organization of the many theories regarding the missing Malaysian airliner. The high-leveloverview provides a quick summary of all of thediscussion surrounding the event, while the hierarchical organization and intuitive explorationallows the discussion, and specifically each theory, to be explored in depth, exposing potentially3Deviating from this number slightly may also be effective, and experimentation is required to determine the number of topics that is the best fit for the current data set and endgoal.75
passports, stolen, usingterrorists, crash, terroristMuslim, Muslims, Islamicattack, going, terrorresponsibility, common, groupTable 3: A selection of the sub-topics of discussion surrounding a terrorism scenario. These subtopics include more details, such as the discussionof stolen passports, relevant to the theory that theplane disappearance is the result of an act of terrorism.Figure 5: Clicking the (plane, crash, crashed)topic slice in the top-level (plane, people, pilot)visualization reorients the sunburst to display theslice as its root, enabling more detailed exploration of sub-topics.Figure 4: Sub-categories of interest have beenpurposely numbered for clarity. 1:(plane, crash,crashed); 2: (plane, landed, land); 3: (terrorist,terrorism, passports); 4: (suicide, pilot, ocean).relevant information. Organizing all of this databy hand would be difficult and time consuming.This intuitive visualization in combination withour method for organizing the underlying datatransforms a disparate corpus of documents intoa useful and manageable information source.6Future Work and ConclusionThe Hiéarchie visualization and related hierarchical topic modeling algorithm support the understanding and exploration of text corpora that aretoo large to read. Although existing topic modeling algorithms effectively process large corpora,the resulting topic models are difficult to interpretin their raw format. Current visualization methods only scale to a small number of topics, whichcannot accurately represent a diverse corpus. Additional structure is required to organize a representative topic model of a large dataset into an un-Figure 6: The(terrorist, terrorism, passports)topic slice in the top-level (plane, people, pilot)visualization.76
derstandable and navigable analysis tool.Our approach visualizes the hierarchical topicmodel produced by the HLDA algorithm to support intuitive, directed browsing of topical structure within a diverse
used to display hierarchical data. An effective vi-sualization of a hierarchical topic model should support the following Use Cases: 1. Accuracy - display topics without hiding or skewing the hierarchical structure 2. Granularity - interact with the visualization 2This is parameterized and can be set based on tolerableFile Size: 1MB