Transcription
Top 5 Java performance metrics,tips & tricks
Top 5 Java performance metrics, tips & tricksChapter 1: Getting started with APM.4Chapter 2: Challenges in implementing an APM strategy.9Chapter 3: Top 5 performance metrics to capture in enterprise Java applications.14Chapter 4: AppDynamics approach to APM .20Chapter 5: APM tips and tricks.25Top 5 Java performance metrics, tips & tricks2
Chapter 1Getting started with APM
Chapter 1: Getting started with APMApplication Performance Management, or APM, is the monitoring and management of the availability and performance ofsoftware applications. Different people can interpret this definition differently so this article attempts to qualify what APMis, what it includes, and why it is important to your business. If you are going to take control of the performance of yourapplications, then it is important that you understand what you want to measure and how you want to interpret it in thecontext of your business.What is Application Performance Management (APM)?As applications have evolved from stand-alone applications to client-serverapplications to distributed applications and ultimately to cloud-based elasticapplications, application performance management has evolved to follow suit.When we refer to APM we refer to managing the performance of applicationssuch that we can determine when they are behaving normally and when they arebehaving abnormally. Furthermore, when someone goes wrong and an applicationis behaving abnormally, we need to identify the root cause of the problem quicklyso that we can remedy it.We might observe things like:-- The physical hardware upon which the application is running-- The virtual machines in which the application is running-- The JVM that is hosting the application environment-- The container (application server or web container) in which the applicationis running-- The behavior of the application itself-- Supporting infrastructure, such as network communications, databases,caches, external web services, and legacy systemsOnce we have captured performance metrics from all of these sources, we needto interpret and correlate them with respect to the impact on your businesstransactions. This is where the magic of APM really kicks in. APM vendors employexperts in different technologies so that they can understand, at a deep level,what performance metrics mean in each individual system and then aggregatethose metrics into a holistic view of your application.The next step is to analyze this holistic view your application performance againstwhat constitutes normalcy. For example, if key business transactions typicallyrespond in less than 4 seconds on Friday mornings at 9am but they are respondingin 8 seconds on this particular Friday morning at 9am then the question is why?An APM solution needs to identify the paths through your application for thosebusiness transactions, including external dependencies and environmentalinfrastructure, to determine where they are deviating from normal. It then needsto bundle all of that information together into a digestible format and alert you tothe problem. You can then view that information, identify the root cause of theperformance anomaly, and respond accordingly.Finally, depending on your application and deployment environment, there maybe things that you can tell the APM solution to do to automatically remediate theproblem. For example, if your application is running in a cloud-based environmentand your application has been architected in an elastic manner, you can configurerules to add additional servers to your infrastructure under certain conditions.Thus we can refine our definition of APM to include the following activities:-- The collection of performance metrics across an entire applicationenvironment-- The interpretation of those metrics in the light of your business applications-- The analysis of those metrics against what constitutes normalcy-- The capture of relevant contextual information when abnormalities aredetected-- Alerts informing you about abnormal behavior-- Rules that define how to react and adapt your application environment toremediate performance problemsTop 5 Java performance metrics, tips & tricks4
Chapter 1: Getting started with APM (cont’d)Why is APM important?It probably seems obvious to you that APM is important, but you will likely needto answer the question of APM importance to someone like your boss or thecompany CFO that wants to know why she must pay for it. In order to qualify theimportance of APM, let’s consider the alternatives to adopting an APM solutionand assess the impact in terms of resolution effort and elapsed down time.First let’s consider how we detect problems. An APM solution alerts you to theabnormal application behavior, but if you don’t have an APM solution then youhave a few options:-- Build synthetic transactions-- Manual instrumentation-- Wait for your users to call customer support!?A synthetic transaction is a transaction that you execute against your applicationand with which you measure performance. Depending on the complexity of yourapplication, it is not difficult to build a small program that calls a service andvalidates the response. But what do you do with that program? If it runs on yourmachine then what happens when you’re out of the office? Furthermore, if you dodetect a functional or performance issue, what do you do with that information?Do you connect to an email server and send alerts? How do you know if this is areal problem or a normal slowdown for your application at this hour and day ofthe week? Finally, detecting the problem is one thing, how do you find the rootcause of the problem?The next option is manually instrumenting your application, which means thatyou add performance monitoring code directly to your application and recordit somewhere like a database or a file system. Some challenges in manualinstrumentation include: what parts of my code do I instrument, how do Ianalyze it, how do I determine normalcy, how do I propagate those problemsup to someone to analyze, what contextual information is important, and soforth. Plus you have introduced a new problem: you have introduced performancemonitoring code into your application that you need to maintain. Furthermore,can you dynamically turn it on and off so that your performance monitoring codedoes not negatively affect the performance of your application? If you learn moreabout your application and identify additional metrics you want to capture, doyou need to rebuild your application and redeploy it to production? What if yourperformance monitoring code has bugs?There are other technical options, but what I find most often is that companiesare alerted to performance problems when their custom service organizationreceives complaints from users. I don’t think I need to go into details about whythis is a bad idea!Next let’s consider how we identify the root cause of a performance problemwithout an APM solution. Most often I have seen companies do one of two things:-- Review runtime logs-- Attempt to reproduce the problem in a development / test environmentLog files are great sources of information and many times they can identifyfunctional defects in your application (by capturing exception stack traces), butwhen experiencing performance issues that do not raise exceptions, they typicallyonly introduce additional confusion. You may have heard of, or been directlyinvolved in, a production war room. These war rooms are characterized by fingerpointing and attempts to indemnify one’s own components so that the pressureto resolve the issue falls on someone else. The bottom line is that these meetingsare not fun and not productive.Alternatively, and usually in parallel, the development team is tasked withreproducing the problem in a test environment. The challenge here is that youusually do not have enough context for these attempts to be fruitful. Furthermore,if you are able to reproduce the problem in a test environment, that is only thefirst step, now you need to identify the root cause of the problem and resolve it!So to summarize, APM is important to you so that you can understand thebehavior of your application, detect problems before your users are impacted,and rapidly resolve those issues. In business terms, an APM solution is importantbecause it reduces your Mean Time To Resolution (MTTR), which means thatperformance issues are resolved quicker and more efficiently so that the impactto your business bottom line is reduced.Top 5 Java performance metrics, tips & tricks5
Chapter 1: Getting started with APM (cont’d)Evolution of APMBuy versus buildThe APM market has evolved substantially over the years, mostly in an attempt toadapt to changing application technologies and deployments. When we had very simpleapplications that directly accessed a database then APM was not much more than aperformance analyzer for a database. But as applications moved to the web and we sawthe first wave of application servers then APM solutions really came into their own. At thetime we were very concerned with the performance and behavior of individual movingparts, such as:This article has covered a lot of ground and now you’re faced with a choice: do youevaluate APM solutions and choose the one that best fits your needs or do you tryto roll your own. I really think this comes down to the same questions that you needto ask yourself in any buy versus build decision: what is your core business and is itfinancially worth building your own solution?-- Physical servers and the operating system hosting our applications-- JVM-- Application server behavior-- Application response timeWe captured metrics from all of these sources and stitched them together into a holisticstory. We were deeply interested in garbage collection behavior, thread and connectionpools, operating system reads and writes, and so forth. Not to mention, we raised fatalalerts whenever a server went down. Advanced implementations even introduced theability to trace a request from the web server that received it across tiers to any backendsystem, such as a database. These were powerful solutions, but then something happenedto rock our world: the cloud.The cloud changed our view of the world because no longer did we take a system-levelview of the behavior of our applications, but rather we took an application-centric viewof the behavior of our applications. The infrastructure upon which an application runsis still important, but what is more important is whether or not an application is able toexecute its business transactions in a normal fashion. If a server goes down, we do notneed to worry as long as the application business transactions are still satisfied. As amatter of fact, cloud-based applications are elastic, which means that we should expectthe deployment environment to expand and contract on a regular basis. For example,if you know that your business experiences significant load on Fridays from 5pm-10pmthen you might want to start up additional virtual servers to support that additional loadat 4pm and shut them down at 11pm. The former APM monitoring model of raising alertswhen servers go down would drive you nuts.Furthermore, by expanding and contracting your environment, you may find that singleserver instances only live for a matter of a few hours. I have heard of one large cloudbased application that uses a very large amount of RAM in its JVMs, but its recyclingstrategy ensures that those servers are shut down before garbage collection ever hasa chance to run. This might be an extreme example, but it illustrates that what wasonce one of the most impactful performance issues has been rendered a non-issue by acreative deployment model.If your core business is selling widgets then it probably does not make a lot of senseto build your own performance management system. If, on the other hand, your corebusiness is building technology infrastructure and middleware for your clients then itmight make sense (but see the answer to question two below). You also have to askyourself where your expertise lies. If you are a rock star at building an eCommerce sitebut have not invested the years that APM vendors have in analyzing the underlyingtechnologies to understand how to interpret performance metrics then you run therisk of leaving your domain of expertise and missing something vital.The next question is: is it financially worth building your own solution? This dependson how complex your applications are and how downtime or performance problemsaffect your business. If your applications leverage a lot of different technologies (e.g.Java, .NET, PHP, web services, databases, NoSQL data stores) then it is going tobe a large undertaking to develop performance management code for all of theseenvironments. But if you have a simple servlet that calls a database then it might notbe insurmountable.Finally, ask yourself about the impact of downtime or performance issues on yourbusiness. If your company makes its livelihood by selling its products online thendowntime can be disastrous. And in a modern competitive online sales world,performance issues can impact you more than you might expect. Consider how theaverage person completes a purchase: she typically researches the item online tochoose the one she wants. She’ll have a set of trusted vendors (and hopefully you’rein that honored set) and she’ll choose the one with the lowest price. If the site isslow then she’ll just move on to the next vendor in her list, which means you justlost the sale. Additionally, customers place a lot of value on their impression of yourweb presence. This is a hard metric to quantify, but if your web site is slow thenit may damage customer impressions of your company and hence lead to a loss inconfidence and sales.All of this is to say that if you have a complex environment and performance issuesor downtime are costly to your business then you are far better off buying an APMsolution that allows you to focus on your core business and not on building theinfrastructure to support your core business.You may still find some APM solutions from the old world, but the modern APM vendorshave seen these changes in the industry and have designed APM solutions to focus onyour application behavior and have placed a far greater importance on the performanceand availability of business transactions than on the underlying systems that supportthem.Top 5 Java performance metrics, tips & tricks6
Chapter 1: Getting started with APM (cont’d)ConclusionApplication Performance Management involves measuring the performance ofyour applications, capturing performance metrics from the individual systemsthat support your applications, and then correlating them into a holistic view.The APM solution observes your application to determine normalcy and, when itdetects abnormal behavior, it captures contextual information about the abnormalbehavior and notifies you of the problem. Advanced implementations even allowyou to react to abnormal behavior by changing your deployment, such as byadding new virtual servers to your application tier that is under stress. An APMsolution is important to your business because it can help you reduce your meantime to resolution (MTTR) and lessen the impact of performance issues on yourbottom line. If you have a complex application and performance or downtimeissues can negatively affect your business then it is in your best interested toevaluate APM solutions and choose the best one for your applications.This article reviewed APM and helped outline when you should adopt an APMsolution. In the next article, we’ll review the challenges in implementing an APMstrategy and dive much deeper into the features of APM solutions so that you canbetter understand what it means to capture, analyze, and react to performanceproblems as they arise.Top 5 Java performance metrics, tips & tricks7
Chapter 2Challenges in implementing anAPM strategy
Chapter 2: Challenges in implementing an APM strategyThe last article presented an overview of Application Performance Management (APM), described high-level strategies andrequirements for implementing APM, presented an overview of the evolution of APM over the past several years, and providedyou with some advice about whether you should buy an APM solution or build your own. This article expands upon thatfoundation by presenting the challenges to effectively implementing an APM strategy. Specifically this article presents thechallenges in:- Capturing performance data from disparate systems- Analyzing that performance data- Automatically, or programmatically, responding to performance problemsCapturing performance dataMost applications of substance leverage a plethora of technologies. For example,you may have an application server or a web container, a SQL database, one ormore NoSQL databases, a caching solution, web services running on alternateplatforms, and so forth. Furthermore, we’re finding that certain technologies arebetter at solving certain problems than others, which means that we’re addingmore technologies into the mix.In order to effectively manage the performance of your environment, you need togather performance statistics from each component with which your applicationinteracts. We can categories these metrics into two raw buckets:-- Business Transaction Components-- Container or Engine ComponentsMeasuring business transaction performanceThe previous article emphasized the importance of measuring business transactionsas an indicator of the performance of your application because business transactionsidentify real-user behavior. If your users are able to complete their businesstransactions in the expected amount of time then we can say that the performanceof the application is acceptable. But if business transactions are unable to completeor are performing poorly then there is a problem that needs to be addressed.Business Transactions can be triggered by any significant interaction with yourapplication, whether that is a web request, a web service request, or a messagethat arrives on a message queue. Business Transactions are composed of variouscomponents, or segments, that run on tiers: as a request passes from one systemto another, such as a by executing a web service call or executing a databasequery, we add the performance of that tier to the holistic business transaction.Therefore, an APM strategy that effectively captures business transactions notonly needs to measure the performance of the business transaction as a whole,but also needs to measure the performances of its constituent parts. Practicallythis means that you need to define a global business transaction identifier (token)for each request, find creative ways to pass that token to other services, and thenaccess that token on the those servers to associate this segment of the businesstransaction with the holistic business transaction on an APM server. Fortunatelymost communication protocols support mechanisms for passing tokens betweenmachines, such as using custom HTTP headers in web requests or custom JMSheaders/properties in asynchronous messaging. The point is that this presents achallenge because you need to account for all of these communication pathwaysin your APM strategy.Once you have captured the performance of a business transaction and itsconstituent tiers, the fun begins. The next section describes analysis in moredepth, but assuming that you have identified a performance issue, the next step isto capture a snapshot of the performance trace of the entire business transaction,along with any other relevant contextual information. There are different strategiesfor capturing performance snapshots, but the most common are byte-codeinstrumentation (BCI) and thread polling.Java source code is compiled into byte-code, which is similar to assembly or machinecode, and then the Java Virtual Machine interprets the byte-code in real-time. Bytecode instrumentation involves modifying the byte-code of a running application,typically by hooking into the JVM’s class loader, to inject performance-monitoringcode. For example, we might create a new method that wraps a method call withcode that captures the response time and identifies exceptions. BCI is complex andnot for the weary hearted, but it is a well-understood science at this point. The bigcaveat to be aware of is that you need to capture performance information withoutnegatively impacting the performance of the business transaction itself. Statedanother way, don’t make the problem (too much) worse!Top 5 Java performance metrics, tips & tricks9
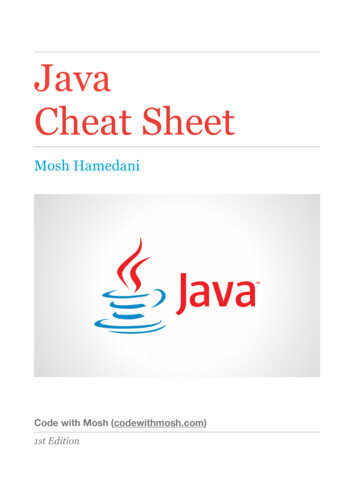
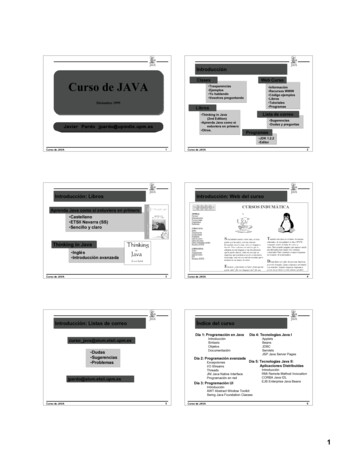
Chapter 2: Challenges in implementing an APM strategy (cont’d)BCI provides a real-user view of the behavior of the business transaction, but itcan be a heavyweight solution that can slow down the overall performance of thebusiness transaction. An alternative is to identify the thread that is executing thebusiness transaction and poll for a stack trace of that thread on a regular interval,such as every 10 or 50 milliseconds. From these stack traces you can infer howlong each method took to execute, at the granularity of your polling interval.Thread polling adds constant overhead to the JVM while it is running so it doesnot get in the way any individual business transaction execution. The key, as withBCI, is to perform thread polling sparingly and intelligently to reduce the overheadthat you’re adding to already overburdened machine.Measuring container performanceIn addition to capturing the performance of business transactions, you are goingto want to measure the performance of the containers in which your applicationis running. Unfortunately the benefits that Java brings us through the notion of“write once, run everywhere” translates to challenges in container monitoring.Figure 1 attempts to illustrate this complexity.Your AppDependecies/JARsApplication Server / Web ContainerJVMAn application runs in an application server or web container that runs in a JVM thatruns on an operating system that runs on physical (or virtual) hardware. If thereis a performance issue in the application, there is a fair amount of infrastructurethat could be contributing to the problem. And in a modern virtualized or cloudbased deployment, the problem is more complex because you have introduced anadditional layer of infrastructure between the JVM and the underlying hardware.In order to effectively manage the performance of your application, you need togather container metrics such as the following:-- Application Server / Web Container: thread pool usage, resource pool usage(e.g. connection pools), cache hit-counts and miss-counts, queued requests-- JVM: memory usage, garbage collection, JVM threads-- Operating Systems: network usage, I/O rates, system threads-- Hardware: CPU utilization, system memory, network packetsThese are just a few of the relevant metrics, but you need to gather informationat this level of granularity in order to assess the health of the environment inwhich your application is running. And as we introduce additional technologiesin the technical stack, such as databases, NoSQL databases, .NET services,distributed caches, key/value stores, and so forth, they each have their own setof metrics that need to be captured and analyzed. Building readers that capturethese metrics and then properly interpreting them can be challenging.Other ProcessesOperating SystemHardwareFigure 1 A JVM’s Layered ArchitectureTop 5 Java performance metrics, tips & tricks10
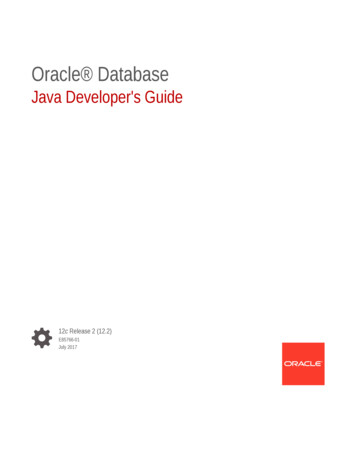
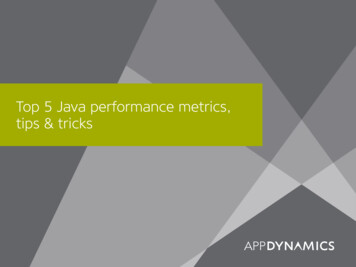
Chapter 2: Challenges in implementing an APM strategy (cont’d)Analyzing performance dataNow that we have captured the response times of business transactions, bothholistically and at the tiered level, and we have collected a hoard of containermetrics, the next step is to combine these data points and derive business valuefrom them. As you might surmise, this is a non-trivial effort.Let’s start with business transactions. We already said that we needed to generatea unique token for each business transaction and then pass that token from tierto tier, tracking the response time for each tier and associating it with that token.We need a central server to which we send these constituent “segments” that willbe combined into an overall view the performance of the business transaction.Figure 2 shows this visually.Server 2BrowserServer 1Segment 2Business TransactionSegment 1Server 3CentralMonitoringServerS1S2S3Segment 3Figure 2 Assembling Segments into a Business TransactionAnalyzing the performance of a business transaction might sound easy on thesurface: compare its response time to a service-level agreement (SLA) and if it isslower than the SLA then raise an alert. Unfortunately, in practice it is not thateasy. In the years that I spent delivering performance tuning engagements todozens of companies I can count on one hand the number of companies that hadformally defined SLAs. In practice we want to instead determine what constitutes“normal” and identify when behavior deviates from “normal”.We need to capture the response times of individual business transactions, as awhole, as well as the response times of each of those business transactions’ tiersor segments. For example, we might find that the “Search” business transactiontypically responds in 3 seconds, with 2 seconds spent on the database tier and1 second spent in a web service call. But this introduces the question of whatconstitutes “typical” behavior in the context of your application?Different businesses have different usage patterns so the normal performanceof a business transaction for an application at 8am on a Friday might not benormal for another application. In short, we need to identify a baseline of theperformance of a business transaction and analyze its performance against thatbaseline. Baselines can come in the following patterns:-- The average response time for the business transaction, at the granularity ofan hour, over some period of time, such as the last 30 days.-- The average response time for the business transaction, at the granularityof an hour, based on the hour of day. For example, we might compare thecurrent response time at 8:15am with the average response time for everyday from 8am-9am for the past 30 days.-- The average response time for the business transaction, at the granularityof an hour, based on the hour of the day and the day of the week. In thispattern we compare the response time of a business transaction on Mondayat 8:15am with the average response time of the business transaction from8am-9am on Mondays for the past two months. This pattern works wellfor applications with hourly variability, such as ecommerce sites that seeincreased load on the weekends and at certain hours of the day.-- The average response time for the business transaction, at the granularity ofan hour, based on the hour of day and the day of the month. In this patternwe compare the response time of a business transaction on the 15th of themonth at 8:15am with the average response time of the business transactionfrom 8am-9am on the 15th of the month for the past 6 months. This patternworks well for applications with date based variability, such as bankingapplications in which users deposit their checks on the 15th and 30th ofeach month.In addition to analyzing the performance of business transactions, we also needto analyze the performance of the container and infrastructure in which theapplication runs. There are abhorrent conditions that can negatively impact allbusiness transactions running in an individual environment. For example, if yourapplication server runs out of threads then requests will back up, if the JVM runs amajor/full garbage collection then all threads in the JVM will freeze, if the OS runsa backup process with heavy I/O then the machine will slow down, and so forth. Itis important to correlate business transaction behavior with container behavior toidentify false-positives: the application may be fine, but the environment in whichit is running is under duress.Finally, container metrics can be key indicators that trigger automated responsesthat dynamically change the environment, which we explore in the next section.Top 5 Java performance metrics, tips & tricks11
Chapter 2: Challenges in implementing an APM strategy (cont’d)Automatically Responding to Performance IssuesConclusionTraditional applications that ran on very large monolithic machines, such asmainframes or even high-end servers, suffered from the problem that theywere very static: adding new servers could be measured in days, weeks, andsometimes months. With the advent of the cloud, these static problems wentaway as application environments became elastic. Elasticity means that applicationenvironments can be dynamically changed at run-time: more virtual servers canbe added during peak times and removed during slow times. It is important tonote that elastic applications require different architectural patterns than theirtraditional counterparts, so it is not as simple as deploying your traditionalapplication to a cloud-based environment, but I’ll save that discussion for a futurearticle.This article reviewed some of the challenges in implementing an APM strategy.A proper APM strategy requires that you capture the response time of businesstransactions and their constituent tiers, using techniques like byte-codeinstrumentation and thread polling, and that you capture container metrics acrossyour entire application ecosystem. Next, you need to correlate business transactionsegments in a management server, identify the baseline that best meets you
Top 5 Java performance metrics, tips & tricks 4 What is Application Performance Management (APM)? As applications have evolved from stand-alone applications to client-server applications to distributed applications and ultimately to cloud-based elastic applications, application performance management has evolved to follow suit.