Transcription
Two-Level Hierarchical Linear ModelsUsing SAS, Stata, HLM, R, SPSS, and MplusSeptember 2012
Two-Level Hierarchical Linear ModelsTable of ContentsIntroduction . 3Model Considerations . 3Intraclass Correlation Coefficient . 4Example Dataset . 4Intercept-only Model (Unconditional Model) . 4Random Intercept with One Fixed Level-1 Factor (Non-Random Slope). 10Random Intercept and Slope for One Level-1 Factor . 14Random Slope for Two Level-1 Factors . 18One Level-2 Factor and Two Random Level-1 Factors (No Interactions) . 23One Level-2 Factor and Two Random Level-1 Factors with Interaction . 29Overall Summary. 34References . 352The Division of Statistics Scientific Computation, The University of Texas at Austin
Two-Level Hierarchical Linear ModelsIntroductionThis document serves to compare the procedures and output for two-level hierarchical linearmodels from six different statistical software programs: SAS, Stata, HLM, R, SPSS, and Mplus.We compare these packages using the popular.csv dataset from Chapter 2 of Joop Hox’sMultilevel Analysis (2010), which can be downloaded e six models described below are all variations of a two-level hierarchical model, also referredto as a multilevel model, a special case of mixed model. This comparison is only valid forcompletely nested data (not data from crossed or other designs, which can be analyzed withmixed models). Although the website for the HLM software states that it can be used for crosseddesigns, this has not been confirmed. The procedures used in SAS, Stata, R, SPSS, and Mplusbelow are part of their multilevel or mixed model procedures, and can be expanded to non-nesteddata. But for the purposes of this comparison, we will only investigate a fully nested dataset.The code/syntax used for each model is included below for all programs except HLM, which iscompletely run by a GUI. We have provided screen shots of HLM and SPSS for each model. Inaddition, each model is specified in a hierarchical format as well as a mixed format. Althoughthese two expressions of the models are equivalent, some research fields prefer to visualize thehierarchical structure because it is easier to see the separation between levels, while others preferthe mixed format, where it is easier to distinguish between fixed and random effects.Model ConsiderationsWhen adding predictors into the six models discussed in this document, we chose to grandmean center them, meaning that we subtracted the overall mean of that variable from eachsubject’s score. Centering at the grand mean, as opposed to the group mean (where the mean ofeach group is subjected from the score of subjects within that group), will not be appropriate forall models, as discussed in detail by Enders & Tofighi (2007). The choice of which centeringmethod to use should be driven by the specific research question being asked.Another consideration is the method of estimation used by these programs to produce theparameter estimates, either maximum likelihood (ML) or restricted maximum likelihood(REML). Each has its own advantages and disadvantages. ML is better for unbalanced data, butit produces biased results. REML is unbiased, but it cannot be used when comparing two nestedmodels with a likelihood ratio test. Both methods will produce the same estimates for fixedeffects, yet they do differ on the random effect estimates (Albright & Marinova, 2010).As we’ll see in the models discussed below, the two methods produce very similar results, anddo not greatly affect the p-values of the random factors. However, it is important to be awarethat the choice of method can impact the estimate, standard error, and p-values of the random3The Division of Statistics Scientific Computation, The University of Texas at Austin
Two-Level Hierarchical Linear Modelsfactors and could potentially impact the decision of declaring a random factor significant or not.SAS, HLM, R, and SPSS use REML by default, while Stata and Mplus use ML. In the Stataexamples throughout this document, we tell Stata to use REML in order to compare the outputwith the other four programs. However, Mplus does not have such an option, but can only useML, so you will see minor differences in the random variance estimates in the Mplus outputcompared to the other programs throughout this document.Intraclass Correlation CoefficientWe have also reported the intraclass correlation coefficient (ICC), ρ, for each model. The ICC isthe proportion of variance in the outcome variable that is explained by the grouping structure ofthe hierarchical model. It is calculated as a ratio of group-level error variance over the total errorvariance:,whereis the variance of the level-2 residuals andis the variance of the level-1 residuals.In other words, the ICC reports on the amount of variation unexplained by any predictors in themodel that can be attributed to the grouping variable, as compared to the overall unexplainedvariance (within and between variance).Example DatasetThe popular dataset consists of students from different classes and because each student belongsto one unique class, it is a nested design. The dependent variable is Popular, a self-ratedpopularity scale ranging from 0-10. Predictors include Sex (dichotomous) and Extrav(continuous self-rated extraversion score) at the student level and Texp (teacher experience inyears, which is continuous) at the class level.Intercept-only Model (Unconditional Model)Mixed ModelHierarchical ModelThe unconditional mixed model specification resembles a one-factor ANOVA withas theoverall mean andas the class effect. However, we are consideringas a random effect (anormally distributed variable with a mean of zero), not a fixed factor effect as in ANOVA. Thus,we interpret the estimate foras the variance of the mean for each class around the overallmean Popular score.4The Division of Statistics Scientific Computation, The University of Texas at Austin
Two-Level Hierarchical Linear ModelsThe estimate foris the mean of the means of Popular for each class, instead of the mean ofall students in the study. If the data were completely balanced (i.e. same number of students inevery class), then the results of the unconditional model will equal those from an ANOVAprocedure.SAS Resultsproc mixed data popdata covtest;model popular /solution;random intercept /subject class type un;run;Fixed EffectsIntercept ( )Estimate5.078St. Error0.087t-stat58.1p-value 0.001Variance ComponentsResidual ( )Intercept ( )Estimate1.2210.702St. Error0.0400.109z-stat6.4630.8p-value 0.001 0.001The “covtest” option is needed to report the standard errors of the variancecomponent estimates. Also, you need to specify the unstructured covariance matrixtype, which is what HLM and R use by default, and we use here for comparison.The output from SAS is equal to the results in Table 2.1 of Hox’s book. We canconclude that mean Popular score among classes is 5.078, and that there is morevariation within the classes (1.221) than among the different classes (0.702). Thiswill be discussed further when we calculate the ICC for this model.Stata Resultsxtmixed popular class: , variance remlFixed EffectsIntercept ( )Estimate5.078St. Error0.087Variance ComponentsResidual ( )Intercept ( )Estimate1.2210.702St. Error0.0400.109z-stat58.1p-value 0.0015The Division of Statistics Scientific Computation, The University of Texas at Austin
Two-Level Hierarchical Linear ModelsStata’s xtmixed command requires the dependent variable followed by “ ” whichspecifies the separation between the fixed and random variables. We must includethe variance option to see the estimates for the variance components in the output, aswell as the reml option to estimate using restricted maximum likelihood.Also note that Stata does not output the p-values of the random component estimates,but significance can be determined by whether or not zero is contained in theconfidence interval. These results exactly match those from SAS.HLM ResultsFixed EffectsIntercept ( )Estimate5.078St. Error0.087t-stat58.1p-value 0.001Variance ComponentsResidual ( )Intercept ( )Estimate1.2220.702St. Dev.*1.1050.838Chi-square p-value1227.3 0.001HLM reports the standard deviations, not the standard errors, of the variancecomponents. Also, for the random effects, they report the Chi-squared statistic and pvalue for the intercept only. These results equal those from the other programs.R Resultslibrary(lme4)library(languageR)lmer(popular 1 (1 class))pvals.fnc(my intonly)6The Division of Statistics Scientific Computation, The University of Texas at Austin
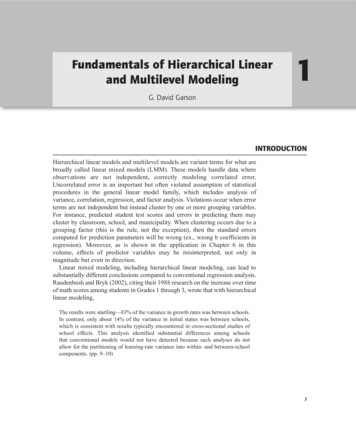
Two-Level Hierarchical Linear ModelsFixed EffectsIntercept ( )Estimate5.078St. Error0.087Variance ComponentsResidual ( )Intercept ( )Estimate1.2210.702St. Dev.*1.1050.838t-stat58.1p-value 0.001R reports the standard deviations of the variance components, like HLM, and thelme4 package reports the t-statistic of the fixed effects. However, the languageRpackage is needed to get the p-values of the fixed effects. These results equal thosefrom the other programs and the book.SPSS ResultsMIXED popular/FIXED SSTYPE(3)/METHOD REML/PRINT G SOLUTION/RANDOM INTERCEPT SUBJECT(class) COVTYPE(UN).Or follow the screen shots below:7The Division of Statistics Scientific Computation, The University of Texas at Austin
Two-Level Hierarchical Linear ModelsFixed EffectsIntercept ( )Estimate5.078St. Error0.087Variance ComponentsResidual ( )Intercept ( )Estimate1.2210.702St. Error0.0400.109t-stat58.1p-value 0.001You need to specify the unstructured covariance type in the “Random” window.These results equal those from the other programs and the book. Note that SPSS,like SAS and Mplus, reports the standard error of the variance components,while HLM and R report the standard deviation. We have not been able toconclude which is more appropriate to report, but the difference does not affect the pvalues for these parameters.8The Division of Statistics Scientific Computation, The University of Texas at Austin
Two-Level Hierarchical Linear ModelsMplus ResultsTITLE: HLM Popular Data - Unconditional ModelDATA: FILE IS C:\popular mplus.csv;VARIABLE: NAMES ARE pupil class extrav sex texp popular popteach ZextravZsex Ztexp Zpopular Zpopteach Cextrav Ctexp Csex;USEVARIABLES ARE class popular;CLUSTER class;ANALYSIS: TYPE twolevel random;MODEL: %WITHIN%%BETWEEN%OUTPUT: sampstat;Fixed EffectsIntercept ( )Estimate5.078St. Error0.087t-stat58.4p-value 0.001Variance ComponentsResidual ( )Intercept ( )Estimate1.2220.695St. Error0.0470.108t-stat26.26.4p-value 0.001 0.001Because this is an unconditional model, we don’t need to specify any WITHIN orBETWEEN variables. The criteria for listing variables in the MODEL statementare below. We’ll see examples of the first three in the following sections:1.2.3.4.%WITHIN% – Level-1 fixed factors (non-random slope)%WITHIN% with latent slope variable – Level-1 random factors%BETWEEN% – Level-2 fixed factorsDon’t specify in either statement – Variables measured at the student levelbut with a Level-1 and Level-2 variance estimate (we’re not sure if/when thiswould be applicable for a multilevel model, and we won’t see this in any ofthe models discussed in this document).The above table shows the results from the “Model Results” section at the bottom ofthe Mplus output. Mplus does report p-values for each estimate, and all estimatesmatch those from the other programs except for the variance estimate of the randomintercept, which differs by about 0.007. This difference is due to the fact that Mplususes ML estimation. Despite this difference, we do not see a change in thesignificance of any variables.9The Division of Statistics Scientific Computation, The University of Texas at Austin
Two-Level Hierarchical Linear ModelsModel SummaryOverall, the six programs produce very similar results for the intercept-only model (with the onlydifferences occurring in the Mplus estimate of the random effect). The only difference is howthey report the precision of the random variance estimates.The ICC for this model is equal to:which tells us that about one-third of the total variation in Popular can be accounted for bywhich class each student is in.Random Intercept with One Fixed Level-1 Factor (Non-Random Slope)Mixed ModelHierarchical ModelThis model has added one student-level fixed factor, Extrav, the self-reported extraversion score.The mixed model looks like an ANCOVA based on class with the covariate Extrav, butremember we still considerto be a random effect, not a fixed effect. Thus, the estimate fordiffers from what would be found by an ANCOVA procedure.In the real application of this data, it does not make sense that Extrav should have a fixed effectinstead of a random effect, since levels of student extraversion should vary by class. However,for the purposes of comparing the four programs, we still want to investigate a case with onestudent-level fixed factor.SAS Resultsproc mixed data popdata covtest;model popular extrav c /solution;random intercept /subject class type un;run;10The Division of Statistics Scientific Computation, The University of Texas at Austin
Two-Level Hierarchical Linear ModelsFixed EffectsIntercept ( )Extraversion ()Variance ComponentsResidual ( )Intercept ( )Estimate5.0780.486St. Error0.0940.020t-stat53.924.1p-value 0.001 0.001Estimate0.9300.841St. Error0.0300.127z-stat30.86.64p-value 0.001 0.001We now have an estimate for the fixed effect of Extrav. For every one unit increasein a student’s reported extraversion score, there is a 0.486 increase in their popularityscore. These results equal those from the other programs which use REML.Stata Resultsxtmixed popular cextrav class: , variance cov(un) remlFixed EffectsIntercept ( )Extraversion ()Variance ComponentsResidual ( )Intercept ( )Estimate5.0780.486St. Error0.0940.020Estimate0.9300.841St. Error0.0300.127z-stat53.924.1p-value 0.001 0.001As we add predictors to the model in Stata, we add the cov(un) option, specifying anunstructured covariance matrix. We placed the centered Extraversion variable beforethe “ ” to indicate that it is a fixed factor (with a non-random slope). These resultsequal those from the other programs.HLM Results11The Division of Statistics Scientific Computation, The University of Texas at Austin
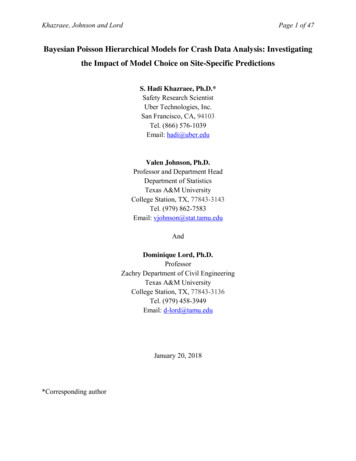
Two-Level Hierarchical Linear ModelsFixed EffectsIntercept ( )Extraversion ()Variance ComponentsResidual ( )Intercept ( )Estimate5.0780.486St. Error0.0940.020t-stat53.924.1p-value 0.001 0.001Estimate0.9300.841St. Dev.*0.9650.917Chi-square p-value1865.7 0.001R Resultsmy 1fixed - lmer(popular 1 c extrav (1 class))pvals.fnc(my 1fixed)Fixed EffectsIntercept ( )Extraversion ()Variance ComponentsResidual ( )Intercept ( )Estimate5.0780.486St. Error0.0940.020Estimate0.9300.841St. Dev.*0.9650.917t-stat53.924.1p-value 0.001 0.001SPSS ResultsMIXED popular WITH Cextrav/FIXED INTERCEPT Cextrav SSTYPE(3)/METHOD REML/PRINT SOLUTION/RANDOM INTERCEPT SUBJECT(class) COVTYPE(UN).12The Division of Statistics Scientific Computation, The University of Texas at Austin
Two-Level Hierarchical Linear ModelsFixed EffectsIntercept ( )Extraversion ()Variance ComponentsResidual ( )Intercept ( )Estimate5.0780.486St. Error0.0940.020Estimate0.9300.841St. Error0.0300.127t-stat53.924.1p-value 0.001 0.001Mplus ResultsTITLE: HLM Popular Data - Unconditional ModelDATA: FILE IS C:\popular mplus.csv;VARIABLE: NAMES ARE pupil class extrav sex texp popular popteach ZextravZsex Ztexp Zpopular Zpopteach Cextrav Ctexp Csex;USEVARIABLES ARE class popular Cextrav;WITHIN Cextrav;CLUSTER class;ANALYSIS: TYPE twolevel random;MODEL: %WITHIN%popular ON Cextrav;%BETWEEN%popular;OUTPUT: sampstat;Fixed EffectsIntercept ( )Extraversion ()Variance ComponentsResidual ( )Intercept ( )Estimate5.0780.486St. Error0.0940.027t-stat54.218.3p-value 0.001 0.001Estimate0.9300.831St. Error0.0280.126t-stat33.56.6p-value 0.001 0.001We now include the centered Extrav variable in the WITHIN option of theVARIABLE statement. We must use the “ON” option for the within-level MODELspecification to tell Mplus that Extrav is a fixed level-1 factor. Again, you can seethat there are minor differences in many of the estimates and standard error of theestimates (and therefore the t-statistics) due to using ML estimation instead of REML.Because the estimate for the variance ofis different than the other programs, theICC reported by Mplus differs from what is reported below.13The Division of Statistics Scientific Computation, The University of Texas at Austin
Two-Level Hierarchical Linear ModelsModel SummaryFor this model, the first five programs have exactly the same results, while the estimates fromMplus are off by very small margins. The ICC for this model is larger than for the unconditionalmodel (as expected, since we are controlling for some student-level variation by adding afixed factor):With one student-level fixed factor, almost one-half of the total variation in Popular can beaccounted for by both the class of the student and the student-level fixed factor Extraversion.Random Intercept and Slope for One Level-1 FactorMixed ModelHierarchical ModelThis model contains a random slope for Extrav, which means that we are allowing the slope ofour regression equation to vary by class. This model is more appropriate than the previousmodel for the variables being used since it is intuitive to assume that extraversion varies fromclass to class.SAS Resultsproc mixed data popdata covtest;model popular extrav c /solution;random intercept extrav c /subject class type un;run;Fixed EffectsIntercept ( )Extraversion ()Variance ComponentsResidual ( )Intercept ( )Extraversion ( )Estimate5.0310.493St. Error0.0970.025t-stat51.919.4p-value 0.001 0.001Estimate0.8950.8920.026St. Error0.0300.1350.009z-stat30.06.62.8p-value 0.001 0.0010.00314The Division of Statistics Scientific Computation, The University of Texas at Austin
Two-Level Hierarchical Linear ModelsThe estimate for the random Extrav slope is significant (p-value of 0.003), andtherefore we would say that the student extraversion scores do vary by class. Theseresults exactly match those from the other programs, except for some smalldiscrepancies in the t-statistics for the fixed effects.Stata Resultsxtmixed popular cextrav class: cextrav, variance cov(un) remlFixed EffectsIntercept ( )Extraversion ()Variance ComponentsResidual ( )Intercept ( )Extraversion ( )Estimate5.0310.493St. Error0.0970.025z-stat51.919.4p-value 0.001 0.001Estimate0.8950.8920.026St. Error0.0300.1350.009Estimate5.0310.493St. Error0.0970.025t-stat52.119.5p-value 0.001 0.001Estimate0.8950.8920.026St. Dev.*0.9460.9440.162Chi-square p-valueHLM ResultsF
SAS, HLM, R, and SPSS use REML by default, while Stata and Mplus use ML. In the Stata examples throughout this document, we tell Stata to use REML in order to compare the output with the other four programs. Howe