Transcription
FRANK FUNDSFRANK VALUE FUNDInvestor Class – FRNKXClass C – FNKCXInstitutional Class – FNKIXWEST HILLS TACTICAL CORE FUND – LEBOXCAMELOT EVENT DRIVEN FUNDClass A - EVDAXInstitutional Class - EVDIXANNUAL REPORTJune 30, 2022
FRANK FUNDSSHAREHOLDER LETTERJUNE 30, 2022 (UNAUDITED)To our Fellow Shareholders,A tumultuous year in financial markets highlighted the unique positioning of Frank FundsTrust in the mutual fund industry. Frank Value Fund, Camelot Event-Driven Fund, andWest Hills Core Fund demonstrated their differentiated strategies and benefits toshareholders over the past fiscal year. Despite inflationary and recessionary conditions onthe horizon, we are optimistic about the future for our Trust and thankful for ourshareholders, employees, and stakeholders.Frank Value Fund Portfolio PerformanceThe Frank Value Fund (“Value Fund”) Institutional Class returned (-5.29%) for the fiscalyear ended June 30, 2022, compared to (-10.62%) for its benchmark, the S&P 500 TotalReturn Index.Frank Capital Partners LLC (FCP) researched and invested in several compellingopportunities in fiscal 2022, thereby removing the Frank Value Fund from a temporarydefensive position. Though most equity valuations are still beyond FCP’s investiblelimits, the dominance of passive and benchmarked strategies has created swaths ofcompelling opportunities in sectors like energy. FCP is pleased to operate outside therealm of indexation because companies outside of the common indices currently offersuperior long-term return expectations.The first half of fiscal 2022 was a late-stage bull market, while in the second half, theS&P 500 declined four months out of six. Several of the Frank Value Fund’s holdingsoutperformed the S&P 500 in fiscal 2022. Specifically, Fund holdings in technology andenergy experienced increases and outperformance relative to the index. Frank Value Fundholdings Twitter (NASDAQ: TWTR) and Civeo (NYSE: CVEO) benefited frompandemic changes in behavior and energy shortages, respectively, appreciating 18% and45% respectively. The Frank Value Fund bought and realized gains on Twitter twiceduring the fiscal year and is no longer invested in the company. Civeo remains acompelling opportunity and the Frank Value Fund has maintained its position.Holdings like Liberty Latin America (NASDAQ: LILA) underperformed in the fiscalyear, losing 43%. Though the company trades at its lowest valuation in its public historyand is producing significant operating cashflow, the Frank Value Fund elected to take thetax-loss and reallocate to companies either benefitting from passive inflows or facilitatingcatalysts like material stock repurchases or high dividends.Frank Capital Partners LLC believes volatility, both upward and downward, will continue toincrease while passive strategies gain market share, and the management company has positionedthe Frank Value Fund to opportunistically invest throughout this expected “fat tail” period.Frank Value Fund Portfolio ManagerBrian FrankAnnual Report 1
FRANK FUNDSSHAREHOLDER LETTER (CONTINUED)JUNE 30, 2022 (UNAUDITED)West Hills Core Fund Portfolio PerformanceThe West Hills Core Fund returned (-6.94%) for the fiscal year ended June 30, 2022,compared to (-10.62%) for the S&P 500 Total Return Index. The 3.68% outperformanceequates to a downside capture ratio relative to the S&P 500 of less than 70%. Sincestrategy change in October 2020, the West Hills Core Fund has returned 14.84%compared to 12.08% for the S&P 500 Toral Return Index: a 2.76% greater return withless market exposure. The West Hills Core Fund hedges risk with listed options byselling out of the money call options and purchasing put options with the proceeds.Following a strong market rally with extremely low volatility in 2021, the equity marketshave experienced a severe reversal with the S&P 500 down nearly 20% for the first halfof calendar 2022. Current risks are many and include: generational high inflation,aggressive Central Bank interest rate hikes to rein in inflation, increased recessionprobability, pressure on equity multiples from the rapidly raising rates, elevatedgeopolitical risks, and the midterm elections. Whether the equity market extends recentdeclines or begins a new bull market, the West Hills Core fund will employ a consistentinvestment strategy of disciplined market exposure hedged with listed options.West Hills Core Fund Portfolio ManagerAlan McClymondsAnnual Report 2
FRANK FUNDSSHAREHOLDER LETTER (CONTINUED)JUNE 30, 2022 (UNAUDITED)Camelot Event Driven Fund Portfolio PerformanceDear investor,The Camelot Event-Driven Fund Institutional Class returned 0.75% for the fiscal yearended June 30, 2022, compared to a loss of (-10.62%) for the S&P 500 Total ReturnIndex.Over that period, major stock market indices around the world experienced significantcorrections due to rising interest rates and, starting late last calendar year, sharply higherenergy costs coupled with geopolitical tensions. The fund was able to withstand thesechallenges due to a combination of the generally less correlated nature of corporateevents, the completion of which is less dependent on the direction of share prices thanmore traditional investment strategies, as well as the use of hedges on individualpositions, in particular in the activist situations substrategy.While high energy costs and rising interest rates dominate economic headlines, neitherhave, so far, had much impact on the fund. Similarly, which M&A activity in the firsthalf of 2022 is lower than in the same period last year, deal volumes are still near recordhighs when compared to a longer horizon. A strong M&A market is important not just forthe fund's merger arbitrage substrategy, but to its other event strategies also becausemergers are a value-realization instrument also for activist investors in breakups and caneven provide liquidity to distressed companies.For most of the fiscal year, the fund concentrated its investments in merger arbitrage,activist situations and distressed securities. SPACs represented 5% and less of theportfolio for most of the year.I thank all of our investors for your continued support and investment and wish you aprosperous year.Camelot Event-Driven Fund Portfolio ManagerThomas KirchnerSincerely,Brian FrankPresident, Portfolio ManagerFrank Funds TrustFrank Value FundAlan McClymondsPortfolio ManagerWest Hills Core FundThomas KirchnerPortfolio ManagerCamelot Event-Driven FundAnnual Report 3
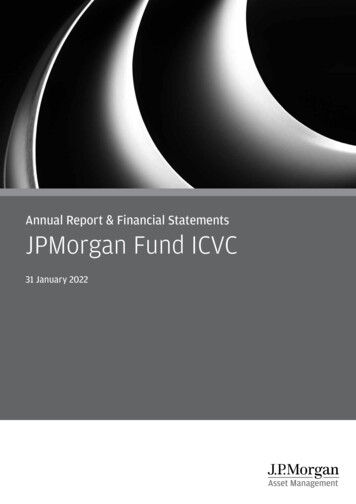
VALUE FUND – INVESTOR CLASSPERFORMANCE ILLUSTRATIONJUNE 30, 2022 (UNAUDITED)FUND/INDEXFrank Value Fund - Investor ClassS&P 500 Total Return 17%12.95%SINCEINCEPTION5.65%9.33%VALUE ASOF 6/30/22 26,802 49,132Cumulative Performance Comparison 10,000 Investment Since InceptionThis chart assumes an initial investment of 10,000 made on 7/21/2004 for the Investor Class(commencement of investment operations). Total return is based on the net change in NAV andassumes reinvestment of all dividends and other distributions. Performance figures represent pastperformance which is not predictive of future performance. Investment return and principal valuewill fluctuate so that your shares, when redeemed, may be worth more or less than their original cost.The Standard & Poor’s 500 Index (“S&P 500”) is a market value-weighted index, representing theaggregate market value of the common equity of 500 stocks primarily traded on the New York StockExchange. The S&P 500 is a widely recognized, unmanaged index of common stock prices. Thefigures for the S&P 500 reflect all dividends reinvested but do not reflect any deductions for fees,expenses or taxes.Per the fee table in the November 1, 2021 Prospectus, the Fund’s total annual operating expenseratio was 1.53% for Investor Class Shares.The returns shown do not reflect taxes that a shareholder would pay on fund distributions or on theredemption of fund shares.Current performance may be lower or higher than the performance data quoted.performance data current to the most recent month end, please call (888)-217-5426.To obtainAnnual Report 4
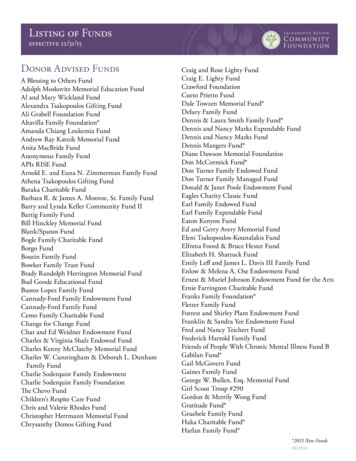
VALUE FUND – CLASS CPERFORMANCE ILLUSTRATIONJUNE 30, 2022 (UNAUDITED)FUND/INDEXFrank Value Fund - Class CS&P 500 Total Return 38%12.95%SINCEINCEPTION5.73%13.07%VALUE ASOF 6/30/22 19,274 42,142Cumulative Performance Comparison 10,000 Investment Since InceptionThis chart assumes an initial investment of 10,000 made on 9/23/2010 for Class C (commencementof investment operations). Total return is based on the net change in NAV and assumes reinvestmentof all dividends and other distributions. Performance figures represent past performance which is notpredictive of future performance. Investment return and principal value will fluctuate so that yourshares, when redeemed, may be worth more or less than their original cost.The Standard & Poor’s 500 Index (“S&P 500”) is a market value-weighted index, representing theaggregate market value of the common equity of 500 stocks primarily traded on the New York StockExchange. The S&P 500 is a widely recognized, unmanaged index of common stock prices. Thefigures for the S&P 500 reflect all dividends reinvested but do not reflect any deductions for fees,expenses or taxes.The returns shown do not reflect taxes that a shareholder would pay on fund distributions or on theredemption of fund shares.Per the fee table in the November 1, 2021 Prospectus, the Fund’s total annual operating expenseratio was 2.28% for Class C Shares.Current performance may be lower or higher than the performance data quoted.performance data current to the most recent month end, please call (888)-217-5426.To obtainAnnual Report 5
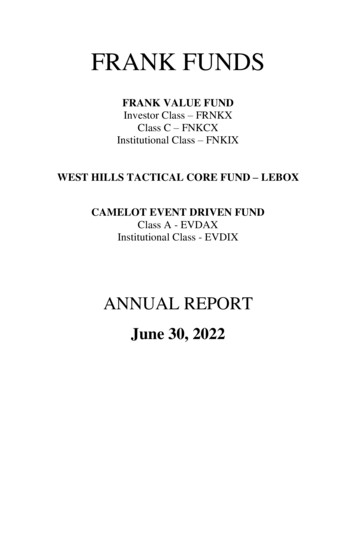
VALUE FUND – INSTITUTIONAL CLASSPERFORMANCE ILLUSTRATIONJUNE 30, 2022 (UNAUDITED)FUND/INDEXFrank Value Fund - Institutional ClassS&P 500 Total Return Index1-YEAR-5.29%-10.62%SINCE5-YEAR 10-YEAR INCEPTION3.12%5.44%6.12%11.30%12.95%12.58%VALUE ASOF 6/30/22 19.989 39,989Cumulative Performance Comparison 10,000 Investment Since InceptionThis chart assumes an initial investment of 10,000 made on 11/03/2010 for the Institutional Class(commencement of investment operations). Total return is based on the net change in NAV andassumes reinvestment of all dividends and other distributions. Performance figures represent pastperformance which is not predictive of future performance. Investment return and principal valuewill fluctuate so that your shares, when redeemed, may be worth more or less than their original cost.The Standard & Poor’s 500 Index (“S&P 500”) is a market value-weighted index, representing theaggregate market value of the common equity of 500 stocks primarily traded on the New York StockExchange. The S&P 500 is a widely recognized, unmanaged index of common stock prices. Thefigures for the S&P 500 reflect all dividends reinvested but do not reflect any deductions for fees,expenses or taxes.Per the fee table in the November 1, 2021 Prospectus, the Fund’s total annual operating expenseratio was 1.28% for Institutional Class Shares.The returns shown do not reflect taxes that a shareholder would pay on fund distributions or on theredemption of fund shares.Current performance may be lower or higher than the performance data quoted.performance data current to the most recent month end, please call (888)-217-5426.To obtainAnnual Report 6
WEST HILLS FUNDPERFORMANCE ILLUSTRATIONJUNE 30, 2022 (UNAUDITED)FUND/INDEXWest Hills Core Fund *S&P 500 Total Return IndexHFRX Equity Market Neutral 5%-1.25%VALUE ASOF 6/30/22 10,385 39,680 8,395Cumulative Performance Comparison 10,000 Investment Since InceptionThis chart assumes an initial investment of 10,000 made on 8/1/2008 (commencement of investment operations). Totalreturn is based on the net change in NAV and assumes reinvestment of all dividends and other distributions. Performancefigures represent past performance which is not predictive of future performance. Investment return and principal valuewill fluctuate so that your shares, when redeemed, may be worth more or less than their original cost.The Standard & Poor’s 500 Index (“S&P 500”) is a market value-weighted index, representing the aggregate market valueof the common equity of 500 stocks primarily traded on the New York Stock Exchange. The S&P 500 is a widelyrecognized, unmanaged index of common stock prices. The figures for the S&P 500 reflect all dividends reinvested but donot reflect any deductions for fees, expenses or taxes.Equity Market Neutral strategies employ sophisticated quantitative techniques of analyzing price data to ascertaininformation about future price movement and relationships between securities, select securities for purchase and sale. Thesecan include both Factor-based and Statistical Arbitrage/Trading strategies. Factor-based investment strategies includestrategies in which the investment thesis is predicated on the systematic analysis of common relationships betweensecurities. In many but not all cases, portfolios are constructed to be neutral to one or multiple variables, such as broaderequity markets in dollar or beta terms, and leverage is frequently employed to enhance the return profile of the positionsidentified. Statistical Arbitrage/Trading strategies consist of strategies in which the investment thesis is predicated onexploiting pricing anomalies which may occur as a function of expected mean reversion inherent in security prices; highfrequency techniques may be employed and trading strategies may also be employed on the basis on technical analysis oropportunistically to exploit new information the investment manager believes has not been fully, completely or accuratelydiscounted into current security prices.Hedge Fund Research, Inc. (HFR) utilizes a UCITSIII compliant methodology to construct the HFRX Hedge Fund Indices.The methodology is based on defined and predetermined rules and objective criteria to select and rebalance components tomaximize representation of the Hedge Fund Universe. HFRX Indices utilize state-of-the-art quantitative techniques andanalysis; multi-level screening, cluster analysis, Monte-Carlo simulations and optimization techniques ensure that eachIndex is a pure representation of its corresponding investment focus.Per the fee table in the November 1, 2021 Prospectus the Fund’s total annual operating expenses ratio was 1.66%.The returns shown do not reflect taxes that a shareholder would pay on fund distributions or on the redemption of fund shares.Current performance may be lower or higher than the performance data quoted. To obtain performance data current to themost recent month end, please call (888)-217-5426.Annual Report 7
CAMELOT FUND - CLASS APERFORMANCE ILLUSTRATIONJUNE 30, 2022 (UNAUDITED)FUND/INDEXCamelot Event Driven Fund –Class A (with load)Camelot Event Driven Fund –Class A (without load)S&P 500 Total Return IndexSINCEINCEPTIONVALUE ASOF 6/30/227.88%6.93% 34,7928.49%12.95%7.25%9.37% 36,808 1.67%11.30%Cumulative Performance Comparison 10,000 Investment Since InceptionThis chart assumes an initial investment of 10,000 made on 11/21/2003 for Class A(commencement of investment operations). Total return is based on the net change in NAV andassumes reinvestment of all dividends and other distributions. Performance figures represent pastperformance which is not predictive of future performance. Investment return and principal valuewill fluctuate so that your shares, when redeemed, may be worth more or less than their original cost.The Standard & Poor’s 500 Index (“S&P 500”) is a market value-weighted index, representing theaggregate market value of the common equity of 500 stocks primarily traded on the New York StockExchange. The S&P 500 is a widely recognized, unmanaged index of common stock prices. Thefigures for the S&P 500 reflect all dividends reinvested but do not reflect any deductions for fees,expenses or taxes.The returns shown do not reflect taxes that a shareholder would pay on fund distributions or on theredemption of fund shares.Class A shares of the Fund have a maximum sales charge of 5.50%.Per the fee table in the November 1, 2021 Prospectus the Fund’s total annual operating expensesratio was 2.65%. The Adviser has contractually agreed to limit its fees and reimburse expenses,subject to certain limitations, until at least October 31, 2022. After waiver the Fund’s net expenseratio in the November 1, 2021 Prospectus was 2.04%.Current performance may be lower or higher than the performance data quoted.performance data current to the most recent month end, please call (866) 706-9790.To obtainAnnual Report 8
CAMELOT FUND - INSTITUTIONAL CLASSPERFORMANCE ILLUSTRATIONJUNE 30, 2022 (UNAUDITED)FUND/INDEXCamelot Event Driven Fund –Institutional ClassS&P 500 Total Return Index1-YEARSINCE5-YEAR 10-YEAR 3.43%VALUE ASOF 6/30/22 23,269 45,785Cumulative Performance Comparison 10,000 Investment Since InceptionThis chart assumes an initial investment of 10,000 made on 06/07/2010 for the Institutional Class(commencement of investment operations). Total return is based on the net change in NAV andassumes reinvestment of all dividends and other distributions. Performance figures represent pastperformance which is not predictive of future performance. Investment return and principal valuewill fluctuate so that your shares, when redeemed, may be worth more or less than their original cost.The Standard & Poor’s 500 Index (“S&P 500”) is a market value-weighted index, representing theaggregate market value of the common equity of 500 stocks primarily traded on the New York StockExchange. The S&P 500 is a widely recognized, unmanaged index of common stock prices. Thefigures for the S&P 500 reflect all dividends reinvested but do not reflect any deductions for fees,expenses or taxes.Per the fee table in the November 1, 2021 Prospectus the Fund’s total annual operating expensesratio was 2.39%. The Adviser has contractually agreed to limit its fees and reimburse expenses,subject to certain limitations, until at least October 31, 2022. After waiver the Fund’s net expenseratio in the November 1, 2021 Prospectus was 1.79%.The returns shown do not reflect taxes that a shareholder would pay on fund distributions or on theredemption of fund shares.Current performance may be lower or higher than the performance data quoted.performance data current to the most recent month end, please call (866) 706-9790.To obtainAnnual Report 9
VALUE FUNDPORTFOLIO ANALYSISJUNE 30, 2022 (UNAUDITED)The following chart gives a visual breakdown of the Frank Value Fund (the “ValueFund”) by the industry sectors, while the underlying securities represent a percentage ofthe portfolio of investments.Sectors are based on Morningstar classifications.Portfolio composition subject to change.A n n u a l R e p o r t 10
WEST HILLS FUNDPORTFOLIO ANALYSISJUNE 30, 2022 (UNAUDITED)The following chart gives a visual breakdown of the West Hills Core Fund (the “WestHills Fund”) by the industry sectors or investment type, while the underlying securitiesrepresent a percentage of the portfolio of investments.Sectors are based on Morningstar classifications.Portfolio composition subject to change.Excludes written options.A n n u a l R e p o r t 11
CAMELOT FUNDPORTFOLIO ANALYSISJUNE 30, 2022 (UNAUDITED)The following chart gives a visual breakdown of the Camelot Event Driven Fund (the“Camelot Fund”) by the industry sectors or investment type, while the underlyingsecurities represent a percentage of the portfolio of investments.Categorizations above are made using Morningstar classifications.Portfolio composition is subject to change.Excludes written options.A n n u a l R e p o r t 12
VALUE FUNDSCHEDULE OF INVESTMENTSJUNE 30, 2022SharesFair ValueCOMMON STOCKS - 76.69%Apparel & Other Finished Prods of Fabrics & Similar Material - 2.23%45,569Under Armour, Inc. Class C *Bottled & Canned Soft Drinks & Carbonated Waters - 5.36%15,015Coca-Cola FEMSA S.A.B de C.V. Series L ADRCigarettes - 8.19%11,300Altria Group, Inc.8,081Philip Morris International, Inc. 345,413830,029472,001797,9181,269,919Electric & Other Services Combined - 4.40%68,289PG&E Corp.681,524Hotels, Rooming Houses, Camps & Other Lodging Places - 2.80%16,801Civeo Corp. *434,642Oil & Gas Field Services - 4.19%68,275Nextier Oilfield Solutions, Inc. *649,295Oil & Gas Filed Machinery & Equipment - 6.57%14,609Dril-Quip, Inc. *65,570Now, Inc. *Petroleum Refining - 10.20%53,665Calumet Specialty Products Partners, L.P. *20,972CVR Energy, Inc.2,199Delek US Holdings, Inc. *25,000Vertex Energy, Inc. *Services-Business Services - 8.10%11,529Ebay, Inc.11,086PayPal Holdings, Inc. *Services-Computer Processing & Data Preparation - 2.06%214,580Trivago N.V. ADR *Services-Personal Services - 7.54%33,096H&R Block, Inc.Services-Prepackaged Software - 2.70%94,743Opera Ltd. (Norway) 17,817The accompanying notes are an integral part of these financial statements.A n n u a l R e p o r t 13
VALUE FUNDSCHEDULE OF INVESTMENTS (CONTINUED)JUNE 30, 2022SharesFair ValueServices-To Dwellings & Other Buildings - 2.01%3,500Airbnb, Inc. Class A * 311,780Steel Works, Blast Furnaces & Rolling Mills - 2.81%48,500Algoma Steel Group, Inc. (Canada)435,530Travel Services - 4.28%20,685lastminute.com N.V. (Switzerland) *663,122Wholesale-Drugs, Proprietaries & Druggists' Sundries - 3.25%9,624Cardinal Health, Inc.503,047TOTAL FOR COMMON STOCKS (Cost 10,948,522) - 76.69%11,883,602EXCHANGE TRADED FUND - 4.45%6,000iShares 20 Year Treasury Bond ETFTOTAL FOR EXCHANGE TRADED FUND (Cost 697,990) - 4.45%MONEY MARKET FUND - 18.91%2,929,455Morgan Stanley Institutional Liquidity Funds - Treasury Portfolio 1.32% **TOTAL FOR MONEY MARKET FUND (Cost 2,929,455) - 18.91%TOTAL INVESTMENTS (Cost 14,575,967) *** - 100.05%LIABILITIES IN EXCESS OF ASSETS, NET - (0.05%)NET ASSETS - 7,458) 15,494,819* Non-income producing securities during the period.** Variable rate security; the coupon rate shown represents the yield at June 30, 2022.*** Refer to Note 11 for tax cost.ETF - Exchange Traded FundsADR - American Depositary Receipt.The accompanying notes are an integral part of these financial statements.A n n u a l R e p o r t 14
WEST HILLS FUNDSCHEDULE OF INVESTMENTSJUNE 30, 2022SharesFair ValueEXCHANGE TRADED FUND - 93.90%14,815SPDR S&P 500 ETF Trust (a)TOTAL FOR EXCHANGE TRADED FUND (Cost 5,868,052) - 93.90% 5,588,9595,588,959MONEY MARKET FUND - 0.72%42,792Morgan Stanley Institutional Liquidity Funds - Treasury Securities Portfolio 1.01% **TOTAL FOR MONEY MARKET FUND (Cost 42,792) - 0.72%42,79242,792INVESTMENTS IN PURCHASED OPTIONS, AT VALUE(Premiums Paid 103,017) - 1.41%84,006TOTAL INVESTMENTS (Cost 6,013,861) *** - 96.03%5,715,757INVESTMENTS IN WRITTEN OPTIONS, AT VALUE(Premiums Received 57,743) - (0.62%)(37,254)ASSETS IN EXCESS OF LIABILITIES, NET - 4.59%273,361NET ASSETS - 100.00% 5,951,864(a) Subject to written option contracts.** Variable rate security; the coupon rate shown represents the yield at June 30, 2022.*** Refer to Note 11 for tax cost.The accompanying notes are an integral part of these financial statements.A n n u a l R e p o r t 15
WEST HILLS FUNDSCHEDULE OF PURCHASED OPTIONSJUNE 30, 2022PUT OPTIONS - 1.41% *Underlying SecurityCounterpartyNotionalContracts Amount**SPDR S&P 500 ETF TrustInteractive Brokers6SPDR S&P 500 ETF TrustInteractive BrokersSPDR S&P 500 ETF Trust ExercisePriceFairValueExpiration234,000 390.0012469,200391.007/22/202219,068Interactive Brokers6219,600366.007/29/20224,482SPDR S&P 500 ETF TrustInteractive Brokers6231,000385.007/29/20228,718SPDR S&P 500 ETF TrustInteractive Brokers12442,800369.008/5/202211,448SPDR S&P 500 ETF TrustInteractive Brokers12470,400392.007/15/202221,036SPDR S&P 500 ETF TrustInteractive Brokers12438,000365.008/12/202210,764Total Put Options (Premiums Paid 103,017) - 1.41%TOTAL PURCHASED OPTIONS (Premiums Paid 103,017) - 1.41%7/8/2022 8,490 84,006 84,006* Non-income producing securities during the period.**The notional amount is calculated by multiplying outstanding contracts by the exercise price at June 30, 2022. Each option contract allows the holder of the option to purchase or sell 100 shares of the underlying security.ETF - Exchange Traded FundsThe accompanying notes are an integral part of these financial statements.A n n u a l R e p o r t 16
WEST HILLS FUNDSCHEDULE OF WRITTEN OPTIONSJUNE 30, 2022CALL OPTIONS - (0.25)% *Underlying SecurityCounterpartyContracts SPDR S&P 500 ETF TrustInteractive Brokers(24)SPDR S&P 500 ETF TrustInteractive BrokersSPDR S&P 500 ETF TrustNotionalAmount** ExercisePriceExpiration Fair Value(960,000) 400.007/15/2022 ive Brokers(24)(991,200)413.007/29/2022(1,776)SPDR S&P 500 ETF TrustInteractive Brokers(24)(984,000)410.008/5/2022(3,576)SPDR S&P 500 ETF TrustInteractive Brokers(24)(972,000)405.008/12/2022(6,576)Total Call Options (Premiums Received 28,557) - (0.25)% (15,264)PUT OPTIONS - (0.37)% *Underlying SecurityCounterpartyContracts SPDR S&P 500 ETF TrustInteractive Brokers(12)SPDR S&P 500 ETF TrustInteractive BrokersSPDR S&P 500 ETF TrustNotionalAmount** ExercisePriceExpiration Fair Value(438,000) 365.00(6)(216,000)360.007/8/2022(708)Interactive Brokers(6)(201,600)336.007/29/2022(1,044)SPDR S&P 500 ETF TrustInteractive Brokers(6)(213,000)355.007/29/2022(2,634)SPDR S&P 500 ETF TrustInteractive Brokers(12)(434,400)362.007/15/2022(4,032)SPDR S&P 500 ETF TrustInteractive Brokers(12)(408,000)340.008/5/2022(3,372)SPDR S&P 500 ETF TrustInteractive Brokers(12)(402,000)335.008/12/2022(3,408)Total Put Options (Premiums Received 29,186) - (0.37)%TOTAL WRITTEN OPTIONS (Premiums Received 57,743) - (0.62)%7/22/2022 (6,792) (21,990) (37,254)* Non-income producing securities during the period.**The notional amount is calculated by multiplying outstanding contracts by the exercise price at June 30, 2022. Each option contract allows the holder of the option to purchase or sell 100 shares of the underlying security.ETF - Exchange Traded FundsThe accompanying notes are an integral part of these financial statements.A n n u a l R e p o r t 17
CAMELOT FUNDSCHEDULE OF INVESTMENTSJUNE 30, 2022SharesFair ValueCOMMON STOCKS - 72.85%Automotive - 0.00%5,926Exide Technologies †101,663Flyht Aerospace Solutions, Inc. (Canada) † * -Bakery Products - 0.60%479,411Bab, Inc.419,485Beverages - 0.46%6,000Anheuser-Busch InBev SA/NV ADR323,700Biotech & Pharma - 0.00%167,850Inyx, Inc. *Canned, Frozen & Preservd Fruit, Veg & Food Specialties - 4.19%70,000TreeHouse Foods, Inc. (a)172,927,400Communication Services - 0.24%4,675Intelsat Emergence SA (Luxembourg) 168,627Computer & Office Equipment - 0.81%4,000International Business Machines Corp. (a)564,760Construction & Engineering - 0.06%25,935WeBuild SpA ADR40,206Deep Sea Foreign Transportation of Freight - 0.31%76,000Teekay Corp. (Bermuda) *218,880Drug Manufacturers - General - 0.26%3,000Bayer AG (Germany)177,840Electric & Other Services Combines - 6.92%12,000Duke Energy Corp. (a) (b)47,000Evergy, Inc. (b)10,000PNM Resources, Inc.Electrical Industrial Apparatus - 0.42%20,000Hollysys Automation Technologies, Ltd. (China)Federal & Federally-Sponsored Credit Agencies - 0.06%100,000Federal National Mortgage Association Fannie Mae od & Kindred Products - 0.49%10,000Conagra Brands, Inc.342,400Gaming, Lodging & Restaurants - 0.14%10,000Guoco Group Ltd. (Bermuda)100,797The accompanying notes are an integral part of these financial statements.A n n u a l R e p o r t 18
CAMELOT FUNDSCHEDULE OF INVESTMENTS (CONTINUED)JUNE 30, 2022SharesGold and Silver Ores - 2.48%22,000Agnico Eagle Mines Ltd. (Canada) (a)15,000Barrick Gold Corp. (Canada) (a)50,000Gold Fields Ltd. ADR (a)Grain Mill Products - 1.18%10,000Post Holdings, Inc. (a) *Guided Missiles & Space Vehicles & Parts - 1.86%32,000Aerojet Rocketdyne Holdings, Inc. (a) *Fair Value tels & Motels - 0.42%10,000MGM Resorts International289,500Hotels, Rooming Houses, Camps & Other Lodging Places - 0.41%8,000Hilton Grand Vacations, Inc. (a) *285,840Industrial Inorganic Chemicals - 1.32%55,000Tronox Holdings PLC (a)924,000Industrial Organic Chemicals - 1.19%7,000International Flavors & Fragrances, Inc. (a) (b)833,840Industrial Products - 2.81%3,200Gates Industrial Corp. PLC *30,000Mercury Systems, Inc. (a) *Industrial Services - 1.18%1,022,580Astaldi SpA SPF (Italy) †60,000JetBlue Airways Corp. *4,000Ryanair Holdings PLC ADR (a) *Insurance Agents. Brokers & Services - 1.98%7,000Willis Towers Watson PLC (United Kingdom) (a)Internet Content & Information - 0.11%1,500Scout24 SE ADRInvestment Advice - 2.61%39,000KKR & Co., Inc. Class A (a)600TPG, Inc. Class AInvestment Companies - 4.76%3,700Agile Growth Corp. Class A *4,400Ahren Acquisition Corp. (Cayman Islands) *5,000AIB Acquisition Corp. 00050,900The accompanying notes are an integral part of these financial statements.A n n u a l R e p o r t 19
CAMELOT FUNDSCHEDULE OF INVESTMENTS (CONTINUED)JUNE 30, 2022SharesFair ValueInvestment Companies - 4.76% (continued)30,000Aurora Technology Acquisition Corp. *10,000Blue World Acquisition Corp *13,000BYTE Acquisition Corp. Class A *14,300Corazon Capital V838 Monoceros Corp. Class A *4,800Disruptive Acquisition Corp. I Class A *6,400FTAC Hera Acquisition Corp. Class A *5,000G3 VRM Acquisition Corp. Clas
the Frank Value Fund to opportunistically invest throughout this expected "fat tail" period. Frank Value Fund Portfolio Manager Brian Frank . FRANK FUNDS SHAREHOLDER LETTER (CONTINUED) . aggressive Central Bank interest rate hikes to rein in inflation, increased recession . (Loss) on Securities (Realized and Unrealized) 0.23 (h) 7.97 (0 .