Transcription
UNIVERSITY OF CALIFORNIAOffice of the Chief Investment OfficerUC Retirement Savings ProgramInvestment Performance and Program Review as of March 31, 2017Growing Portfolios Building PartnershipsUC Investments
Table of ContentsPlan, People, IndustryPerformance Review Q1 2017- Target Date Fund (Pathway)- Core Lineup2017 Lineup ChangesAppendix2
Plan, People, Industry3
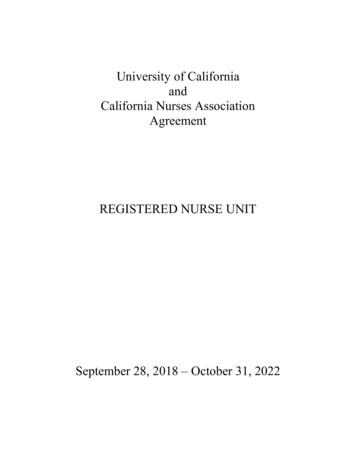
UC Retirement Savings Program at a GlanceUC Retirement Savings ProgramDeliver the best in class DC plan focused on participant outcomes through superior performance and cost managementUC Retirement Savings Program Facts 21.7 billion across 3 plans Established in 1967 311,737 Participants 21.7 billion in assets 21.7B 3 Plans: 403(b), 457(b), DC Plan 2nd largest public DC plan in the US Largest 403(b) plan in the US Target Date Fund (Pathway) default since 2014 6.1 billion in Target Date Funds UC Savings: 4.2 billion; UC Global Fund: 4.4 billionAs of March 31, 2017Tax Deferred 403(b) Plan: 15.2B70%457(b) Deferred Compensation Plan: 2.4B11%Defined Contribution Plan: 4.1B19%4
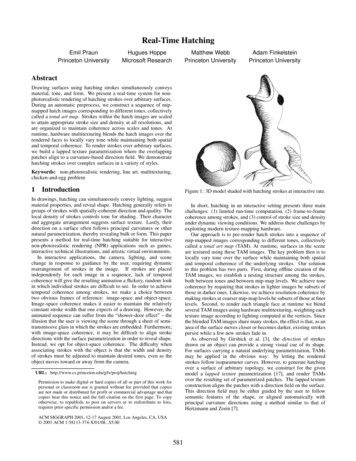
UC Retirement Savings Program EvolutionUCRSP Assets and Evolution 1967-20172015Lineupstreamlined from64 to 16 funds20173rd Partymanager mlined2004457(b) Planadded1986Divests fromSouth Africa1994Added FidelityMutual Funds1967Plan InceptionAs of March 31, 20175
UCRSP reflects industry best practicesChoice of DefaultNumber of InvestmentChoicesCore optionsimplementationpreferencesNumber of plans with abrokerage window“All-In” Fees1.2.3.4.Defined Contribution Trends, Callan, 2016Ready, Set, Retire, Towers Watson, 2015Plan Sponsor Survey, AonHewitt, 2015Defined Contribution Survey, NEPC, 2016Industry AverageUCRSPUC AlignmentTarget date fund (TDF): 75%1Target Date Fund: Pathway 10-19 options216 Investment Choices Blend of active and index funds: 79%Blend of active and passive 40%3BrokerageLink Median Plan (asset weighted): 49bps414 bps 6
Largest Investment Choices by AUMMarch 31, 2016March 31, 2017Target Date Fund Series 5.3B 6.1BUC Savings Fund 4.2B 4.2BUC Global Fund 4.0B 4.4BUC Balanced Growth Fund 1.5B 1.6BUC Bond Fund 1.1B 1.2BBrokerage Window 1.2B 1.4B11 funds ranging from Pathway Income to Pathway 2060A short duration bond portfolioA 100% equity fund of 85% U.S. and 15% International stocksA fund with an equity and fixed income blendA diversified core fixed income fundA platform allowing participants to choose their own funds7
Investment Options at a GlanceTARGET DATE FUNDS - 6.1 billionUC Pathway FundsUC Pathway Income FundUC Pathway Fund 2015UC Pathway Fund 2020UC Pathway Fund 2025UC Pathway Fund 2030UC Pathway Fund 2035UC Pathway Fund 2040UC Pathway Fund 2045UC Pathway Fund 2050UC Pathway Fund 2055UC Pathway Fund 2060CORE FUNDS - 14.2 billionBond and Stock InvestmentsBond InvestmentsShort-TermUC Savings FundIntermediate-TermUC Bond FundInflation-ProtectedUC Short Term TIPS FundUC TIPS FundDomestic StockLarge CapUC Domestic Equity Index FundFidelity Growth Company FundSmall CapVanguard Small Cap Equity FundBalanced FundsUC Balanced Growth FundForeign StockDeveloped MarketsUC International Equity Index FundFidelity Diversified International FundUC Global FundEmerging MarketsDFA Emerging Markets Equity FundSpecialty StockVanguard REIT FundVanguard Social Equity FundBROKERAGE WINDOW - 1.4 billionFidelity BROKERAGELINK As of March 31, 20178
Defined Contribution TeamArthur Guimaraes, CPA, CBVChief Operating Officer &DC Product Manager Joined University of California in 2014Led UC glide path review and fund rationalization in 201510 year career in pension management in the US and CanadaMost recently, Vice President, Alberta Investment Management Co.Previously, senior member of Group Savings & Retirement team at ManulifeMarco Merz, CFADirector of DefinedContribution Joined University of California in 201610 year career at BlackRockMost recently Senior Strategist for Defined ContributionFocus on Target Date Fund & Core lineup implementationFrequent speaker at DC Industry conferences including P&I, II and IMCA9
Target Date Fund - Pathway
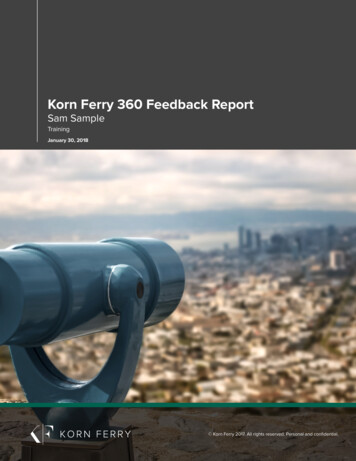
Pathway – Our Target Date FundDesigned to support participants’ spending throughout retirementLongShortTime HorizonPathway 2060Pathway 2055Pathway 2050Pathway Key Features An equity landing point of 30% with static allocations at andthrough retirementPathway 2045 Focus on diversification with broad asset class exposuresPathway 2040 Utilizes a strategic glidepath to help mitigate the risksassociated with market timingPathway 2035Pathway 2030Key Benefits for ParticipantsU.S. Large Cap EquityU.S. Small/Mid Cap EquityPathway 2025International Equity Constructed to navigate the major sources of uncertaintyparticipants faceEmerging Market EquityReal EstatePathway 2020U.S. Bonds/Short Term Seeks to reduce volatility in an effort to keep participantssaving and investing across market cyclesU.S. TIPSdHigher Continuous research to anticipate, assess and adapt ahead ofevolving conditions to help meet participant needs now and inthe futurePathway IncomeInvestment RiskLower11
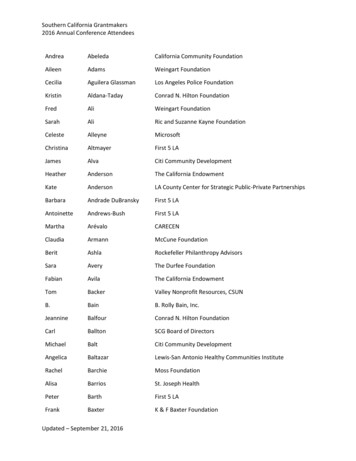
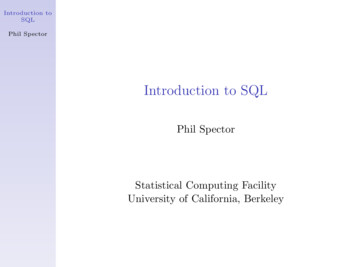
Pathway GlidepathPathway Target Date Fund vs. Top 3 TDF providersEquity/Equity-Like Allocation100%80%60%40%20%Years Until 0%90%83%76%68%60%50%30%T. Rowe 0%90%90%90%90%84%70%61%55%24%Pathway old90%85%80%70%65%55%49%40%22%20%20%As of March 31, 201712
Pathway Performance - SummaryQ1 2017 performance relative to policy benchmarksNet of fee returns 2050Pathway2055Pathway2060Fund Policy Benchmark Value ne year performance relative to policy benchmarksNet of fee returns (%) - thway2045Pathway2050Pathway2055Pathway2060Fund 1015.07Policy Benchmark 0415.04Value As of March 31, 201713
Core Lineup
Core Lineup Assets - DetailsCORE FUNDS - 14,184Bond and Stock InvestmentsBond Investments - 5,575Domestic Stock - 1,627Foreign/Global Stock - 4,873Short-TermUC Savings Fund - 4,165Large CapUC Domestic Equity Index Fund - 610Fidelity Growth Company Fund - 576Developed MarketsUC International Equity Index Fund - 231Fidelity Diversified International Fund - 113Small CapVanguard Small Cap Equity Fund - 441Global MarketsUC Global Fund - 4,362Balanced Funds - 1,579Emerging MarketsDFA Emerging Markets Equity Fund - 167Intermediate-TermUC Bond Fund - 1,154Inflation-ProtectedUC Short Term TIPS Fund - 34UC TIPS Fund - 222UC Balanced Growth Fund - 1,579Specialty Stock - 529Vanguard REIT Fund - 232Vanguard Social Equity Fund - 297Market Value in MillionsAs of March 31, 201715
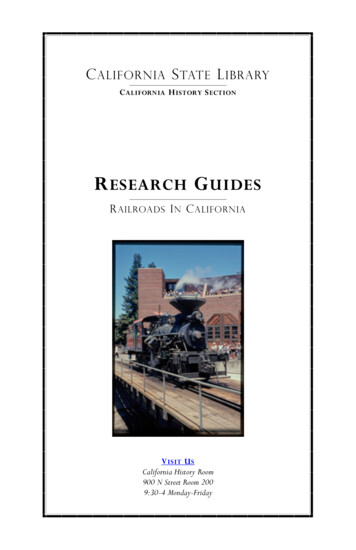
Core Line-Up Performance - SummaryAnnualized Total Return (%)Balanced FundUC Ba l a nced Growth FundUS Large EquityUC Domes ti c Equi ty Index FundVa ngua rd FTSE Soci a l Index FundUS Small/Mid Cap EquityVa ngua rd Sma l l Ca p Index FundGlobal/World ex-US EquityUC Gl oba l Equi ty FundUC Interna ti ona l Equi ty Index FundCapital PreservationUC Sa vi ngs FundInflation SensitiveUC Short Term TIPS FundUC TIPS FundDiversified Fixed IncomeUC Bond FundNew Large EquityFi del i ty Growth Compa ny FundWorld ex-US EquityFi del i ty Di vers i fi ed Intl . FundDFA Emergi ng Ma rkets Portfol i oReal EstateVa ngua rd REITS Index FundTotal:As of March 31, 2017Market Value ( M) 1,579% of Plan7.28%3 Months5.36One Year10.71Three Year4.64Five Year7.10Ten Year5.43 6102.82%5.6918.119.7513.297.62 2971.37%7.1119.1010.5314.576.82 4412.03%3.7521.547.4412.92 4,36220.12%5.7517.098.2712.076.67 2311.07%6.9312.300.555.711.45 4,16519.21%0.351.391.201.162.10 340.16%0.371.720.74 2221.02%1.332.012.411.304.64 1,1545.32%0.951.242.962.844.54 5762.66%10.2824.0112.0414.1911.09 1130.52%7.967.081.516.611.77 1670.77%13.0217.611.681.27 2321.07%0.963.099.969.75 14,18465.4%16
2017 Lineup changes
2017 lineup changesOverview of ChangesImplementation DateI.Eliminated Calvert Fund – moved assets to Vanguard Social Fund2/28/2017II.Repackaging of Fidelity and DFA funds9/30/2017III.Renaming of 3 Vanguard funds9/30/2017IV.Eliminating the UC Balanced Growth and UC Global funds9/30/2017V.Hire 3rd party manager for Pathway12/31/201718
Appendix: Detailed Performance
Target Date Funds Performance - DetailsAnnualized Total Return (%)Target Date FundsMarket Value ( M)% of Plan3 MonthsOne YearThree YearFive YearTen YearUC Pa thwa y Income Fund 5772.66%Pol i cy Benchma rkValue AddedUC Pa thwa y Fund 423.502.860.64 370.40-Pol i cy Benchma rkValue AddedUC Pa thwa y Fund 2020 1,0905.03%Pol i cy Benchma rkValue AddedUC Pa thwa y Fund 353.633.210.42 400.31-Pol i cy Benchma rkValue AddedUC Pa thwa y Fund 2030 9664.46%Pol i cy Benchma rkValue AddedUC Pa thwa y Fund 0.303.623.230.39 5.520.29-Pol i cy Benchma rkValue AddedAs of March 31, 201720
Target Date Funds Performance - DetailsAnnualized Total Return (%)Target Date FundsUC Pa thwa y Fund 2040Pol i cy Benchma rkValue AddedUC Pa thwa y Fund 2045Pol i cy Benchma rkValue AddedUC Pa thwa y Fund 2050Pol i cy Benchma rkValue AddedUC Pa thwa y Fund 2055Pol i cy Benchma rkValue AddedUC Pa thwa y Fund 2060Pol i cy Benchma rkValue AddedAs of March 31, 2017Market Value ( M)% of Plan3 MonthsOne YearThree YearFive YearTen Year 6.050.293.973.600.37 6.580.28- 27.050.274.173.840.33 17.760.25- 1410.65%21
Core Lineup Performance - DetailsAnnualized Total Return (%)Balanced FundUC Ba l a nced Growth FundPol i cy Benchma rkMarket Value ( M)% of Plan3 MonthsOne YearThree YearFive YearTen Year 106.950.155.434.970.46 913.140.157.627.410.21 514.5714.67-0.106.826.93-0.11 212.870.058.13-Value AddedUS Large EquityUC Domes ti c Equi ty Index FundRus s el l 3000 TF IndexValue AddedVa ngua rd FTSE Soci a l Index FundSpl i ced Soci a l IndexValue AddedUS Small/Mid Cap EquityVa ngua rd Sma l l Ca p Index FundCRSP Sma l l Ca p IndexValue AddedGlobal/World ex-US EquityUC Gl oba l Equi ty FundPol i cy Benchma rkValue AddedUC Interna ti ona l Equi ty Index FundMSCI Worl d ex-US TF IndexValue AddedAs of March 31, 2017 2.0711.920.156.676.510.16 5.380.331.451.130.3222
Core Lineup Performance - DetailsAnnualized Total Return (%)Capital PreservationMarket Value ( M)% of Plan3 MonthsOne YearThree YearFive YearTen 1.097.513.58 5.990.621.771.210.56 99.759.82-0.07-UC Sa vi ngs Fund 4,165Two-Yea r U.S. Trea s ury Notes Income ReturnValue AddedInflation SensitiveUC Short Term TIPS FundBa rcl a ys 1-3 Yea r U.S. TIPS IndexValue AddedUC TIPS Fund 34 222Ba rcl a ys US TIPS IndexValue AddedDiversified Fixed IncomeUC Bond Fund 1,154Ba rcl a ys Aggrega te Fi xed Income Benchma rkValue AddedNew Large EquityFi del i ty Growth Compa ny Fund 576S&P 500 IndexValue AddedWorld ex-US EquityFi del i ty Di vers i fi ed Intl . FundMSCI EAFEValue AddedDFA Emergi ng Ma rkets Portfol i oMSCI Emergi ng Ma rkets IndexValue AddedReal EstateVa ngua rd REITS Index FundREIT Spl i ced IndexValue AddedAs of March 31, 2017 2320.16%1.02%1.07%23
UC Pathway Funds . UC Pathway Income Fund UC Pathway Fund 2015 UC Pathway Fund 2020 UC Pathway Fund 2025 . UC Pathway Fund 2030 UC Pathway Fund 2035 UC Pathway Fund 2040 UC Pathway Fund 2045 . UC Pathway Fund 2050 UC Pathway Fund 2055 UC Pathway Fund 2060 . CORE FUNDS - 14.2 billionFile Size: 414KB