Transcription
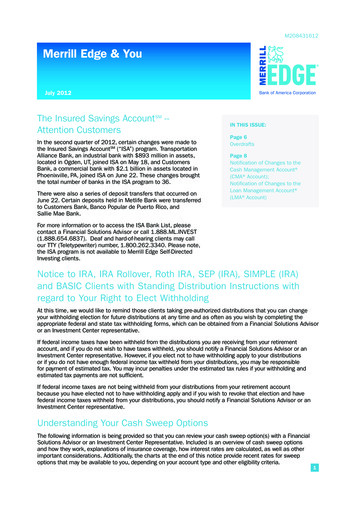
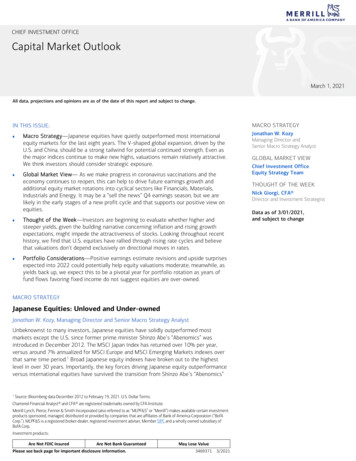
NewMark MerrillC O M PA N I E SWhen you love shopping centers it shows.West HillsShoppingCenterNORTHWEST CORNER OF SATICOY STREET & WOODLAKE AVENUE, WEST HILLS, CAHAPPY DOGS GROOMINGProject Size: 55,151 of Retail SpaceDemographicsSitePopulation*1 Mile.18,2143 Miles.148,823Household Income*1 Mile. 133,5843 Miles. 104,187Traffic Count*Intersection.16,516For additional information,please contact:Greg 640)For Lease - Retails Spaces Available Nestled in the West Hills neighborhood. Close proximity to West Hills Medical Adjacent to Chaminade College Preparatory School Ample parking.with 1,350 students.Center.Estimates are based on 2018 demographics for population and average income per household. Traffic count is based upon ESRI forecasts.The information contained herein is not guaranteed and should be independently verified.Tel: (818) 710-6100Fax: (818) 710-61165850 Canoga AvenueSuite 650Woodland Hills, CA 91367www.newmarkmerrill.com
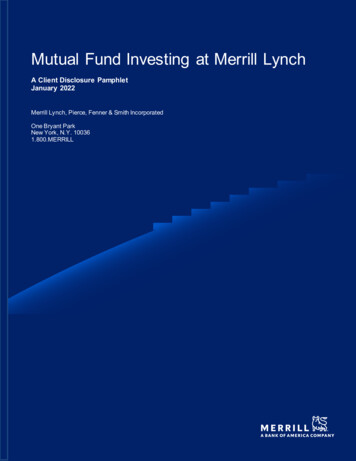
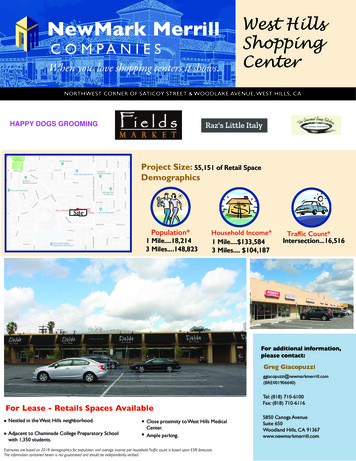
NewMark MerrillC O M PA N I E SWhen you love shopping centers it shows.West HillsShoppingCenterNORTHWEST CORNER OF SATICOY STREET & WOODLAKE AVENUE, WEST HILLS, CACapistranoAvenueElementaryJustice StreetAcademy ntsSiteWest HillsMedical Center350 Single Family Homes200 Multi-Family HomesUpon CompletionFor additional information,please contact:Greg 640)Tel: (818) 710-6100Fax: (818) 710-61165850 Canoga AvenueSuite 650Woodland Hills, CA 91367www.newmarkmerrill.comThe information contained herein is not guaranteed and should be independently verified. While we do notdoubt its accuracy, we have not verified it and make no guarantee, warranty or representation about it.
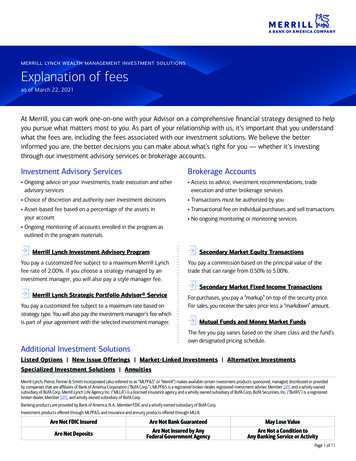
West Hills Shopping Center#111#112#113#231#229HAPPY DOGSGROOMING#621Liquor Deli#217#221Service StationSaticoy StreetFor Information, Please ContactGreg Gicopuzzi (BRE#01906640)NewMark Merrill CompaniesTel: 818.710.6100Fax: 818.710.6116proposed and may not actuallyWoodlake Avenue#110Function First Fitness#109#116The Gourmet Soup Kitchen#107-108#115Available 1,350 SF#106#625Chaminade CollegePrepChaminade CollegePrep#105#114West Hills CleanersPhysical Therapy#104Potential 1,138 SFRaz’s Little ItalyGolden Perform.Arts Center #103#629Del Court Ins.Available Available2,270 SF 2,270 SFWest Hills MassageTherapyPet Med CenterWest Hills #102Melito’sBarber ShopCutting Edge Karate#101Golden PerformingArts CenterPetMedicalCenterWest Hills
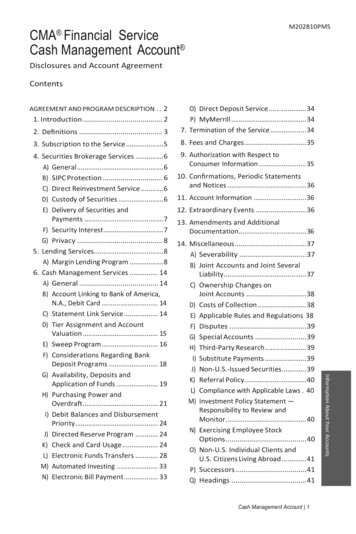
Market ProfileWest Hills Shopping CenterFields MarketRings: 1, 3, 5 mile radiiPrepared by EsriLatitude: 34.20891Longitude: -118.633291 mile3 miles5 miles2000 Total Population2010 Total Population2018 Total Population2018 Group Quarters2023 Total Population2018-2023 Annual Rate2018 Total Daytime PopulationWorkersResidentsHousehold 351,926193,458158,4682000 Households2000 Average Household Size2010 Households2010 Average Household Size2018 Households2018 Average Household Size2023 Households2023 Average Household Size2018-2023 Annual Rate2010 Families2010 Average Family Size2018 Families2018 Average Family Size2023 Families2023 Average Family Size2018-2023 Annual RateHousing Unit .3%38.9%5.8%119,61256.9%37.5%5.6%20182023Median Home Value 103,362 116,008 74,661 86,294 82,265 96,83520182023Per Capita Income20182023Median Age201020182023 660,507 707,636 609,904 656,128 614,795 665,794 45,720 53,360 36,524 42,961 40,830 on Summary2000 Housing UnitsOwner Occupied Housing UnitsRenter Occupied Housing UnitsVacant Housing Units2010 Housing UnitsOwner Occupied Housing UnitsRenter Occupied Housing UnitsVacant Housing Units2018 Housing UnitsOwner Occupied Housing UnitsRenter Occupied Housing UnitsVacant Housing Units2023 Housing UnitsOwner Occupied Housing UnitsRenter Occupied Housing UnitsVacant Housing UnitsMedian Household IncomeData Note: Household population includes persons not residing in group quarters. Average Household Size is the household population divided by total households.Persons in families include the householder and persons related to the householder by birth, marriage, or adoption. Per Capita Income represents the income received byall persons aged 15 years and over divided by the total population.Source: U.S. Census Bureau, Census 2010 Summary File 1. Esri forecasts for 2018 and 2023 Esri converted Census 2000 data into 2010 geography.February 12, 2019 2019 EsriPage 1 of 7
Market ProfileWest Hills Shopping CenterFields MarketRings: 1, 3, 5 mile radii2018 Households by IncomeHousehold Income Base 15,000 15,000 - 24,999 25,000 - 34,999 35,000 - 49,999 50,000 - 74,999 75,000 - 99,999 100,000 - 149,999 150,000 - 199,999 200,000 Average Household Income2023 Households by IncomeHousehold Income Base 15,000 15,000 - 24,999 25,000 - 34,999 35,000 - 49,999 50,000 - 74,999 75,000 - 99,999 100,000 - 149,999 150,000 - 199,999 200,000 Average Household Income2018 Owner Occupied Housing Units by ValueTotal 50,000 50,000 - 99,999 100,000 - 149,999 150,000 - 199,999 200,000 - 249,999 250,000 - 299,999 300,000 - 399,999 400,000 - 499,999 500,000 - 749,999 750,000 - 999,999 1,000,000 - 1,499,999 1,500,000 - 1,999,999 2,000,000 Average Home Value2023 Owner Occupied Housing Units by ValueTotal 50,000 50,000 - 99,999 100,000 - 149,999 150,000 - 199,999 200,000 - 249,999 250,000 - 299,999 300,000 - 399,999 400,000 - 499,999 500,000 - 749,999 750,000 - 999,999 1,000,000 - 1,499,999 1,500,000 - 1,999,999 2,000,000 Average Home ValuePrepared by EsriLatitude: 34.20891Longitude: -118.633291 mile3 miles5 % 0.9% 14.1% .3% 4.6% 18.2% 24.5%9.0%1.4%2.0% 1%17.7%11.5%1.1%1.1% 4%16.7%11.8%2.5%2.6% 30.3%9.4%1.6%2.5% %22.1%12.1%1.2%1.3% %20.2%13.1%2.7%2.8% 766,230Data Note: Income represents the preceding year, expressed in current dollars. Household income includes wage and salary earnings, interest dividends, net rents,pensions, SSI and welfare payments, child support, and alimony.Source: U.S. Census Bureau, Census 2010 Summary File 1. Esri forecasts for 2018 and 2023 Esri converted Census 2000 data into 2010 geography.February 12, 2019 2019 EsriPage 2 of 7
Market ProfileWest Hills Shopping CenterFields MarketRings: 1, 3, 5 mile radii1 mile3 miles5 14.5%- 54- 6417.7%13.8%15.1%11.0%15.4%11.9%- 74- 84 76,16076,680162,565165,6652010 Population by AgeTotal0-45-910 - 1415 - 2425 - 3435 - 44455565758518 Prepared by EsriLatitude: 34.20891Longitude: -118.633292018 Population by AgeTotal0-45-910 - 1415 - 2425 - 3435 - 4445 - 5455 - 6465 - 7475 - 8485 18 2023 Population by AgeTotal0-45-910 - 1415 - 2425 - 3435 - 4445 - 5455 - 6465 - 7475 - 8485 18 2010 Population by SexMalesFemales2018 Population by SexMalesFemales2023 Population by SexMalesFemalesSource: U.S. Census Bureau, Census 2010 Summary File 1. Esri forecasts for 2018 and 2023 Esri converted Census 2000 data into 2010 geography.February 12, 2019 2019 EsriPage 3 of 7
Market ProfileWest Hills Shopping CenterFields MarketRings: 1, 3, 5 mile radii2010 Population by Race/EthnicityTotalWhite AloneBlack AloneAmerican Indian AloneAsian AlonePacific Islander AloneSome Other Race AloneTwo or More RacesHispanic OriginDiversity Index2018 Population by Race/EthnicityTotalWhite AloneBlack AloneAmerican Indian AloneAsian AlonePacific Islander AloneSome Other Race AloneTwo or More RacesHispanic OriginDiversity Index2023 Population by Race/EthnicityTotalWhite AloneBlack AloneAmerican Indian AloneAsian AlonePacific Islander AloneSome Other Race AloneTwo or More RacesHispanic OriginDiversity Index2010 Population by Relationship and Household TypeTotalIn HouseholdsIn Family HouseholdsHouseholderSpouseChildOther relativeNonrelativeIn Nonfamily HouseholdsIn Group QuartersInstitutionalized PopulationNoninstitutionalized PopulationPrepared by EsriLatitude: 34.20891Longitude: -118.633291 mile3 miles5 %24.5%17.9%31.7%7.4%3.5%13.8%1.1%0.6%0.5%Data Note: Persons of Hispanic Origin may be of any race. The Diversity Index measures the probability that two people from the same area will be from different race/ethnic groups.Source: U.S. Census Bureau, Census 2010 Summary File 1. Esri forecasts for 2018 and 2023 Esri converted Census 2000 data into 2010 geography.February 12, 2019 2019 EsriPage 4 of 7
Market ProfileWest Hills Shopping CenterFields MarketRings: 1, 3, 5 mile radii2018 Population 25 by Educational AttainmentTotalLess than 9th Grade9th - 12th Grade, No DiplomaHigh School GraduateGED/Alternative CredentialSome College, No DegreeAssociate DegreeBachelor's DegreeGraduate/Professional Degree2018 Population 15 by Marital StatusTotalNever MarriedMarriedWidowedDivorced2018 Civilian Population 16 in Labor ForceCivilian EmployedCivilian Unemployed (Unemployment Rate)2018 Employed Population 16 by turingWholesale TradeRetail surance/Real EstateServicesPublic Administration2018 Employed Population 16 by OccupationTotalWhite esAdministrative SupportServicesBlue ortation/Material Moving2010 Population By Urban/ Rural StatusTotal PopulationPopulation Inside Urbanized AreaPopulation Inside Urbanized ClusterRural PopulationPrepared by EsriLatitude: 34.20891Longitude: -118.633291 mile3 miles5 .1%299,86299.7%0.0%0.3%Source: U.S. Census Bureau, Census 2010 Summary File 1. Esri forecasts for 2018 and 2023 Esri converted Census 2000 data into 2010 geography.February 12, 2019 2019 EsriPage 5 of 7
Market ProfileWest Hills Shopping CenterFields MarketRings: 1, 3, 5 mile radii2010 Households by TypeTotalHouseholds with 1 PersonHouseholds with 2 PeopleFamily HouseholdsHusband-wife FamiliesWith Related ChildrenOther Family (No Spouse Present)Other Family with Male HouseholderWith Related ChildrenOther Family with Female HouseholderWith Related ChildrenNonfamily HouseholdsAll Households with ChildrenMultigenerational HouseholdsUnmarried Partner HouseholdsMale-femaleSame-sex2010 Households by SizeTotal1 Person Household2 Person Household3 Person Household4 Person Household5 Person Household6 Person Household7 Person Household2010 Households by Tenure and Mortgage StatusTotalOwner OccupiedOwned with a Mortgage/LoanOwned Free and ClearRenter Occupied2010 Housing Units By Urban/ Rural StatusTotal Housing UnitsHousing Units Inside Urbanized AreaHousing Units Inside Urbanized ClusterRural Housing UnitsPrepared by EsriLatitude: 34.20891Longitude: -118.633291 mile3 miles5 2,21899.8%0.0%0.2%110,82999.7%0.0%0.3%Data Note: Households with children include any households with people under age 18, related or not. Multigenerational households are families with 3 or more parentchild relationships. Unmarried partner households are usually classified as nonfamily households unless there is another member of the household related to thehouseholder. Multigenerational and unmarried partner households are reported only to the tract level. Esri estimated block group data, which is used to estimatepolygons or non-standard geography.Source: U.S. Census Bureau, Census 2010 Summary File 1. Esri forecasts for 2018 and 2023 Esri converted Census 2000 data into 2010 geography.February 12, 2019 2019 EsriPage 6 of 7
Market ProfileWest Hills Shopping CenterFields MarketRings: 1, 3, 5 mile radiiPrepared by EsriLatitude: 34.20891Longitude: -118.633291 mile3 miles5 milesTop 3 Tapestry Segments1.2.3.Pleasantville (2B)Pleasantville (2B)Pleasantville (2B)Savvy Suburbanites (1D)Exurbanites (1E)International MarketplaceExurbanites(13A)(1E)International MarketplaceCity Lights(13A)(8A) 20,101,203 3,245.79 140,966,386 2,731.06 331,895,063 3,035.77149 16,590,681126 101,119,101140 239,573,247 2,678.94185 1,959.07135 2,191.33151 30,559,584 4,934.54 199,658,479 3,868.15 475,768,786 4,351.76153 44,328,481 7,157.84143 31,645,430 5,109.87145 53,933,384 8,708.77152 19,619,017 3,167.93152 7,723,825 1,247.19151 163,843,570 26,456.25158 25,777,433 4,162.35167 23,023,871 3,717.73173120 314,780,180 6,098.50122 222,916,301 4,318.74123 339,914,520 6,585.45115 129,713,964 2,513.06120 52,313,589 1,013.51122 1,129,520,596 21,883.15130 158,574,399 3,072.19124 142,329,511 2,757.47128135 734,392,742 6,717.33134 524,877,766 4,800.95137 811,966,897 7,426.89130 310,675,153 2,841.68136 124,487,208 1,138.66138 2,653,215,476 24,268.40145 381,637,093 3,490.75140 345,937,040 3,164.21147 9,836,543 1,588.33148 66,328,949 1,285.05119 157,358,605 1,439.331342018 Consumer SpendingApparel & Services: Total Average SpentSpending Potential IndexEducation: Total Average SpentSpending Potential IndexEntertainment/Recreation: Total Average SpentSpending Potential IndexFood at Home: Total Average SpentSpending Potential IndexFood Away from Home: Total Average SpentSpending Potential IndexHealth Care: Total Average SpentSpending Potential IndexHH Furnishings & Equipment: Total Average SpentSpending Potential IndexPersonal Care Products & Services: Total Average SpentSpending Potential IndexShelter: Total Average SpentSpending Potential IndexSupport Payments/Cash Contributions/Gifts in Kind: Total Average SpentSpending Potential IndexTravel: Total Average SpentSpending Potential IndexVehicle Maintenance & Repairs: Total Average SpentSpending Potential IndexData Note: Consumer spending shows the amount spent on a variety of goods and services by households that reside in the area. Expenditures are shown by broadbudget categories that are not mutually exclusive. Consumer spending does not equal business revenue. Total and Average Amount Spent Per Household represent annualfigures. The Spending Potential Index represents the amount spent in the area relative to a national average of 100.Source: Consumer Spending data are derived from the 2015 and 2016 Consumer Expenditure Surveys, Bureau of Labor Statistics. Esri.Source: U.S. Census Bureau, Census 2010 Summary File 1. Esri forecasts for 2018 and 2023 Esri converted Census 2000 data into 2010 geography.February 12, 2019 2019 EsriPage 7 of 7
West Hills Cutting Edge Karate West Hills Shopping Center For Information, Please Contact Greg Gicopuzzi (BRE#01906640) NewMark Merrill Companies Tel: 818.710.6100 Fax: 818.710.6116 proposed and may not actually Raz's Little Italy Physical Therapy Golden Performing Arts Center West Hills Massage Therapy West Hills Cleaners Function First .