Transcription
UNIVERSITY OF CALIFORNIAOffice of the Chief Investment OfficerPension and Savings ProgramInvestment Review as of December 31, 2017Growing Portfolios Building PartnershipsUC Investments
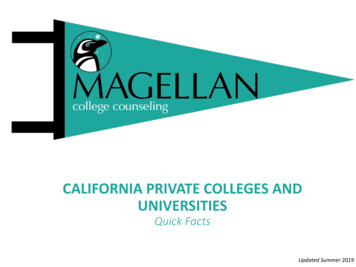
Office of the CIO at a glanceOffice of the Chief Investment OfficerGrowing Portfolios. Building Partnerships.Delivering value through values.Office of the CIO Facts 118.4 billion across 6 products Pension assets: 66.6 billion (as of 12/31/17) Investing pension assets since 1961 (57 years) Investing defined contribution assets since 1967 (51 years) Investing Endowment assets since 1933 (85 years) Serving more than 200,000 pension members Serving more than 320,000 DC participantsPension: 56%, 66.6BEndowment: 10%, 11.5BRetirement Savings: 20%, 23.8BWorking Capital: 13%, 15.6BTRIP: 9.2BSTIP: 6.4BFiat Lux: 1%, 0.9BAs of December 31, 2017
Our Pension3
UCRP at a GlanceAssets Under Management Assets of 66.6 billion have grown by 52% over 5 yearsAsset Allocation Overweight Public Equities Overweight Cash Underweight Other Investments (Private Equity, Absolute Return, Real Estate, and RealAssets) Underweight Fixed IncomePerformance Strong absolute performance driven by equity markets Active management particularly in Non-US developed and emerging markets paid off
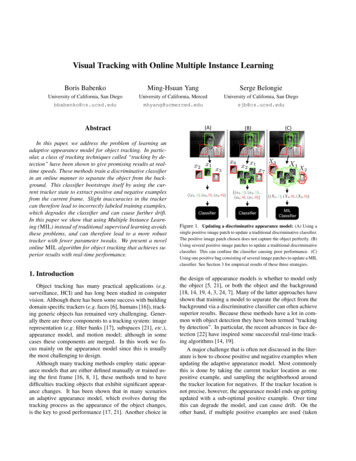
UCRP Assets grew by 52% in 5 yearsUCRP Assets 1963 - 20175 Year GrowthDecember 31, 2017 66.6 billion1 Year ago 57.1 billion5 Years ago 43.8 billionAs of December 31, 2017
AUM growth driven by marketsAssets Under Management AttributionAssets Under ManagementJune 30, 2017Market Gains 4.9 billionValue Added( 0.2 billion)Net Cash FlowAssets Under ManagementDecember 31, 2017As of December 31, 2017 61.6 billion 0.3 billion 66.6 billion
Asset AllocationMarket Valuein BillionsPercentageOver/UnderweightRelative to PolicyPolicy WeightPublic Equity38.057.1%4.9%52.2%Liquidity (Income)13.620.4%(1.1% )21.5%Core Opportunistic8.312.4%(1.0%)13.4%High Yield2.13.1%0.2%2.9%Emerging Market Debt1.52.3%(0.1%)2.4%TIPS1.72.6%(0.2%)2.8%Other Investments9.914.9%(8.6% )23.5%Absolute Return3.14.7%(2.6%)7.3%Private Equity2.84.3%(3.2%)7.5%Real Estate3.04.4%(1.9%)6.3%Real 100.0%0.0%100.0%Relative Weight As of December 31, 201711
Performance: Strong absolute returnNet Returns (%)As of December 31, 20173 Month Fiscal YTD1 Year3 YearAnnualized Returns5 Year7 Year10 Year20 YearUC Pension3.87.516.77.79.08.35.66.6UC Pension 0.70.80.60.4Value AddedNet Returns (%)As of June 302017201620152014UC Pension14.5(2.0)4.517.411.7UC Pension Benchmark12.7(0.8)2.217.11.8(1.2)2.30.3Value Added The Policy Benchmark is a weighted average of investment policy targetsOne Year )
Fiscal YTD return driven by Public EquityFYTD Contribution to Return - Percentage .422.01.00.0PublicEquityAs of December 31, 2017FixedIncomePrivateEquityAbsolute Real AssetReturnRealEstateCashTotal
High Level Macroeconomic Risk FactorsEM FX2% lio Standalone Risk Factor DecompositionFactor NameFactor DescriptionEconomic GrowthProxied by broad, developedmarket equity index returnsReal RatesInflation-linked bond returnsInflationReturn of long nominalbonds, short inflation-linkedbonds portfolioCreditReturn of long corporatebonds, short nominal bondsportfolioCommodityEmerging Markets(EM)Weighted GSCI Commodityindex returnsEqually weighted basket ofEM Assets* “Residual Risk” is any risk which does not load on to the high level macro factors. This risk often corresponds to non-strategic, non-tactical level risk decisions, e.g.individual public equity manager sector tilts and stock selection decisions. This finer scale risk is captured separately, with more granular risk models.As of December 31, 2017
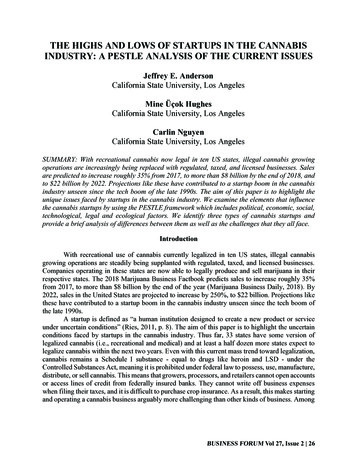
Our Savings Program
UC Retirement Savings Program at a GlanceUC Retirement Savings ProgramDeliver the best in class DC plan focused on participant outcomes through superior performance and cost managementUC Retirement Savings Program Facts 23.8 billion across 3 plans Established in 1967 Over 320,000 Participants 23.8 billion in assets 23.8B 3 Plans: 403(b), 457(b), DC Plan 2nd largest public DC plan in the US Largest 403(b) plan in the US Target Date Fund (Pathway) default since 2014 8.8 billion in Target Date FundsAs of December 31, 2017Tax Deferred 403(b) Plan: 16.7B71%457(b) Deferred Compensation Plan: 2.7B11%Defined Contribution Plan: 4.4B18%12
UC Retirement Savings Program EvolutionUCRSP Assets and Evolution 1967-20172015Lineupstreamlined from64 to 16 funds20173rd Partymanager mlined2004457(b) Planadded1987Added FidelityMutual Funds1967Plan InceptionAs of December 31, 201713
Investment Options at a GlanceTARGET DATE FUNDS - 8.8 billionUC Pathway FundsUC Pathway Income FundUC Pathway Fund 2015UC Pathway Fund 2020UC Pathway Fund 2025UC Pathway Fund 2030UC Pathway Fund 2035UC Pathway Fund 2040UC Pathway Fund 2045UC Pathway Fund 2050UC Pathway Fund 2055UC Pathway Fund 2060CORE FUNDS - 13.5 billionBond and Stock InvestmentsBond InvestmentsShort-TermUC Savings FundIntermediate-TermUC Bond FundDomestic StockLarge CapUC Domestic Equity Index FundUC Growth Company FundForeign StockDeveloped MarketsUC International Equity Index FundUC Diversified International FundSmall CapUC Domestic Small Cap Equity FundEmerging MarketsUC Emerging Markets Equity FundInflation-ProtectedUC Short Term TIPS FundUC TIPS FundSpecialty StockUC Real Estate FundUC Social Equity FundBROKERAGE WINDOW - 1.5 billionFidelity BROKERAGELINK As of December 31, 201714
Pathway – Our Target Date FundDesigned to support participants’ spending throughout retirementLongShortTime HorizonPathway 2060Pathway 2055Pathway 2050Pathway Key Features An equity landing point of 30% with static allocations at andthrough retirementPathway 2045 Focus on diversification with broad asset class exposuresPathway 2040 Utilizes a strategic glidepath to help mitigate the risksassociated with market timingPathway 2035Pathway 2030Key Benefits for ParticipantsU.S. Large Cap EquityU.S. Small/Mid Cap EquityPathway 2025International Equity Constructed to navigate the major sources of uncertaintyparticipants faceEmerging Market EquityReal EstatePathway 2020U.S. Bonds/Short Term Seeks to reduce volatility in an effort to keep participantssaving and investing across market cyclesU.S. TIPSdHigher Continuous research to anticipate, assess and adapt ahead ofevolving conditions to help meet participant needs now and inthe futurePathway IncomeInvestment RiskLower15
Pathway Performance - SummaryQ4 2017 performance relative to policy benchmarksNet of fee returns 2050Pathway2055Pathway2060Fund Policy Benchmark Value ne year performance relative to policy benchmarksNet of fee returns (%) - Pathway2045Pathway2050Pathway2055Pathway2060Fund 2.8122.79Policy Benchmark 2.6022.60Value s of December 31, 201716
Core Line-Up Performance - SummaryAnnualized Total Return (%)US Large EquityUC Domes ti c Equi ty Index FundUC Soci a l Index FundUS Small/Mid Cap EquityUC Domes ti c Sma l l Ca p Index FundGlobal/World ex-US EquityUC Interna ti ona l Equi ty Index FundCapital PreservationUC Sa vi ngs FundInflation SensitiveUC Short Term TIPS FundUC TIPS FundDiversified Fixed IncomeUC Bond FundNew Large EquityUC Growth Compa ny FundWorld ex-US EquityUC Di vers i fi ed Intl . FundUC Emergi ng Ma rkets FundReal EstateUC Rea l Es ta te FundTotalAs of December 31, 2017Market Value ( M) 4,746% of Plan19.94%3 Months6.42One Year21.37Three Year11.17Five Year15.67Ten Year8.66 3711.56%6.8424.1911.5417.128.73 4902.06%5.1116.279.8714.479.72 1,0214.29%4.4225.057.667.782.19 3,98616.75%0.361.401.271.171.85 340.14%0.370.831.18 2170.91%1.132.962.290.403.91 1,1895.00%0.524.082.722.454.35 8313.49%7.1137.1416.2419.9111.60 1450.61%3.7626.858.088.942.36 2270.95%7.2736.648.854.192.53 2180.92%1.394.935.279.267.67 13,47548%17
2017 lineup changesOverview of ChangesImplementation DateI.Eliminated Calvert Fund – moved assets to Vanguard Social Fund2/28/2017II.Repackaged Fidelity and DFA funds to institutional funds10/02/2017III. Renamed 3 Vanguard funds to easier naming convention10/02/2017IV. Eliminated the UC Balanced Growth and UC Global funds10/02/2017V.12/31/2017Implemented 3rd party manager for PathwayLineup changes highlights:Transitioned 7.9 billion into new funds (35% of UCRSP plan assets);Completed a multi-stage communication campaign that reached over 300,000 participants;Reduced fees by over 6 million annually;Reduced operational complexity and risk;Allow participants to better understand their risk exposure; andImplement an easy to understand and consistent naming convention for all funds.18
UC Pathway Funds : UC Pathway Income Fund UC Pathway Fund 2015 UC Pathway Fund 2020 UC Pathway Fund 2025 . UC Pathway Fund 2030 UC Pathway Fund 2035 UC Pathway Fund 2040 UC Pathway Fund 2045 . UC Pathway Fund 2050 UC Pathway Fund 2055 UC Pathway