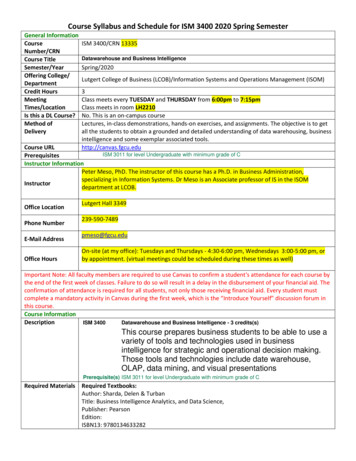
Transcription
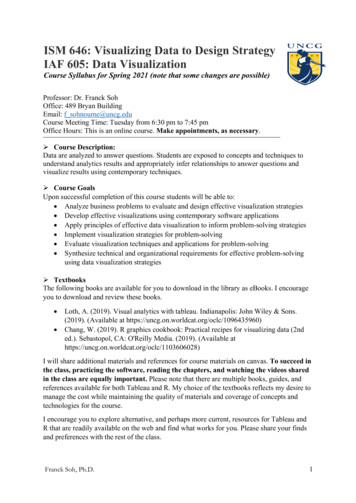
ISM 646: Visualizing Data to Design StrategyIAF 605: Data VisualizationCourse Syllabus for Spring 2021 (note that some changes are possible)Professor: Dr. Franck SohOffice: 489 Bryan BuildingEmail: f sohnoume@uncg.eduCourse Meeting Time: Tuesday from 6:30 pm to 7:45 pmOffice Hours: This is an online course. Make appointments, as necessary.Textbook and Supplies: Course Description:Data are analyzed to answer questions. Students are exposed to concepts and techniques tounderstand analytics results and appropriately infer relationships to answer questions andvisualize results using contemporary techniques. Course GoalsUpon successful completion of this course students will be able to: Analyze business problems to evaluate and design effective visualization strategies Develop effective visualizations using contemporary software applications Apply principles of effective data visualization to inform problem-solving strategies Implement visualization strategies for problem-solving Evaluate visualization techniques and applications for problem-solving Synthesize technical and organizational requirements for effective problem-solvingusing data visualization strategies TextbooksThe following books are available for you to download in the library as eBooks. I encourageyou to download and review these books. Loth, A. (2019). Visual analytics with tableau. Indianapolis: John Wiley & Sons.(2019). (Available at , W. (2019). R graphics cookbook: Practical recipes for visualizing data (2nded.). Sebastopol, CA: O'Reilly Media. (2019). (Available athttps://uncg.on.worldcat.org/oclc/1103606028)I will share additional materials and references for course materials on canvas. To succeed inthe class, practicing the software, reading the chapters, and watching the videos sharedin the class are equally important. Please note that there are multiple books, guides, andreferences available for both Tableau and R. My choice of the textbooks reflects my desire tomanage the cost while maintaining the quality of materials and coverage of concepts andtechnologies for the course.I encourage you to explore alternative, and perhaps more current, resources for Tableau andR that are readily available on the web and find what works for you. Please share your findsand preferences with the rest of the class.Franck Soh, Ph.D.1
Programming EnvironmentWe will use Tableau and R as visualization tools in this course. I do not expect you to haveany prior experience with either Tableau or R.Tableau is available for students as a free download athttps://www.tableau.com/academic/students. I will provide access keys and a guide todownloading and installing Tableau for you in canvas.We will use R Studio (https://www.rstudio.com/) to design and develop analytics andvisualizations in R. R is a programming language and free software environment forstatistical computing and graphics supported by the R Foundation for Statistical Computing.R Studio is an Integrated Development Environment to build R analyses and visualizations. Canvas Learning Management SystemUNCG Canvas is available at https://canvas.uncg.edu. Course materials, announcements, andupdates will be posted on Canvas regularly. Please check canvas daily for announcements,discussions, and materials. You will be responsible for any information or announcementsprovided to you through emails and for any updates on Canvas. ParticipationStudents are expected to regularly discuss their progress in the course and participate indiscussions using the topic/assignment specific discussion boards on Canvas. AssignmentsDesigning and developing problem-solving strategies constitute a significant aspect of yourskill development in this course. Much of this is accomplished through discovering solutionsas you solve problems presented in your assignments. Assignments, therefore, are an integralpart of your learning in the course.All assignments must be completed by you and outside of class. They are due at 11:59 pmon the assigned due date unless otherwise announced. Assignments submitted after theirdue dates may be accepted without a penalty based on valid reasons and documented cause,following discussion with the instructor. If no valid reason or documentation is provided,late projects will have a 10%-point deduction/day. Late projects will be accepted up to 4business days after the due date only. Group Project IThe 1st group project enables you to extend your skills in data visualization by exploringadvanced topics. I suggest the students explore an advanced topic in one of the threecategories below: Type of visualization approacheso e.g., animated, 3D, AR, VR, etc. Type of datasetso e.g., image, video, audio, genes, etc. Other visualization toolso Python, Power BI, etc.For the project, you will submit (specific submissions dates are provided in the tentativeschedule):Franck Soh, Ph.D.2
Proposal – that indicates the topic you will study, a high-level outline of the contentof the presentation, and the members of your group. While I prefer group projectswith a demonstration, I am aware that some advanced topics are difficult todemonstrate. If you plan to include a demonstration, your proposal should include thesource and information about the data you will use. If you are not planning to includea demonstration, please discuss it with me before-hand.Changes to the proposal are possible during the progression of the course. Please inform meof the change – unapproved changes will result in a loss of points. The proposal should be nomore than 2 pages and address all the items discussed above. Interim Report – that indicates the graphs and charts that you will include in thepresentation. Ideally, if you plan on using a demonstration, you should havecompleted at least 50% of the graphs and charts. Moreover, you should report on thedata preparation and analysis you have done. Finally, the interim report shouldinclude your plan for completing the project and the expected process. If you areusing a demonstration, highlight your progression in the completion of graphs andcharts.Submit a document of no more than 5 pages that describes the graphs, charts, and process tocomplete the project. Presentation – submit a video presentation (preferably a PowerPoint presentation demonstration) to educate the class about the advanced topic you studied.The presentation should not be more than 1h. You must include an introduction to the topic(e.g., definition, origin, applications, importance, etc.). The introduction should be about 20%of the presentation. Moreover, you must present the graphs and charts associated with yourtopic (about 30% of the presentation). Finally, if you are using a demonstration (you arehighly encouraged to have a demonstration to help students learn the graphs and charts), youshould provide a step-by-step video tutorial about how to create the graphs and charts (50%of the presentation). Group Project IIThe 2nd group project allows you to apply your skills in data visualization. You can Tableau,R, or other technologies (e.g., Python, Power BI). You want to choose a platform differentfrom Tableau and R, please discuss it with me before-hand. For the project, you will submit(specific submissions dates are provided in the tentative schedule): Proposal - that details the nature of questions you will answer with the data, thesource and information about the data you will use, the form your visualization willtake (in broad terms) and the members of your group.While I suggest you propose the platform/tools you intend to use, you may change theseduring the progression of the course. Please inform me of the change – unapproved changeswill result in a loss of points.The proposal should be no more than 2 pages and address all the items discussedabove.Franck Soh, Ph.D.3
Interim Report – An interim report of the progress and preliminary findingsif any. The primary content of the interim report will be the data preparation andanalysis you have done, along with any preliminary insights or findings that emerge.The interim report should include your plan for completing the project and expectedprocess and results.Submit a document of no more than 5 pages (put any charts or tables as appendices)that describes your process and preliminary findings. Presentation: Submit a video presentation using any tool of your choice that outlinesthe overall findings of your project. The primary purpose of the presentation is toshowcase the analysis you have done using the platform you chose. Think about anarrated walkthrough of a storyboard or set of dashboards and present theimplications of your analysis. Final Report: The final report should have an executive summary of your findingsand the key outcomes from your analysis as well as a discussion of the implicationsof your work and suggested next steps.The report should be no more than 10 pages long ( 1 page of the executivesummary). Provide summary and aggregate visualizations that support your findings.Any additional charts and tables may be submitted as appendices.The final submission should include your final analysis tool in the form of an RProject or Tableau file (or the output of the tool you choose). Exams Exams will be administered only once. If a documented emergency develops and youmiss an exam, there may be an alternative at the discretion of the instructor. GradingThe course grade will be calculated using the following distribution:ElementsIndividual AssignmentsMidterm ExamFinal ExamGroup Project IGroup Project IITotalPoints30%20%20%15%15%100Final Grading w 69A AAB BBC CFPlease Note: Grades in the ISSCM Department are NOT posted and are NOT given over the phone.You may check your grades on UNCGenie within 3-4 days after the final exam.Franck Soh, Ph.D.4
Questions concerning the grading of an assignment, exam, or project must be resolvedwithin a reasonable time (typically one week) after the grade has been posted inCanvas. After that period, all grades are final. Tentative ScheduleA flexible schedule of topics and reading assignments is provided below and on Canvas. Youare responsible for checking the schedule, coming to class prepared, and finding out if inclass assignments were made in case of your absence. The chapters are assigned in theschedule, and additional reading may be provided /15-26Franck Soh, Ph.D.Class TopicsModule 0 Data visualizationo Definition and applications Data visualization toolso Proprietary and open source Introduction to Tableau productso Tableau Desktop and Tableau PrepModule 1 Data preparation with Tableau Prepo Input, cleaning, pivot, aggregate,join, union, and output stepsModule 2 Basic charts and graphso Scatter plotso Bar and pie chartso Line graphs Data managemento Hierarchieso Parameterso Relationshipso Filtero Setso Sortingo GroupingGroup project I proposal due (2/5/2021)Group project II proposal due (2/5/2021)Assignment I posted (2/5/2021)Module 3 Visual analyticso Clusteringo Explain datao Reference lineso Trend lines Working with dates (time-series dataset)o Forecasting CalculationsReadings &VideosTBA – TableauTraining VideosCh. 1 of Loth(2019)TBA – TableauTraining VideosCh. 10 of Loth(2019)TBA – TableauTraining VideosCh. 3 and 4 ofLoth (2019)TBA – TableauTraining VideosCh. 5, 7 and 8 ofLoth (2019)5
783/1-53/8-1293/15-19103/22-26111213 &143/29-4/24/5-94/12-23Franck Soh, Ph.D. Dashboards and StoriesAssignment I due (2/26/2021)Midterm ExamModule 4 Advanced chartso LOD expressionso Heat mapo Tree mapo Box ploto KPI charto Waterfall charto Bump chartGroup project I interim report (3/12/2021)Group project II interim report (3/12/2021)Assignment II posted (3/12/2021)Module 5 Visualization for geospatial datao Mapso Density Mark Typeo Polygon MapsModule 6 Visualization for network datao Network diagramsModule 7 Visualization for text analyticso Word cloud, frequency, andsentiment Simple words and Ngramso Network diagramo Tree diagramo Bubble lineo BarcodeGroup project I presentation due (4/2/2021)Assignment II due (4/2/2021)Assignment III posted (4/2/2021)Module 8 Introduction to R Basic charts and graphso Scatter plotso Bar chartso Line graphso HistogramsModule 9 Advanced topicso Type of visualization e.g., animated, 3D, AR,VR.o Type of datasetTBA – TableauTraining VideosCh. 3 of Loth(2019)TBA – TableauTraining VideosCh. 6 of Loth(2019)TBATBACh. 1 & 2of Chang (2019)Studentspresentations6
e.g., image, video, audio,genes.o Other tools Python, Power BIGroup project II presentation due (4/23/2021)Assignment III due (4/23/2021)No Class - Reading DayGroup project II final report due (4/29/2021)Final Exam 154/26-29164/30-5/6ReferencesChang, W. (2019). R graphics cookbook: Practical recipes for visualizing data (2nd ed.).Sebastopol, CA: O'Reilly Media. (2019). Availableat https://uncg.on.worldcat.org/oclc/1103606028 (Links to an external site.)Loth, A. (2019). Visual analytics with tableau. Indianapolis: John Wiley & Sons. (2019).Available at https://uncg.on.worldcat.org/oclc/1096435960 (Links to an external site.) Changes to the Syllabus/ScheduleThe syllabus and schedule are tools to help you plan your time. Every effort is made to makethe syllabus and schedule as complete as possible, but there may be occasions when changesare required, including changes in the grading components, due dates, and exam dates. Theinstructor will announce any deviations from the syllabus or schedule in class. Extra creditsThere are few options to earn extra credits through the group projects. I will describe thegroup projects and associated extra credits in class. The maximum extra credit a studentcan have in this course is 5% of the grade points. Make-up Exam PolicyIt is to your advantage to take all exams at the scheduled times. Only in the case of a welldocumented true emergency should an exam be missed. Please be sure to get yourinstructor’s prior approval for all but emergency cases. Exams missed without the priorapproval of your instructor or without adequate documentation of the reason formissing the exam will result in a recorded grade of zero for the missed exam. Grading Impact of Possible Class DisruptionsThis section is about the impact of possible disruptions on your course grade. Rather thanwaiting for disruptions to happen, and then having to inform you how those are going toaffect your grade, we want to tell you in advance how your course grade may be affected bypossible disruptions. For example, what would happen if we have too many disruptions so wecannot complete all course assignments? What if we must cancel the project?If any course individual projects and exams are canceled (either by the instructor or theuniversity), the course grade will be based on the exams, and projects that have beencompleted in the course. The percentage cut-offs listed in the course syllabus will change. Attendance PolicyFranck Soh, Ph.D.7
ISM646 will meet on Tuesday from 6:30 pm to 7:45 pm beginning the week of January19. It is the student’s responsibility to attend class online and to participate in classdiscussions. It is the student’s responsibility to stay on track with readings and assignments tobe successful in the course. Because this is an interactive class, learning depends onattendance. Online attendance at all class meetings is expected. Information about upcomingassignments, including changes in deadlines and submission dates, may be discussed in class.If you must miss a class, you are responsible for finding out about assignments announcedthat day. Having missed a class will never be accepted as an excuse for missing a courserequirement. e-Mail Always include a subject line. Remember without facial expressions some comments may not be interpretedaccurately. Take care to word your emails. The use of emoticons might be helpful insome cases. Use standard fonts. Do not send large attachments without permission. Special formatting such as centering, audio messages, tables, Html, etc. should beavoided unless necessary to complete an assignment or other communication. Respect the privacy of other class members Please Note: E-mail is my preferred method of communication. Please send an emaildirectly to my email address: f sohnoume@uncg.edu NetiquetteThe same guidelines that apply to traditional classes should be observed in the virtualclassroom environment. Please use proper netiquette when interacting with class membersand the professor. Policy on Server Unavailability or Other Technical DifficultiesThe university is committed to providing a reliable online course system for all users.However, in the event of an unexpected server outage or any unusual technical difficultywhich prevents students from completing a time-sensitive assessment activity, the instructorwill extend the time windows. What you Need to Take this Course Textbooks, Tableau, and RStudio. You must have access to a computer that connects to the Internet. The coursematerials are only accessible online by logging in to canvas.uncg.edu – your studentidentification number is required. If you do not own a computer, the computer labs oncampus might be open during this semester. You must have a working e-mail account. Your first assignment will be to updateyour e-mail address on the course Web site. Instructions are online at canvas.uncg.edu- you must log in to see the course materials. Because of e-mail viruses, you must use the subject ISM646 and your full name typedin the message, or the e-mail may be ignored.If you have questions, please do not respond to a Canvas Announcement, rather sendme a direct email.Franck Soh, Ph.D.8
You must check your e-mail account regularly throughout the semester. Officialannouncements will be made by e-mail and on the course Web site atcanvas.uncg.edu.You are responsible for saving all assignments correctly, so you can turn them inelectronically. You should be comfortable using word processing software,programming software, and have reasonable keyboarding skills. No assignments willbe accepted in handwritten form.Supplies: Although you will be publishing (uploading) your assignments, it is a goodidea to keep copies of everything. IMPORTANT: Academic Integrity PolicyDiscussing your assignments with other students can be a valuable learning resource; however,each student is expected to do their original work. University students conduct themselves perthe highest standards of academic integrity. Academic misconduct for which a student issubject to penalty includes all forms of cheating, such as illicit possession of examinations orexamination materials, forgery, or plagiarism. UNCG Academic Integrity Policy can be rity-policy/.Students should NOT make, borrow, or “share” copies of their assignments or files with otherstudents, including previous ISM 646 students. Helping one another is allowed, but copying,even electronically, is cheating. This practice is against the UNCG Academic Integrity Policyand defeats the purpose of this course. No credit will be received for shared work, and otherpenalties may be imposed. Accommodations for Students with DisabilitiesStudents are responsible for requesting accommodations from the Office of AccessibilityResources & Services (OARS), according to their procedures and policies. The student is toprovide a written request for each test accommodation to their instructor (an e-mail will sufficeprovided you have received a reply from the instructor). Both the requests to the OARS andthe instructor are to be made at least ten school days before the test date. Important Health StatementHealth and well-being impact learning and academic success. Throughout your time at theuniversity, you may experience a range of concerns that can cause barriers to your academicsuccess. These might include illnesses, strained relationships, anxiety, high levels of stress,alcohol or drug problems, feeling down, or loss of motivation. Student Health Services andThe Counseling Center can help with these or other issues you may experience. You canlearn about the free, confidential mental health services available on campus by calling 336334-5874, visiting the website at https://shs.uncg.edu/, or visiting the Anna M. GoveStudent Health Center at 107 Gray Drive. For undergraduate or graduate students in recoveryfrom alcohol and other drug addiction, The Spartan Recovery Program (SRP) offers recoverysupport services. You can learn more about recovery and recovery support services byvisiting https://shs.uncg.edu/srp or reaching out to recovery@uncg.edu COVID-19 Spartan Shield VideoUNCG Chancellor Frank Gilliam has challenged us to create a Culture of Care at UNCGwhere we all wear face coverings and social distance, less to protect ourselves but rathermore to protect everyone around us. It shows that you care about the well-being of everyoneFranck Soh, Ph.D.9
around you. We have created this video featuring your student body presidents to betterexplain how and why this is so important.Please watch this video before the first day of classes.https://youtu.be/Mb58551qxEk Expectations of Faculty and Students in the Bryan SchoolStudents should read the Guidelines for Faculty and Students presented on the web pagesfound at aculty student guidelines.pdfFranck Soh, Ph.D.10
You can Tableau, R, or other technologies (e.g., Python, Power BI). You want to choose a platform different from Tableau and R, please discuss it with me before-hand. For the project, you will submit (specific submissions dates are provided in the tentative schedule):

