Transcription
an introduction toVISUALIZING DATA by joel laumans
an introduction to VISUALIZING DATA iiiAN INTRODUCTION TO VISUALIZING DATA by Joel LaumansTable of Contents1Introduction1DefinitionPurpose2Data visualizations23Examples34The data5Examine the data5Data visualization patterns6Revealing the data812Preattentinve variables7Multimedia16Screen resolutionsUser interaction8Tools and further reading20
iv Joel LaumansForewordThe purpose of this document is to provide anintroduction to the theory behind visualizingdata. After studying the works of many talentedpeople I decided to summarize the key pointsof information into this single paper. If youfound this document interesting please takesome time to look at the list of resources thatI used (see Chapter 8) because I could neverhave created this without the excellent workdone by others.If you have any comments or feedback pleasefeel free to contact me.Joel LaumansUser Experience com/in/joellaumans 1IntroductionTo create a truly powerful data visualization acombination of artistic, statistical, and mathematical skills are required - this is most likelythe reason why the first multivariate statisticalgraphics only appeared late in the 18th century. Over time the use of data visualizationhas become continually more popular; partlybecause the tools to create data graphics arereadily available, but also, because there isan urgency to communicate information bothquickly and effectively as possible.The purpose of this document is to provide anintroduction to data visualization by exploringthe purpose, the requirements, and methods ofvisualizing data.1
2 Joel Laumans2an introduction to VISUALIZING DATA Data visualizationsDefinitionData visualizations, also known as data graphics, can be best explained by quoting EdwardTufte:“Data graphics visually display measured quantities by means of thecombined use of points, lines, a coordinate system, numbers, symbols,words, shading, and color.”PurposeCreating a data visualization is more than simply translating a table of data into a visualization. Data visualizations should communicatedata in the most effective way; to truly revealthe data they should be quick, accurate, andpowerful. Creating visuals can easily summarize and communicate data to other people- making even the largest or most complicatedsets of data understandable.3ExamplesName popularity in the United States of AmericaThis is a collection of maps visualizing the popularity of namesin different states of the United States. The color (pink vs blue)represents the gender of the name, and the saturation of thecolor represents the popularity of the name in the respective region. This is a very simple and powerful visualizationbecause we can easily conclude that ‘Alex’ is popular throughalmost the entire country, while ‘Colin’ is more popular in theNorth Eastern states.UsageCampaign FinancesA common misconception is that data visualizations are the same as information graphics(infographics). It is important to understandthat data visualizations always communicatea message by visualizing quantifiable dataobjectively, while infographics can be used tocommunicate any information at all (usuallywith a specific goal); regardless of whether it isquantifiable or not.Data visualizations can take many differentforms depending on the information that isbeing communicated - from simple bar chartsthat communicate rising oil prices to interactive applications that analyze website visitordata.This is a screenshot of an interactive visualization made by TheNew York Time’s to visualize the which regions were financingthe US presidential candidates. Each circle represents a majorcity, and the size of the circle represents the amount of moneydonated. At the bottom is a bar chart which shows the amountof money (vertical) donated per week (horizontal). What makesit very powerful, was the element of interaction - users canselect which candidate they want to view, the time span, andretrieve extra data by clicking on the circles.3
4 Joel LaumansDistribution of the world’s waterThis a great example of how visualizing data can be used tocommunicate a very powerful message. Read from top to bottom, this visual tells us that only 2,5% of the world’s water isfresh water, and of those 2,5% only a small portion is actuallyavailable for human use because the majority is frozen in glaciers; a fact that most people are unaware of, but communicated clearly in this visualization.an introduction to VISUALIZING DATA 4The dataThere are countless methods of how to create data visualizations - they will vary greatlydepending on the content of the data, as wellas the purpose of the visualization. Whicheverform it takes, the most important is to maintaingraphical excellence, explained by Tufte as:“Excellence in statistical graphicsconsists of complex ideas communicated with clarity, precision, andefficiency.”According to Tufte’s checklist, all data visualizations should:Virtual WaterThis is another visualization created to raise awareness aboutexcessive water usage. It visualizes the amount of water thatis used in the production of certain products. The blue waterdrops represent the amount of water used per product: forexample it takes 1000 liters of water to produce 1 liter of milk,or 4500 liters of water for a single piece of steak. Very simpleand effective. Show the data Be accurate (don’t distort the data) Make large data sets coherent Serve a clear purpose Reveal the data at different levels (overviewversus detailed) Encourage the viewer to compare differentpieces of data5
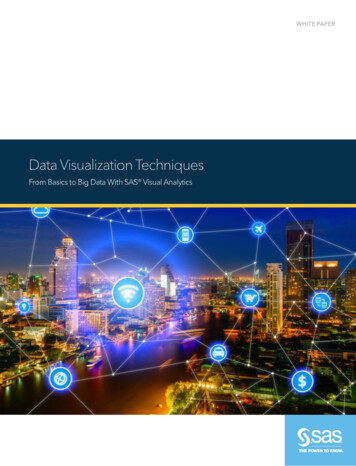
6 Joel Laumansan introduction to VISUALIZING DATA Examine the dataEvery set of data can be visualized in multipleways, some more effective than others. Inorder to create an effective data visualizationthe data first that to be understood. Therefore,the first step in creating a data visualization isto examine the data. Basic questions that needto be answered are: What is the data? What are the relationships between thevariables? How is the data organized? What needs to be communicated?Examples of how data can be organizedBen Fry’s “Seven Stages of Visualizing Data”Visualizing complex data sets often requires insights from diverse fields of knowledge, suchas statistics, data mining, graphic design, et cetera. Ben Fry suggests a seven stage designprocess, reconciling all stages into a single process.1. AquireObtain the data, whether from an Excel document, an XML feed, et cetera.2. ParselineartabularData will not always be organized ideally for visualizing it. Give your data structure by ordering it into categories.3. FilterBe careful to prevent information overload, remove all but the data of interestBefore thinking about how the visualizationshould look, it is important to have answeredthese questions because they will determinethe form of the data visualization.One of the most important parts is understanding how the data is organized and related toeach other. For example, if you want to communicate company growth over time a simpleline chart might be the most effective - but tocommunicate population density around theworld it might be more effective to use a cartographic (map) visual.There are countless possibilities of how tovisualize data; but there are many designpatterns which are proven to be effective forspecific types of data. The following sectionprovides examples of data visualization patterns and a short rationale for when to usethem.4. MineApply methods from statistics or data mining as a way to find patterns or meaning in thedata.hierarchicalnetworked5. RepresentChoose a basic visual model to visual the data. (see Chapter 5)6. RefineImprove the basic representation to make it more clear and more visually engaging. (seeChapter 6)7. InteractgeographicotherAdd methods for manipulating the data. Allows users to control what they see or even possibly how they see it.7
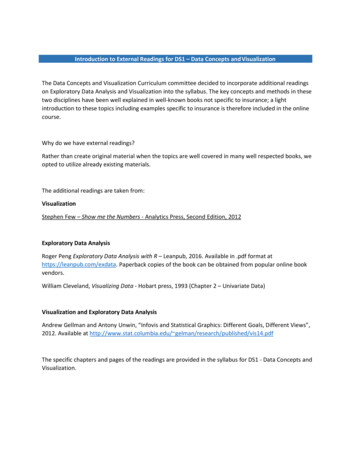
8 Joel Laumans5an introduction to VISUALIZING DATA ProportionsData visualization patternsIndependent quantitiesComparing the values ofindependent variablesContinuous quantitiesFor data that is continuous,for example when visualizingdata over a period of time.Proportions are used whenthe data represents parts ofa whole.Pie chartsSimple pie charts are the most common visualused to compare proporational data. Theygive viewers a very quick understanding of thedistribution of the data. Pie charts are not useful when comparing many pieces of data withrelatively close values.Bar chartsRing chartsSimple bar charts are the most common formof data visualizations. Typically they only display different quantities of single-variable data.However other variations, such as stacked barcharts or multi-set bar charts can be used tocompare multiple variables using bars.Similar to pie charts; ring charts are used tovisualize the distribution of a data set. Theadvantage is they compare similar data sets.The alternative would be to place multiplepie charts next to each other, this can also beviewed as a space-saver.Line graphsCorrelationsScatterplotsLine graphs are created by plotting points on aCartesian grid, usually with the horizontal axisrepresenting time. They are very powerful because without looking at the specific data, theyshow how a variable develops over time (fromleft to right).These are used when eachpiece of data has two quantifiable variables which can beplotted on a grid.They are created by plotting independentpoints on a Cartesian grid. Scatter plots are often used to find the relationship between dataor to reveal information such as trends withinthe data which are not easily visible when in atable. Only works with two dimensional data.Stacked area chartsSimilar to line charts, however with the addedvalue of filled areas. The data that is stackedadds up to a total of all variables combined. Forexample a business might use stacked areacharts to visualize their total income, with eachstacked area a different income channel.Bubble chartsSimilar to scatterplots; however, bubble chartsdisplay more dimensions of data by varyingsize (or also color, texture, etc) of the bubbles.It therefore can display multiple dimensions ofdata in a two dimensional display.9
10 Joel LaumansHierarchiesUsed when the data has astrict hierarchy that needs tobe communicated.an introduction to VISUALIZING DATA 11Tree diagramsTree diagrams are often used when wanting torepresent the strict hierarchy of data. They aremost often used to represent strict hierarchiessuch as family trees or how data is stored in acomputer system.NetworksDiagram mapsNetwork visualizations areused when the most important feature of the visualization is to show which data isconnected to each other, asopposed to how.These visualizations are used to primarilyrepresent the connections between different nodes or points. Their purpose is to showwhich points are connected to each other.Common examples of diagram maps are metromaps and social network visualizations.CartographicFor data that is relevant tospecific locations or regionswhich can be plotted on amap.MapsMaps are used when the data is related to aspecific location (for example a city, or country). The advantage is that their spatial representation directly relates to a real-world situation. However at times can be difficult to read.FlowsWhen the data is part of aprocess, it can be visualizedusing flow diagrams.Sankey diagramsSankey diagrams are composed of severalsmaller ‘arrows’ or channels, which mergetogether into one large channel. For example,a sankey could be used to visualize a movie’srevenue, first movie tickets, then merchandise,then DVD sales. Each smaller arrow would berepresenting a source of income.Data visualization patterns (cont.)The aforementioned examples represent onlya small number of the most popular types ofvisualizations. To find more information aboutthe different types of data visualizations referto the references listed at the end of this document.There are many advantages to using existingpatterns for data visualization. They have beenproven to work effectively for a specific type ofdataset. Furthermore, people are familiar withreading these types of visualizations, makingthem easier to understand.Unfortunately, many data sets have uniquecharacteristics which will force you to come upwith new ways of communicating the data inthe most effective and powerful way possible.When one single data visualization pattern willnot be adequate, the solution many times is tocreate a combination of several data patternsto create a single message. Each pattern canthen be used to represent specific variables inthe data.The two visualizations on the right are goodexamples of how to combine visualization patterns. The top visualization is a combination ofa cartographic, bubble chart, and network diagram. The bottom is a combination of bubblechart and pie charts plotted onto a matrix.
12 Joel Laumans6an introduction to VISUALIZING DATA 13Now take a look at the values in the table andfind all numbers greater than 1.0.Revealing the dataCreating a powerful data visualization is notabout simply translating a table of data intoa visual graphic, it is about communicatingthe meaning of the data. Choosing the mostadequate visualization design pattern is animportant step because it will immediatelytell users about how the data is organized andwhat you are trying to communicate about thedata. However, it is not only the type of visualization pattern chosen - but also the design ofthe individual elements that play an importantrole in communicating information to others.Preattentinve variablesThere are certain visual features in design thatwill work preattentively; they will communicatesomething about the design before the userpays conscious attention to it. Jennifer Tidwellhas coined these as preattentive variables.A powerful data visualization should workquickly and effectively; therefore the visualdesign should help reveal the data to the users.Table 1: Find the values larger than 1.0There is no visual aid to help us find the valuesgreater than 1.0, forcing us to read all of thedata and understand it. Now look at the following table.In Tidwell’s book, Designing Interfaces, sheprovides the following examples.Take a look at the following group of dots andfind all of the blue dots.Table 2: Find the values larger than 1.0Finding the values has become much easier bysimply changing some of the visual features wecan significantly improve the search times forusers.On the following pages all eight of Tidwell’spreattentive variables will be demonstrated.Quick, right? Even if we increased the numberof red dots, finding the blue dots will be just asquick, because color works preattentively!
14 Joel Laumansan introduction to VISUALIZING DATA 15Color hueColor brightnessColor saturationTexturePositionOrientationSizeShapeIn essence, all display patterns use any singleor combination of these variables to visualizedata. Properly applying these visual variablesis what allows large sets of data to be quicklyand accurately understood in data visualizations.
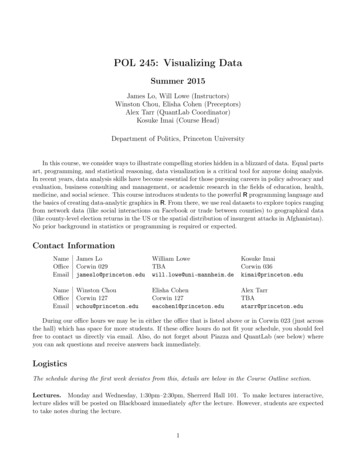
16 Joel Laumans7an introduction to VISUALIZING DATA 17MultimediaUntil recently, all data visualizations werestatic and predefined; however, many moderndata visualizations are created using multimedia interfaces that expand the possibilities ofdata visualizations.When working with multimedia interfaces (asopposed to print), there are new factors whichcan influence the effectiveness of communicating information to users. The most limitingfactor of multimedia is the relatively smallamount of information that can be displayed ona screen, but the main advantage of using multimedia is that visualizations can be dynamic,animated, and allow for user interaction.Screen resolutionsThe most common screens where users willcome across data visualizations are desktopmonitors and mobile phones.Modern mobile phones resolutions vary between 144 x 176 pixels up until 320 x 480 pixels,with the most popular being 240 x 320 pixels.Only simple data visualizations can be displayed at this resolution. Comparing 20 different pieces of data becomes difficult.Typical desktop computer resolutions aremuch higher, ranging between 1024 x 768 pixels and 1600 x 1200 pixels, allowing for richervisualizations that communicate sets of datathat are larger and more complex.The graph on the following page illustrates theeffectiveness of a data visualization versus thescreen resolution of the medium. Low resolutions are a true limiting factor for displayingdata. The effectiveness of a data visualizationincreases quickly as the resolution increases,however plateaus once reaching the upperlimit of desktop monitor resolutions. Thereason for the plateau is simply because, atthis point, more information can be displayedthan a person can see at any single point intime. This means that by being able to displaymore information than a user can see will notMobile resolutionsincrease the effectiveness of the data visualization. When working with multimedia datavisualizations, the most effective resolutionswill be those of standard desktop monitors.User interactionTraditionally, data visualization was aboutchoosing the correct design pattern to visualize the respective data to create the mostmeaning; however when we allow the userto interact with the data, it is not only abouthow the data is displayed, but also about howit behaves. When users interact with the dataDesktop monitor resolutionsvisualization, they can control and manipulatehow and what is displayed. There are manyforms of user interaction that can be appliedto data visualizations. These forms are in twocategories: Data selection and filtering – The user cancontrol which data is displayed Data arrangement and navigation – The usercan control how the data is displayed orviewed.Data selection and filtering will help userscontrol precisely which data is being visualized. This will help users find data only relevantto what they are looking for, and help preventinformation overload.Data arrangement and navigation can help
18 Joel Laumansusers find new meaning in the data. Simply displaying the same data in a different fashion canhelp people come to new conclusions and seedifferent relationships between the data.“Each set of data has particulardisplay needs, and the purpose forwhich you’re using the data set hasjust as much of an effect on thoseneeds as the data itself.” (Ben Fry)Allowing users to control these two variablesinstantly makes data visualizations morepowerful, simply because it makes them moreparticular to a single user.When using screens as a medium for displaying data visualizations, they can be organizedinto four different categories: static, animated,interactive, and direct manipulationThe most powerful type are those that supportdirect manipulation because they will let usersimmediately see how the variables they adjustinfluence the data that is being displayed.These visualizations that which support directmanipulation, have the advantage that: Users can quickly learn the relationshipbetween different variables. Users can immediately see if their actionsare furthering their goals, and if not, theycan simply change the direction of theiractivity.In conclusion, when you take a traditional datavisualization and add the combination of userinteraction and direct manipulation, it createsa powerful formula for visualizing data. Givingthe user control over the visualization makes itmore meaningful to the user, and helps theman introduction to VISUALIZING DATA 19Categories of data visualizationsStaticThe data visualization doesnot change over time, andoffers no user interaction.Data visualization becomesa research instrumentAnimatedThe data visualizationchanges over time - usingtime as another dimensionor variable.InteractiveThe user can interact withthe visualization by alteringwhat data is viewed and / orhow it is viewed - howeverthe results of interactionsare not immediately visible.Direct manipulationThe user can interact withthe visualization by alteringwhat data is viewed and / orhow it is viewed - and theresult of all interactions areimmediately visible.StaticAnimateddiscover new meaning in the data. By addinguser interaction, the data visualizations havebeen transformed from a static display ofquantitative data into a tool for discovering newmeaning and relationships in the data.InteractiveDirect manipulation
20 Joel Laumans8an introduction to VISUALIZING DATA 21ToolsTools and further readingBooksHere is a short list of booksfor anyone interested inlearning more about visualizing data.Although simple data visualziations can be made usingsoftware such as MicrosoftExcel, Here are tools you canuse to create more complexdata visualizations.The Visual Display of QuantitativeInformationby Edward TufteProcessing is one of the most popular platforms for visualizing data. This this the musthave tool for people who are interested increating custom data visualizations with theirown data. The initial learning curve is quitehigh because basic programming knowledge isrequired. The best way to get started is to buythe Ben Fry’s book Visualizing Data which provides tutorials for people interested in learningProcessing.by Jenifer Tidwellby Ben FryFor those interested in creating complex datavisualizations, this is book is for you. This bookexplains how to create data visualizations using Processing (an opensource platform fordata visualization). Each chapter is a tutorialteaching you about data visualization as well ashow to use Processing.A research group at IBM created Many Eyes,an online platform for data visualizations. Using existing design patterns and data you canexperiment and create your own data visualizations. This is a great place to start for peopleworking with data visualizations for the firsttime.http://processing.org/Designing InterfaesVisualizing ocessingThis is the classic book about data graphics.Tufte explains the history and theory behinddata graphics using more than 250 great examples. This is a must have book for all peopleinterested in visualizing data.This is a brilliant book on User Interface Designwith handy information for people interested indata visualizations. Tidwell has a whole chapter dedicated to visualizing complex data inwhich she explains how to organize and displaydata effectively.Many EyesWebsitesInformation aestheticsThese are two websitesthat are frequently updatedwith great examples of datavisualizations and infographics. They showcase the bestexamples of data visualization out there.http://infosthetics.com/Visual Complexityhttp://www.visualcomplexity.com/vc/
22 Joel Laumansan introduction to VISUALIZING DATA 23Credits and thanksA large portion of this booklet is based on workdone by Edward Tufte, Ben Fry, and JenniferTidwell; three people which have done remarkable work for data visualization. Thank you.If you find this booklet interesting, please consider looking into the work of these people.I would also like to thank the following peoplefor reviewing previous versions of this bookletand giving me helpful feedback, I appreciate it.Nathan VerrilUser Experience Consultanthttp://www.linkedin.com/pub/1/150/135Bas LeursLecturer Interaction Design at the RotterdamUniversity of Applied Sienceshttp://www.linkedin.com/pub/0/330/308Peter van WaartLecturer and Researcher at the RotterdamUniversity of Applied Sienceshttp://www.linkedin.com/in/petervanwaart
as statistics, data mining, graphic design, et cetera. Ben Fry suggests a seven stage design process, reconciling all stages into a single process. 1. Aquire Obtain the data, whether from an Excel document, an XML feed, et cetera. 2. Parse Data will not always be organized ideally for visualizing it. Give your data structure by order-