Transcription
Altera Debug ClientThis tutorial presents an introduction to the Altera Debug Client, which can be used to compile, assemble,download and debug programs for Altera’s Nios II processor. The tutorial gives step-by-step instructions thatillustrate the features of the Altera Debug Client.The process of downloading and debugging a Nios II application requires the presence of an actual FPGAdevice to implement the Nios II processor. For the purposes of this tutorial, it is assumed that the user has accessto the Altera DE2 Development and Education board connected to a computer that has Quartus II (version 5.1 orhigher) and Nios II software installed.The screen captures in the tutorial were obtained using version 2.2 of the Altera Debug Client; if other versionsof the software are used, some of the images may be slightly different.Who should use the Altera Debug ClientThe Altera Debug Client is intended to be used in an educational environment by professors and students. Forcommercial system and application development, Altera’s Nios II Integrated Development Environment should beused.1
Contents1Installing the Altera Debug Client32Starting the Altera Debug Client63Configuring a Nios II System74Configuring a Nios II Program95Compiling and Loading the Program106Running the Program127Using the Disassembly Window128Single step149Using Breakpoints1510 Examining and Changing Register Values1711 Examining and Changing Memory Contents1912 Setting a Watch Expression2313 Examining the Instruction Trace2414 Using Configuration Files2615 Using the Terminal272
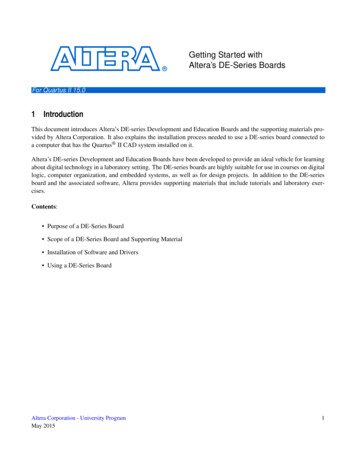
IntroductionThe Altera Debug Client is a software application that runs on a host PC connected to a Nios II System. It allowsthe user to compile or assemble Nios II applications, download the application to the Nios II system and thendebug the running application. The Debug Client provides functionality that allows the user to: Examine and modify register and memory contents. Disassemble the machine code present in any memory region. Single step through each assembly language instruction in the program. Set breakpoints that stop the execution of a program when certain instructions are reached or when certaindata addresses are accessed. Set watch expressions and watch their values at different points in the execution of the program. Examine a graphical view of an instruction trace that records the set of recently executed instructions. Perform terminal input/output via the JTAG UART component.1Installing the Altera Debug ClientTo install the Altera Debug Client, proceed as follows:1. Use Microsoft Windows Explorer to open the folder Altera Debug Client on the DE2 CD-ROM. Asshown in Figure 1, the folder will contain a single executable file named setup.exe.Figure 1. Altera Debug Client installer on DE2 System CD.2. Double-click on this setup.exe executable file. This will bring up the first screen of the installer as illustratedin Figure 2. Click on the Next button and proceed to the next step.3. The installer will display the License Agreement; click I Agree to continue.4. On the next screen, you can choose which components to install, as shown in Figure 3. Leave both components checked to install the Debug Client program files along with the tutorial and sample files needed forthis tutorial. Click Next to continue.5. The next screen will allow you to select a destination folder into which the installer will copy the DebugClient tutorial and its sample files. Click Browse to select a directory in your system. The directory that youspecify in this step will be referred to as TUTORIAL FILES throughout the remainder of this tutorial.For example, in Figure 4, the installation directory is d:\Debug Client Tutorial. Note that you do nothave the option of specifying the location where the Debug Client program files are stored; this location isdisplayed in the window of Figure 4, and is determined by the installation setup for the Nios II EmbeddedDesign Suite. Click Next to proceed to the next step.3
Figure 2. Altera Debug Client Install Wizard.Figure 3. Choosing which components to install.6. The installer is now ready to begin copying files. Click Install to install the Debug Client. During theinstallation process, you will be asked if you would like a shortcut to the Altera Debug Client to be placedon your Windows Desktop. Answering yes will install an icon similar to the one shown in Figure 5 on yourdesktop.7. Assuming that the install was successful, the screen shown in Figure 6 will be displayed. Click on theFinish button to complete the installation. Should an error occur, a window will suggest the appropriateaction. Errors include: Quartus II Software is not installed or the Quartus II version is too old. Nios II SDK Software is not installed or the version is too old.4
Figure 4. Specifying the installation location of the tutorial and sample files.Figure 5. Altera Debug Client desktop icon.Figure 6. Altera Debug Client installation finished.5
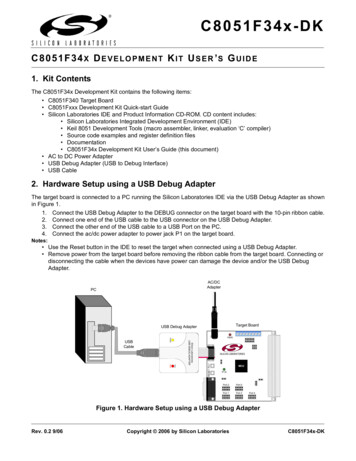
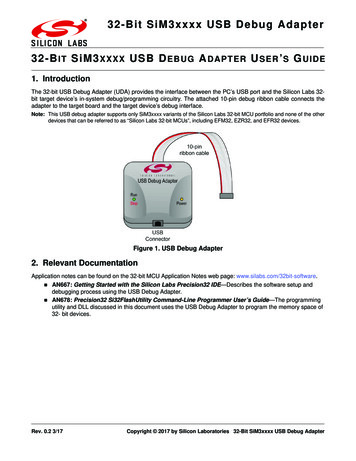
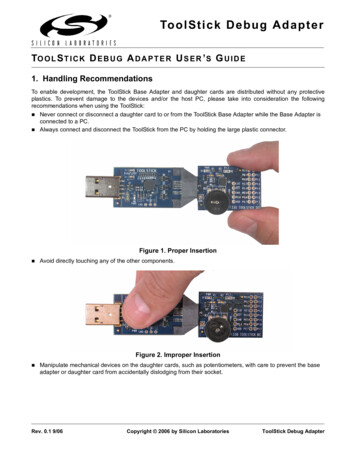
2Starting the Altera Debug ClientBefore starting the Altera Debug Client, a Nios II system has to be downloaded onto the DE2 Developmentand Education board using the Quartus II software. This tutorial assumes that the Nios II system located at TUTORIAL FILES \example\hw\example.sof is downloaded.The tutorial called Introduction to the Quartus II Software explains how to download a circuit onto the FPGAon the DE2 board and the tutorial called Introduction to the SOPC Builder tool shows you how to create Nios IIsystems. These tutorials are provided on the DE2 System CD and in the University Program section of Altera’sweb site and must be completed before using this tutorial.If you have chosen to install a Windows Desktop Shortcut, you can start the Altera Debug Client by doubleclicking on the desktop icon. The Debug Client can also be started from the Windows Start Menu by followingthe links from Altera Altera Debug Client Altera Debug Client.Another method to start the Debug Client is to use the Nios II Command Shell. Start the Nios II CommandShell from the Windows Start Menu by following the links from Altera Nios II EDS 6.0 Nios II CommandShell and enter the command altera-debug-client.After startup, the Debug Client will appear as shown in Figure 7.Figure 7. The Altera Debug Client at startup.6
3Configuring a Nios II SystemNios II systems have a user-configurable architecture. The designer may choose from a variety of peripherals andmemory options in Altera’s SOPC Builder. The Altera Debug Client needs information describing the Nios IIsystem that is being targeted in order to compile and load programs for the system. Systems created by Altera’sSOPC Builder are described by a .ptf file located in the Quartus II project’s main directory. This file containsinformation about all the peripherals connected to the Nios II processor, including the system memory map.To describe the Nios II system to the Debug Client, click the Nios II Configure system. menu item or clicktoolbar button. The Nios II System Configuration window will appear, similar to Figure 8. Proceed withthethe steps below to configure the example system.Figure 8. Initial Nios II System Configuration window.1. Select the cable from the Cable drop-down list that corresponds to the DE2 board. The DE2 board isconnected via a USB-Blaster cable.2. Click Browse. to display a window similar to Figure 9. Navigate to TUTORIAL FILES \example\hw\system.ptf, which is the system description file for the example system. Select system.ptf and click Load.Figure 9. Select system description file window.7
3. In the System Configuration window in Figure 8, click Load. The fields in the .text section and .datasection will now be enabled.4. Nios II programs are compiled into an Executable and Linking Format (ELF) file. This format supportssections, which can be used to divide a program into multiple parts, such as an executable code sectionand a data section. Each section has its own set of attributes, including memory location, alignment, andsize. The partitioning of a program into different sections is performed by the linker, which receives thisinformation via either a linker script or linker invocation arguments. The Altera Debug Client allows theuser to specify the linker arguments for two sections of the program, as described below. Each sectionwill be placed at the address value of base address of memory device start offset. If a start offset is notspecified, its default value will be zero.The .text section contains the program machine code. The .text section of the System Configurationwindow is used to place the machine code at different memory locations. Use the following settings: Memory device: memory/s1 (0h - 7fffh), corresponding to the on-chip memory of the NiosII system (this is the default and only choice in the example system.ptf that we are using) Start offset in device: 1000, corresponding to a 4096-byte offset into the on-chip memory to start the.text sectionThe .data section contains program data, such as variables or constants. The .data section of the SystemConfiguration window is used to place the data at different memory locations. Use the following settings: Memory device: memory/s1 (0h - 7fffh), corresponding to the on-chip memory of the NiosII system (this is the default and only choice in the example system.ptf that we are using) Start offset in device: 1000, corresponding to a 4096-byte offset into the on-chip memory to startthe .data section. Note that the .text and .data offsets are the same, which would lead toan overlap of the two sections in memory. However, because the two offsets are exactly the same,the linker script used to produce the program executable will instead automatically place the .datasection immediately after the .text section.5. If there is more than one terminal device available in the system, one can be chosen from the Terminaldevice list to be connected to the terminal in the Debug Client. In this example, jtag uart is the onlyterminal device present.6. Your system configuration should appear as shown in Figure 10. Click OK to save the system configuration.Figure 10. Nios II System Configuration window configured for the example system.8
4Configuring a Nios II ProgramBefore compiling and loading a program with the Debug Client, the desired source files must be specified. Toconfigure the program source files for this part of the tutorial, click the Nios II Configure program. menuitem or click thetoolbar button. The Nios II Program Configuration window will appear, similar to Figure 11.Figure 11. Initial Nios II Program Configuration window.Proceed with the following steps to configure the program:1. For this example, the Program type will be Assembly, so the field can be left at its default value. TheDebug Client also supports C programs and programs already compiled in ELF or SREC formats.2. Click Add. to display a window similar to Figure 12. The source file for this part of the tutorial is located at TUTORIAL FILES \example\sw\main tutorial src\main tutorial.s. Choose that file and click Select.Figure 12. Select source files window.3. The start symbol of an assembly-language program identifies the label that corresponds to the first instruction of the program. The default start symbol is start and this is the symbol that is used inmain tutorial.s.4. Your program configuration should appear as depicted in Figure 13. Click OK to save the program configuration.9
Figure 13. Nios II Program Configuration window configured for the example program.5Compiling and Loading the ProgramAfter successfully configuring the system and program, the program can be compiled and downloaded onto theDE2 board. There are three different commands that can be used to compile and/or load a program: Actions Compile menu item ortoolbar button:Compiles the source files into an ELF and SREC file. Build warnings and errors will show up in the Info &Errors window. The generated ELF and SREC files are placed in the same directory as the first source file. Actions Load menu item ortoolbar button:Loads the compiled SREC file onto the board and begins a debugging session in the Debug Client. Loadingprogress messages are displayed in the Info & Errors window. Actions Compile & Load menu item ortoolbar button:Performs the operations of both compilation and loading.In this example, the program has not yet been compiled, so it cannot be loaded (the Load option is disabled).toolbar button to begin the compilation andClick the Actions Compile & Load menu item or click theloading process. Throughout the process, messages are displayed in the Info & Errors window. The messagesshould resemble those shown in Figure 15.After successfully completing this step, your Debug Client display should look similar to Figure 16. At thispoint, the program is paused at its first instruction.Figure 14. A compiler error message.Compilation errorsDuring the process of developing software, you will likely encounter compilation errors. Error messages from theNios II assembler or from the C compiler are displayed in the Info & Errors window. An example of a compilererror message is shown in Figure 14. The file name and the line number corresponding to the source of the errorare displayed, in addition to an indication of the cause of the error. You may be able to deduce the real cause ofthe error from the message or you may need to do some additional searching.10
Figure 15. Compilation and loading messages (the Info & Errors window has been maximized).Figure 16. The Altera Debug Client window after loading the example program.11
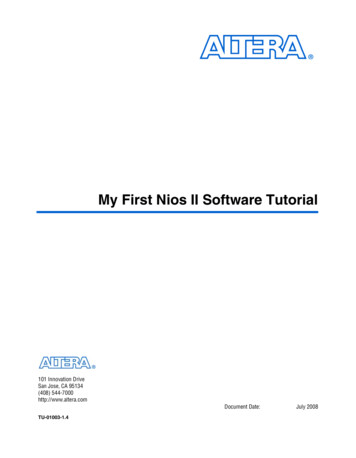
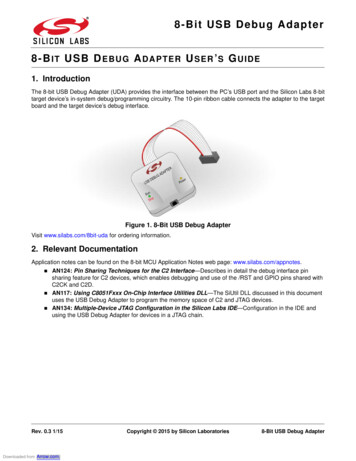
6Running the ProgramAs mentioned at the end of the previous section, the program is paused at its first instruction after it has beenloaded. To run the program, click the Actions Continue menu item or click thetoolbar button. The sampleprogram will continuously scroll the digits dE2 across the 7-segment displays on the DE2 board.The Continue command runs the program until something halts the processor’s execution, such as a breakpointor a forced user halt. To force the program to halt, click the Actions Stop menu item or click thetoolbarbutton; the processor will stop at the instruction to be executed next.When the program is stopped, all debugging windows are updated with new data. As seen in Figure 17, theDisassembly window highlights the next instruction to be executed in yellow and the Registers window highlightsregister values that have changed since the last program stoppage in red. The other windows in the Debug Clientare also updated, which will be shown in later parts of this tutorial.Figure 17. Disassembly window after the program has been stopped.7Using the Disassembly WindowThe Disassembly window displays human-readable machine code by interpreting the memory values as encodedinstructions. As shown in Figure 17, there are three columns in the window. The left-most column gives thememory address corresponding to the instruction displayed on that line. The middle column displays the 32bit instruction word corresponding to the machine encoding of the instruction. The right-most column displaysthe human-readable instruction along with the corresponding source code. For example, in Figure 17, the fourinstructions located at memory addresses 0x00001028, 0x0000102c, 0x00001030, and 0x00001034have been disassembled.The Disassembly window can be configured to display less information on the screen, such as not showing thesource code from the .s assembly language file or not showing the machine encoding of the instructions. These12
settings can be changed by right-clicking on the window and selecting the appropriate menu item, as shown inFigure 18. The display in the window also uses a color-coded scheme, as detailed in Table 1.Figure 18. Pop-up menu to configure the display of the Disassembly window.ColorBrownGreenBlueOrangeDark bluePurpleGrayDescriptionSource codeDisassembled instruction nameRegistersImmediate & offset valuesAddress values & labelsClickable linkMachine encoding of the instructionTable 1. Disassembly window color-coded scheme.By scrolling using the vertical scrollbar on the right side of the Disassembly window or by using a mouse scrollwheel, different regions of memory can be disassembled and displayed. It is also possible to scroll to a memoryaddress or an instruction symbol directly by using the Goto instruction panel in the Disassembly window. Accessthis panel through the Actions Goto instruction. menu item and enter a symbol name or an instruction addressin hexadecimal format. The instruction address must be a multiple of 4 because every instruction address is alignedon a 32-bit word boundary. For example, enter start or 1000 and press Go. The Disassembly window willshow the 0x00001000 address as its first instruction, as shown in Figure 19, which also corresponds to thestart symbol. Also note that the instruction is highlighted with a pink background.Figure 19. Goto instruction panel in the Disassembly window.Register and memory values can be examined in the Disassembly window while the program is in a Pausedstate. This is done by hovering your mouse over a register or a register offset in the window, as shown inFigure 20.The Disassembly window also produces special clickable links in its display of branch instructions. Clickingone of these links will display the instruction that the processor would jump to if the branch was taken. Figure 21shows one example of a link associated with a call instruction.13
Figure 20. Examining a memory value in the Disassembly window.Figure 21. A clickable link in the Disassembly window.Assembly Language and Machine InstructionsThe Disassembly window is a good place to examine what machine instructions are produced by the compiler fromyour assembly-language instructions or C code. The translation from assembly-language instructions to machineinstructions is handled by the Nios II assembler and it is a transparent process to the programmer. However, it isbeneficial to examine the disassembled code and compare it with the source code. This is readily done because theDebug Client displays both the source statements and the disassembled code in different colors. Observe that pseudoinstructions are implemented as different machine instructions. For example, the movia pseudoinstruction isimplemented by the two instructions orhi and ori, as shown at the address values 0000102c and 00001030,respectively, in Figure 17.8Single stepBefore discussing the single step action, it is convenient (for demonstration purposes) to restart execution of theprogram from the beginning. Click the Actions Restart menu item or click thetoolbar button to restartthe program. Notice that the pc register value displayed in the Registers window is 0x00001000 and theDisassembly window is highlighting that instruction.The Debug Client has the ability to perform single step actions. Each single step consists of executing a singlemachine instruction and returning control to the Debug Client. Note that if the program being debugged waswritten in C, each individual single step will still correspond to one assembly language instruction generated fromthe C code. The ability to step through statements in the high-level source code is not supported by the DebugClient; however, Altera’s Nios II Integrated Development Environment supports this advanced feature.The single step action is invoked by clicking on the Actions Single step menu item or by clicking on thetoolbar button. The instruction that is executed by the processor is the one highlighted by the Disassemblywindow before the single step.Since the first step in this section was to restart the program, the first single step will execute the instruction at0x1000, which will zero out the upper-16-bits of the sp register. Subsequent single steps will continue to executeone instruction at a time, in sequential order. Single stepping at a branch instruction may jump to a non-sequentialinstruction address if the branch is taken. You can observe this behavior by single stepping to 0x00001028,which is a call instruction. Single stepping at this instruction will set the pc value to 0x000011b0, which isthe location of the UPDATE HEX DISPLAY label.14
9Using BreakpointsBreakpoints are special conditions that are checked by dedicated hardware in the Nios II processor as the application is running in real-time. Breakpoints can be triggered in four different ways:1. Program execution has reached a particular address2. A read operation has been performed on a particular address3. A write operation has been performed on a particular address4. The processor has accessed the memory at a particular addressThis section of the tutorial will cover the process of setting an instruction breakpoint (trigger type 1). Thereare two ways to set an instruction breakpoint. The first method can be used to set a simple instruction breakpointas follows:1. Switch to the Disassembly window.2. Navigate to the instruction address that will have the breakpoint. For this example, display the check shiftinstruction label.3. Click on the gray bar to the left of the address 0000103c (address value of the check shift label) toset an instruction breakpoint at this location. See Figure 22 for an illustration of what a breakpoint in theDisassembly window looks like. Clicking the same location again will remove the breakpoint.Figure 22. Setting a simple instruction breakpoint in the Disassembly window.Once the instruction breakpoint has been set, run the program and the breakpoint should trigger when the pcregister value equals 0x0000103c. The Debug Client will look similar to Figure 23; notice the message in theInfo & Errors window indicating that an instruction breakpoint has been triggered.The second method of setting a breakpoint can be used for all four trigger types as follows:1. Switch to the Breakpoints window, which is shown in Figure 24.2. The breakpoint that was set earlier in the Disassembly window also appears in this window. The check markbeside the breakpoint can be used to enable or disable it. In this case, leave the check mark as it is.3. Right-click on the header corresponding to the breakpoint type you want to add. For example, to set abreakpoint that triggers when the processor writes to a particular address, right-click on the write watchpoints table, as shown in Figure 25.4. Click Add. A new entry will appear in the corresponding table. Enter the desired breakpoint address.The Debug Client also supports a more advanced form of a breakpoint, called a conditional breakpoint. A conditional breakpoint is an instruction breakpoint that only triggers when the usual instruction breakpoint conditionis met and an additional user-specified condition is met. For this example, you will use the same breakpoint frombefore but with the condition r2 0, which in this program’s context is when the scroll direction is to the left.The process to set this conditional breakpoint is as follows:1. Switch to the Breakpoints window.2. For the breakpoint at 0000103c, double-click on the table cell under the Condition column.15
Figure 23. The Debug Client after the breakpoint has been triggered.Figure 24. Breakpoints window.3. The window in Figure 26 will appear. This window contains information about the syntax used to describea condition. For this example type r2 0.4. Press Ok. The Condition field for the breakpoint will now show the condition you entered.The conditional breakpoint is now set. Run the program and as the dE2 digits on the hexadecimal displaydisappear and the program begins to shift the digits to the left, the breakpoint will trigger. The Info & Errors16
Figure 25. Adding a breakpoint, in this case a write watchpoint, in the Breakpoints window.Figure 26. Edit breakpoint condition window.window will again have a message about the cause of the breakpoint, including the trigger condition that wassatisfied, as shown in Figure 27.Figure 27. Message displayed in the Info & Errors window due to a triggered conditional breakpoint.10Examining and Changing Register ValuesThe Registers window displays the value of each register in the Nios II processor and allows the user to changemost of the register values. The number format of the register values can be changed by right-clicking in theRegisters window, as shown in Figure 28. You can choose among binary, octal, decimal, and hexadecimal representations in both signed and unsigned versions.Every time program execution is stopped, the debugger updates all of the register values and highlights anychanges in red. The user can also change the register values while the program is stopped.As a demostration of changing a register value, this section of the tutorial will set a breakpoint to halt theprogram when the hexadecimal display is showing .dE2. (. represents a blank) and the scroll direction isto the right. When the breakpoint is triggered, you will toggle the shift direction via the Registers window andthen resume program execution. The detailed steps are as follows:17
Figure 28. Changing the number format of the register values in the Registers window.1. Switch to the Breakpoints window.2. For the breakpoint at 0000103c, change the condition string to mem32(0x11fc) 0x0000de20&& r2 1. The mem32 syntax is used to read a 32-bit value from memory at the specified address.In this program, the 32-bit value at the address 0x11fc contains the value to be displayed that will betransferred to the hexadecimal display.3. Resume program execution and wait for the breakpoint to trigger.4. The Registers window should look similar to the left image of Figure 29. To edit the value of the r2 register,which controls the scroll direction, double click on its value in the window. This will bring up a text box, asshown in the right image of Figure 29, and you can put in its new value of 0.Figure 29. Register values after the breakpoint trigger; editing the value of the r2 register.5. Press Enter or click away from the text box to apply the change.6. Resume the execution of the program and you should see that the value on the hexadecimal display isscrolling left now.18
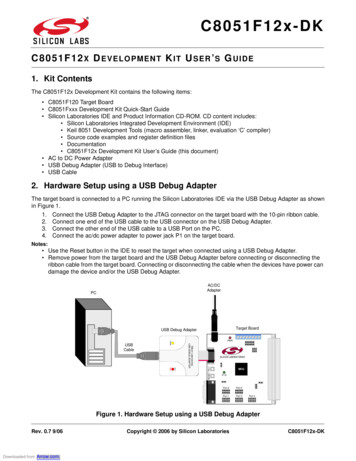
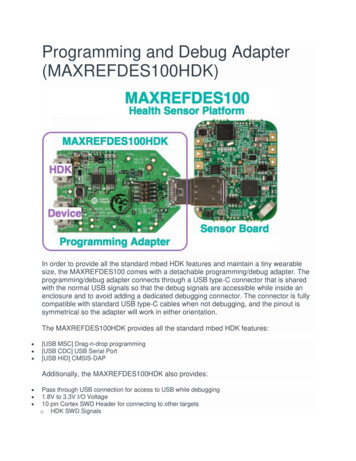
7. Eventually the conditional breakpoint that was set in step 2 will trigger again. Continue on to the nextsection of the tutorial when this occurs.11Examining and Changing Memory ContentsThe Memory window displays the contents of the system’s memory space and allows the user to edit its values.The memory display will look similar to Figure 30, with hexadecimal addresses in the left-most column andconsecutive values displayed horizontally. The numbers at the top of the window represent hexadecimal addressoffsets from the corresponding address in the left-most column. For example, referring to Figure 30, the addressof the last word in the second row is 0x00000010 0xc 0x0000001c.Figure 30. Example Memory window.The display is configurable by a number of parameters: Memory element size: the display can format the memory contents as bytes, half-words (2-bytes), or words(4-bytes). This can be configured from the context menu accessible by right-clicking on the Memorywindow, as shown in Figure 31.Figure 31. View as menu used to select the memory element size in the Memory window. Number of words per line: the number of words per line can be configured to make it easier to find memoryaddresses. This can be configured from the context menu accessible by right-clicking on the Memorywindow, as shown in Figure 32. Number format: this is similar to the number format option in the Register window. This can also beconfigured from the context menu accessible by right-clicking on the Memory window.19
Figure 32. Number of words per line menu in the Memory window. Display order: the display can display addresses increasing from left-to-right or right-to-left. Configure thisoption by right-clicking on the Memory window, as shown in Figure 33.Figure 33. Display order menu in the Memory window.Similar to the Disassembly window, you can view different memory regions by scrolling using the verticalscroll bar on the right or by using a mouse scroll wheel. There is also a Goto memory address panel in theMemory window analagous to the Goto instruction window. Click the Actions Goto memory address.menu item to display the Goto memory address panel. As shown in Figure 34, you can enter any address inhexadecimal, press Go, and the Memory window will display that address. In this example, display the 11f8address, which is where the buffer used by the program is stored.Figure 34. Goto Memory Address window.Since the program reads from this buffer and passes the value to the hexadecimal display, the value shown onthe hexadecimal display can be changed by changing the memory value. Proceed as follows:20
1. In the row starting at the address 000011f0, double-click the word under the 0xc column. This willbring up a text box to edit the word value at the address 000011fc.2. Type in abcd, as in Figure 35.Figure 35. Editing the value at the 000011fc memory address.3. Press Enter or click away from the text box to apply the memory change.Upon resuming program execution, you will see that the hexadecimal display is now scrolling abCd.Character displayThe Memory window can also be configured to interpret memory byte values as ASCII characters. This canbe done by checking the Show equivalent ASCII characters menu item, accessible by right-clicking on theMemory window, as shown in Figure 36.Figure 36. Checking the Show equivalent ASCII characters menu item.The right side of the figure shows a sample ASCII character display. Usually, it is more convenient to view thememory in bytes and characters simultaneously so that the characters appear in the correct sequence. This can beaccomplished by clicking the Switch to character mo
This tutorial assumes that the Nios II system located at TUTORIAL_FILES \example\hw\example.sof is downloaded. The tutorial called Introduction to the Quartus II Software explains how to download a circuit onto the FPGA on the DE2 board and the tutorial called Introduction to the SOPC Builder tool shows you how to create Nios II systems.