Transcription
Android PlatformDebugging andDevelopmentEmbedded Linux ConferenceEurope 2013Karim Yaghmour@karimyaghmourkarim.yaghmour@opersys.com1
These slides are made available to you under a Creative Commons ShareAlike 3.0 license. The full terms of this license are 0/Delivered and/or customized byAttribution requirements and misc., PLEASE READ: This slide must remain as-is in this specific location (slide #2), everythingelse you are free to change; including the logo :-)Use of figures in other documents must feature the below “Originals at”URL immediately under that figure and the below copyright notice whereappropriate.You are free to fill in the “Delivered and/or customized by” space on theright as you see fit.You are FORBIDEN from using the default “About” slide as-is or any of itscontents.You are FORBIDEN from using any content provided by 3rd parties withoutthe EXPLICIT consent from those parties.(C) Copyright 2013, Opersys inc.These slides created by: Karim YaghmourOriginals at: www.opersys.com/community/docs2
About Author of: Introduced Linux Trace Toolkit in 1999 Originated Adeos and relayfs (kernel/relay.c) Training, Custom Dev, Consulting, .3
Agenda1. Architecture Basics2. Development environment3. Observing and monitoring4. Interfacing with the framework5. Working with the AOSP sources6. Symbolic debugging7. Detailed dynamic data collection8. Benchmarking9. Summing up4
1. Architecture Basics Hardware used to run Android AOSP Binder System Services HAL5
6
7
8
9
10
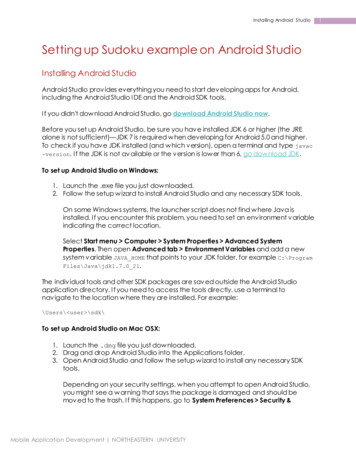
//hardware/libhardware/Manuf.-providedManuf. [DEVICE]/sdk/emulator/Kernel or module11
2. Development Environment Host / Target setup IDE / Editor Eclipse setup12
2.1. Host / Target setup13
14
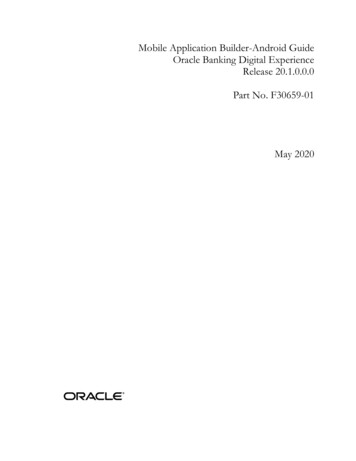
2.2. IDE / EditorLogos belong to their respective owners. This slide isn't CC-BY-SA.15
What if . ?16
2.3. Eclipse Setup Preparation Project importing AOSP fixups Browsing the sources17
2.3.1. Preparation AOSP Basics: Get AOSP . from Google or otherwise Extract if needed Configure, build, etc.Eclipse / ADT: Get ADT bundle from developer.android.com Extract Start and update and if needed18
Set up basic classpath file:[aosp] cp development/ide/eclipse/.classpath . Adjust eclipse.ini On my ADT bundle, it's:– adt-bundle-linux-x86 64-20130917/eclipse/eclipse.iniChange this:-XX:MaxPermSize 256m-Xms40m-Xmx768m To this:-XX:MaxPermSize 256m-Xms128m-Xmx768m19
2.3.2. Project importing Start Eclipse Create new "Java project" Project name your AOSP name Deselect "Use default location" Location path to your AOSP Click "Next" Wait a little bit . Click "Finish" Wait for it to build your project . it likely will fail .20
2.3.3. AOSP fixups Need to fix AOSP classpath file and sources Assuming 4.3 here Add this: classpathentry kind "src" path "frameworks/opt/timezonepicker/src"/ classpathentry kind "src" path "frameworks/opt/colorpicker/src"/ classpathentry kind "src" path "frameworks/opt/datetimepicker/src"/ classpathentry kind "src"path "frameworks/support/v8/renderscript/java/src"/ Remove this: classpathentry kind "src"path "frameworks/support/renderscript/v8/java/src"/ 21
Comment out a couple of things: ! Redefines android.util.pools which confuses Eclipse classpathentry kind "src" path "packages/apps/Gallery2/src"/ classpathentry kind "src" path "packages/apps/Gallery2/src pd"/ classpathentry kind "src"path "packages/apps/Gallery2/gallerycommon/src"/ ! classpathentry kind "src" path "packages/apps/Nfc/src"/ classpathentry kind "src" path "packages/apps/Nfc/nci/src"/ ! classpathentry kind "src" path "frameworks/ex/carousel/java"/ 22
Manually build the following (cd to and "mm") -or remove from keletonAppdevelopment/samples/Snake23
r2/DragLayer.java and modify:private boolean isLayoutRtl() { topublic boolean isLayoutRtl() { Now: right-click on project and select "Refresh"It might still show "x" on some parts until it's donerebuilding the project24
2.3.4. Browsing the sources Mouse-over object type to be taken to declaration Browse classes through “Outline” Browse Call Hierarchy View recently viewed files (Ctrl-e) Many other shortcuts, see: lIssues: Can't compile with Eclipse . still need “make” For Java only25
3. Observing and Monitoring Native Framework Overall26
3.1. Native schedtop librank procmem procrank showmap latencytop27
3.2. Framework dumpsys service28
3.3 Overall logcat dumpstate / bugreport watchprop / getprop29
30
4. Interfacing With the Framework start / stop service call am pm wm svc monkey setprop31
5. Working with the AOSP Sources You really need to check build/envsetup.sh Some tricks: godir croot mm m jgrep cgrep resgrepIt takes time to wrap your head around the tree32
6. Symbolic Debugging - basics33
6.1. DDMS / Eclipse integration Start DDMS: The one from the AOSP's command-line Not the one from Eclipse (“connection refuse”) It takes some time to load -- a few minutes Each process has a separate host-side socket Select the process you want to debug: It'll get port 870034
Go to Eclipse: Run- Debug Configurations- Remote JavaApplication Connection Type: "Standard (Socket Attach)" Host: localhost Port: 870035
6.2. Starting debug w/ Eclipse Order is finicky: Start your device or emulatorStart command-line DDMS before Eclipseotherwise you'll get this in logcat:"I/jdwp ( 411): Ignoring second debugger -- accepting anddropping" Start EclipseEclipse will complain that there's already a DDMSrunning. Ignore that.36
37
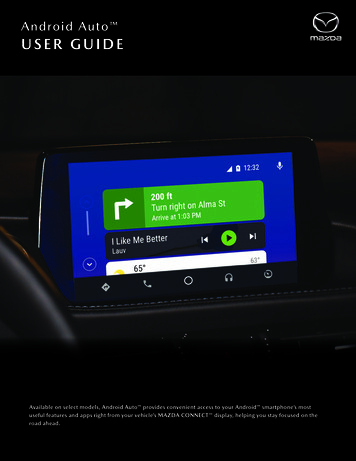
6.3. Debugging Select the process you want to debug in DDMSGo into Eclipse and click on the debug configuration youcreated earlierCheck that the little green bug is beside your process inDDMSAgain, things can look like they're freezing, this is "normal"for Eclipse .Wait for Eclipse to show your Dalvik process in the"Debug" *window* in the "Debug" *view* -- all threadsshould show38
39
6.4. Debugging multiple processes In the debug *view* of eclipse, click on "Debug"for every time you change the process inDDMSWait for that process' threads to load in thedebug viewOnce threads are loaded, you can actually startdebugging40
6.5. gdbserver - target side First, you'll need to make sure your C code iscompiled appropriately. Add this to Android.mk:LOCAL CFLAGS -ggdbLOCAL STRIP MODULE false Attaching to running process# gdbserver attach locahost:2345 30 Start app for debugging with gdbserver prepended# gdbserver localhost:2345 service list Forward the port on the host: adb forward tcp:2345 tcp:234541
6.6. gdb - host side Load file **FIRST** and then attach on host side prebuilts/gcc/linux x86/arm/arm eabi 4.7/bin/arm eabi gdbGNU gdb (GDB) 7.3.1 gg2Copyright (C) 2011 Free Software Foundation, Inc.(gdb) file out/target/product/generic/system/bin/service(gdb) target remote localhost:2345(gdb) b mainCannot access memory at address 0x0Breakpoint 1 at 0x2a00146c: file frameworks/native/cmds/service/service.cpp, line 59.(gdb) contContinuing.warning: Could not load shared library symbols for 11 libraries, e.g. /system/bin/linker.Breakpoint 1, main (argc 2, argv 0xbe882b74) at frameworks/native/cmds/service/service.cpp:5959 {(gdb) n60sp IServiceManager sm defaultServiceManager();(gdb) n59 {(gdb) n60sp IServiceManager sm defaultServiceManager();(gdb) n61fflush(stdout);42
6.7. Multi-threaded #FAIL prebuilts/gcc/linux x86/arm/arm eabi 4.7/bin/arm eabi gdbGNU gdb (GDB) 7.3.1 gg2.(gdb) add symbol file out/target/product/generic/system/lib/libandroid servers.so 0x4AFFC8B8add symbol table from file "out/target/product/generic/system/lib/libandroid servers.so" at.text addr 0x4affc8b8(y or n) y(gdb) add symbol file out/target/product/generic/system/lib/libc.so 0x400339B8add symbol table from file "out/target/product/generic/system/lib/libc.so" at.text addr 0x400339b8(y or n) y(gdb) target remote localhost:2345Remote debugging using localhost:2345ioctl () at bionic/libc/arch arm/syscalls/ ioctl.S:1010movr7, ip(gdb) b com android server power PowerManagerService.cpp:162Breakpoint 1 at 0x4b000a34: fileframeworks/base/services/jni/com android server power PowerManagerService.cpp, line 162.(gdb) contContinuing.Program terminated with signal SIGTRAP, Trace/breakpoint trap.The program no longer exists.43
Even if you try attaching to the specific thread in the system server runningthe system service you're trying to instrument, you'll get the same issue.Probably requires rebuilding gdbserver with thread support: l http://code.google.com/p/android/issues/detail?id 9713Issues seems to be solved in NDK but not in gdbserver in AOSP: roid.ndk/1212244
6.8. How to know what's theaddress of the library# cat /proc/[system sever PID]/maps grep android servers4aff5000 4b007000 r xp 00000000 1f:00 519/system/lib/libandroid servers.so4b007000 4b008000 r p 00011000 1f:00 519/system/lib/libandroid servers.so4b008000 4b009000 rw p 00012000 1f:00 519/system/lib/libandroid servers.so# cat /proc/[system sever PID]/maps grep libc.so40027000 4006c000 r xp 00000000 1f:00 601/system/lib/libc.so4006d000 4006f000 r p 00045000 1f:00 601/system/lib/libc.so4006f000 40071000 rw p 00047000 1f:00 601/system/lib/libc.so objdump h out/target/product/generic/system/lib/libandroid servers.so grep text7 .text00006ae8 000078b8 000078b8 000078b8 2**3 objdump h out/target/product/generic/system/lib/libc.so grep text7 .text0002f080 0000c9b8 0000c9b8 0000c9b8 2**34aff5000 000078b8 0x4AFFC8B840027000 0000c9b8 45
6.9. JTAG Requires hardware device Sometimes interfaces with gdb Not Android specific Some allow transparent kernel/user-space debug Don't know of any that go all the way up to Dalvik46
7. Detailed Dynamic Data Collection Logging ftrace perf47
7.1. Logging logcat is the most rapid/consistent way toobserve dynamic behavior. Trivial to add instrumentation points It just works .48
7.2. ftrace With 4.1, Google introduced systrace/atrace systrace is a Python script running on host side atrace is native Android binary systrace calls atrace via ADB atrace uses ftrace to capture kernel events Stack instrumented to feed events to ftrace Google's doc: html race.html49
50
. trouble is . I can't get it to work !*!@# &!#* ! Default goldfish kernel doesn't have ftrace Able to build ftrace-enabled kernel for goldfish Can trace that system . so long as I don't useatrace/systrace . WTF1?Not all Android kernels have ftrace enabledGenerates HTML file that can only be read byChrome . it doesn't work in Firefox. NIH?1: The AOSP sources define WTF as “What a Terrible Failure”. Wetrust they've done their research.51
. still . Have a look at these files: /external/chromium-trace/systrace.py /frameworks/native/cmds/atrace /frameworks/base/core/java/android/os/Trace.java /erameworks/native/include/utils/Trace.h /system/core/include/cutils/trace.h /frameworks/native/libs/utils/Trace.cppLook for: ATRACE* in c/cpp files Trace.traceBegin()/trace.traceEnd() in Java files52
# atrace helpusage: atrace [options] [categories.]options include: a appnameenable app level tracing for a comma separated list ofcmdlines b Nuse a trace buffer size of N KB ctrace into a circular buffer k fname,.trace the listed kernel functions nignore signals s Nsleep for N seconds before tracing [default 0] t Ntrace for N seconds [defualt 5] zcompress the trace dump async startstart circular trace and return immediatly async dumpdump the current contents of circular trace buffer async stopstop tracing and dump the current contents of circulartrace buffer list categorieslist the available tracing categories53
# atrace list categoriesgfx Graphicsinput Inputview View Systemwebview WebViewwm Window Manageram Activity Manageraudio Audiovideo Videocamera Camerahal Hardware Modulesres Resource Loadingdalvik Dalvik VM54
7.3. perf on Android on ARM55
8. Benchmarking56
0xbenchRL Benchmark: SQLAnTuTuBenchmark & TunningPassmarkA1 SD BenchVellamoQuick Benchmark LiteGeekbench23DRating benchmarkSunSpiderSmartbench 2011GLBenchmakrNenaMarkQuadrant Standard EditionRightware MarkNBenchEpic ch 2012SD ToolsRealPi57
9. Summing Up Works relatively well: logcat Eclipse / DDMS Framework toolsWorks ok: gdb/gdbserver native tools ftraceDoesn't work (for me): systrace/atrace perf58
10. Loose ends strace debuggerd tombstones anr traces59
Thank you .karim.yaghmour@opersys.com60
38 6.3. Debugging Select the process you want to debug in DDMS Go into Eclipse and click on the debug configuration you created earlier Check that the little green bug is beside your process in DDMS Again, things can look like they're freezing, this is "normal" for Eclipse . Wait for Eclipse to show your Dalvik process in the "Debug" *window* in the "Debug" *view* -- all threads