Transcription
USING DATA-DRIVEN MANAGEMENT TOIMPROVE WATER SERVICE PROVIDERPERFORMANCEA USAID Water and Sanitation Project Learning Note
Project Title:USAID Water and Sanitation ProjectSponsoring USAID Office:USAID/Haiti’s Office of Infrastructure, Engineering and Energy (OIEE)Contract r:DAI Global, LLCDate of Publication:15 March 2022Revision:Author:mWater and DAIThis publication was produced by the USAID Water and Sanitation project under Contract No. AID-OAA-1-14-00049/720521-18F00001 at the requestof the United States Agency for International Development. This document is made possible by the support of the American people through the UnitedStates Agency for International Development. Its contents are the sole responsibility of the author or authors and do not necessarily reflect the views ofUSAID or the U.S. Government.
Table of ContentsEXECUTIVE SUMMARY . 1INTRODUCTION AND BACKGROUND . 2APPLYING A DATA-DRIVEN APPROACH TO UTILITY MANAGEMENT . 3REVERSING THE SPIRAL OF DECLINE. 3WHAT IS DATA-DRIVEN MANAGEMENT? . 3THE UNIQUE DATA NEEDS OF WATER UTILITIES . 5DEMOCRATIZING ACCESS TO DATA ANALYTICS . 5MOBILE-FIRST DATA MANAGEMENT . 5DESIGN AND IMPLEMENTATION OF THE UTILITY DATA SYSTEM . 7DEFINING THE PROBLEM . 7STRENGTHENING PEOPLE AND PROCESSES . 8ALIGNING INCENTIVES. 10KEY PERFORMANCE INDICATORS . 10LEARNING AND ITERATION . 11USING DATA TO IMPROVE SERVICES .13BOTTOM UP RATHER THAN TOP DOWN . 13BUILDING A DATA-DRIVEN CULTURE. 14CONCLUSION .15REFERENCES CITED .16
Executive SummaryThe USAID Water and Sanitation Project in Haiti is afive-year (2017-2022), 47 million project to improveurban water and sanitation in Haiti. It works inpartnership with Haiti’s National Water andSanitation Authority (DINEPA), its regional offices(OREPAs), and local water utilities (CTEs) to improvethe performance of urban and rural water serviceproviders by using a data-driven managementapproach. This project initially targeted 5 utilities forsupport, but by the end of the project DINEPAdecided to expand the approach to all 27 urban waterutilities in Haiti. In this learning note, we define thekey elements of the data-driven model, discuss howthey were applied in Haiti, and share some insightsfrom the experience to help others apply a similarapproach.The percentage of households in Haiti with pipedwater into their dwelling declined between 1990 and20151. With flat tariffs and declining customer base,the water utilities were caught in a ‘spiral of decline,’common in many rapidly urbanizing countries thatlack the infrastructure and resources to providereliable service to all customers. Recent case studiesby the World Bank2 have shown that it is possible toreverse this decline by setting initially small goals orpublic commitments that can be accomplished withinexisting resources and delivering on them byrigorously monitoring performance against targets.This process also forms the basis of data-drivenmanagement.The core activity of data-driven management is theprocess of setting goals, measuring key outcomes, andusing this information to update assumptions and planfuture actions. Data-driven organizations mustaddress all the steps in the data value chain:generation, collection, processing, analysis, sharing,and use of information. Recent advances in mobileenabled software have democratized the tools ofdata-driven management, reducing the cost andexpertise needed to collect and analyze data. But themost important resources needed to adopt a datadriven approach are people and processes, which werestrengthened in Haiti using the strategies outlined inBox 1.Box 1. Strategies for building institutional capability tosupport data-driven management Clearly define the problems leading to poorservice delivery with stakeholders at all levels Strengthen people and processes to ensure thatdata is used by frontline workers Define a manageable set of no more than 10 keyperformance indicators Align incentives for staff around data collection Plan for multiple cycles of learning and iteration Take a bottom-up approach focused on theroutine day-to-day data needs of workers, which canbe aggregated to inform national indicators Build local data expertise in the private sectorand within the service provider Create a data-driven culture through monthlyindicator reviews, awards, and recognitionAn analysis of the support for improving data systemsprovided by the USAID Water and Sanitation Projectshows that at the beginning of the five-year effort,numerous workshops and trainings were conductedto build a shared understanding of problems andpotential solutions. In the final two years, this supportshifted to technical outputs, such as improvedsoftware functionality or integrations between datasystems, and one-on-one or small group technicalsupport provided by the local private sector dataconsultants trained by the project.We identified several factors that contributed to thesuccessful expansion of the data-driven managementapproach from a few utilities to a nationalperformance monitoring system. These includedeveloping a shared understanding of problems, theprocess changes required, and human resourcesneeded to address them, an iterative approach thatbuilds on quick wins and incorporates learning overtime, and the creation of a data-driven institutionalculture.Page1
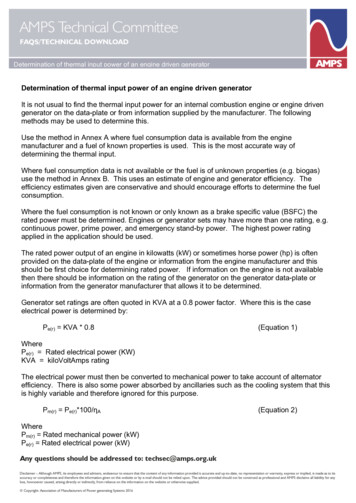
Introduction and backgroundIn establishing the Sustainable Development Goals,the United Nations High-Level Panel called for a ‘datarevolution’ that leverages mobile and other emergingtechnologies to enable real time monitoring ofdevelopment results3. Effective monitoring isconsidered one of the key building blocks of a strongwater, sanitation, and hygiene (WASH) sector and arecent review of external support programs forWASH found that at least 42% included activities tostrengthen monitoring and regulation4. Despite theemphasis placed on improved monitoring bygovernments and development partners, the datalandscape in most low-resource countries ischaracterized by failed or obsolete nationalmanagement information systems, national orregional mapping campaigns that have not beenupdated in years, and upwardly focused reportingsystems that do not provide useful data or insightsback to local decision-makers and water managers.The need for better informed decision-making in thewater sector is even more clear at the local level,where water service providers struggle with complexchallenges. Haiti, like many low-income countries, isnot on track to reach the Sustainable DevelopmentGoal (SDG) 6 target for safely managed drinkingwater services by 20301. In addition to commonsector challenges such as inadequate financing and alack of sufficient revenue to support routineoperations and maintenance, Haiti has experiencedmajor natural and human-caused disasters and shocks,including the earthquake near Port-au-Prince in 2010,Hurricanes Matthew and Irma in 2016 and 2017, aserious cholera outbreak, and the earthquake thatstruck the western peninsula of Haiti in 2021.In its efforts to reach SDG 6, Haiti is grappling with aproblem common in low-resource regions: the failureof designated service providers to provide reliablepiped water to residents, leading to a decline in thenumber of people who use piped water (Figure 1). Asa result, many Haitians have turned to the privatesector to purchase expensive bottled or truckedwater, or to less expensive water sources ofquestionable quality5. This trend has eroded publicconfidence in the ability of the government to providebasic services and threatens the progressiverealization of safely managed water services for all.Non-PipedPipedFigure 1. Access to piped and non-piped watersupplies in Haiti (WHO/UNICEF).The USAID Water and Sanitation Project is reversingthis decline in public services in Haiti by improving thecapacity and performance of public utilities andprivate sector partners, who are essential actors inthe delivery of services in rapidly growing urban andperi-urban areas of the country. Working inpartnership with DINEPA (the Haitian national waterand sanitation agency), regional water authorities, andutility managers and staff, the program works tostrengthensectorperformancethroughimprovements to operations, maintenance, andfinancial management.In this learning note, we present findings from one keyaspect of the USAID Water and Sanitation Project:the implementation of a data-driven model to drive aturn-around in public utility performance. We detailthe iterative, problem-driven approach taken todevelop this system and identify factors that lead tosuccessful use of data for decision-making in publicutilities.Page2
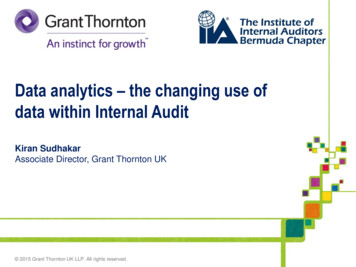
Applying a data-driven approach to utility managementTo most private sector businesses, the term “datadriven management” might be synonymous with“management.” The shift toward digital and cloudbased services to manage and derive value from datahas defined business and management trends over thepast two decades. Digital water utility solutions isalready a 5B per year market and is expected todouble by 20306. Yet many of these tools haveremained out of reach for low-income countries dueto a lack of financial resources to invest in datasystems and a gap in technical expertise andawareness among staff. Fortunately, this divide isbeing bridged by new cloud and mobile technologiescoupled with innovative business models that canimprove the performance of public service providers.In this section, we discuss the challenges faced byHaiti’s utilities, which are common to many utilities inlow-resource regions, and how a data-drivenapproach can help address them, as demonstratedthrough the USAID Water and Sanitation Project inHaiti.Reversing the spiral of declineWhen service quality is poor due to a lack of adequatewater supply or delivery capacity, citizens becomereluctant to pay user fees, choosing instead to investin private supplies or to tap illegal connections. Thisfurther reduces revenue that the service providerneeds to operate, maintain, and improve or expandwater services. This negative feedback cycle has beenreferred to as a “spiral of decline.” 7 When serviceproviders are stuck in this downward spiral, it isdifficult to derive value from their existing assets andnearly impossible to finance improvements because oftheir poor creditworthiness.While there are examples of utilities in low resourcecountries that have successfully turned around theirperformance, as documented by the World Bank 8and others 9,10, there are many more which have notyet managed to reverse the downward spiral ofservice. The challenge before the sector is to identifymechanisms that can reliably and demonstrablyinitiate virtuous cycles of increasing performance inpublic utilities under differing political and institutionalcontexts.Lowrevenuedue to poorservicesServicequalitydecreasesUsers investin privateinfrastructureRevenuefurtherdecreasesFigure 2. The "spiral of decline" leading to poorperformance (after Galaitsi 2016).The World Bank conducted in-depth case studies ofsuccessful utility turnarounds in low-resource settingsand used their findings to identify a common pathway(the Utility Turnaround Framework) that emphasizesusing currently available resources to set initially smallcommitments and then deliver on them, leading toincreased autonomy and implementation capacity forutility managers and staff. The tangible improvements,in turn, result in improved confidence and willingnessto pay on the part of customers, greater worthiness.One of the first actions that successful utilities takewhen implementing a turnaround is to upgrade themanagement information system (MIS), since having afunctioning data system is critical to understandinghow to target actions and then measure the changesthat result from these initial commitments. Thefoundational role played by data in successful utilityturnarounds inspired the USAID Water andSanitation Project team to implement a data-drivenapproach in Haiti.What is data-driven management?At its most basic level, data-driven management is theprocess by which an organization takes an action,Page3
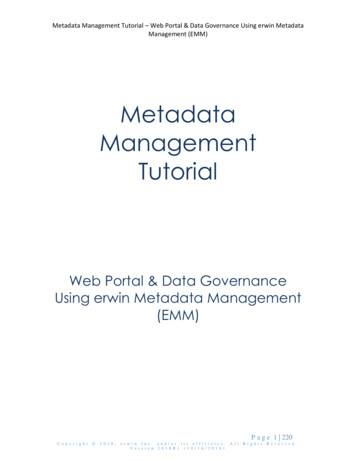
measures the results, and updates its assumptions andfuture actions in response to what happened. Datadriven management is a concept frequently used in thebusiness sector to describe both a process and acorporate culture of being “data-driven.” It hasparallels in the international development sector inthe emerging practices of adaptive management fordevelopment programming and problem-driveniterative adaptation for building state capability11.Becoming data-driven requires that an organizationcollect, analyze, and act on data to make decisions.Data-driven approaches rest on the foundation of arobust system to collect and interpret data aboutimportant outcomes. The data value chain is a usefulframework to help ensure that data is successfullycaptured and turned into actionable information.Much like a commercial product, data must beproduced, distributed, and used to create value.There have been various conceptualizations of thesteps in the data value chain and how they relate toderiving value from data 12–14. We defined a version ofthe data value chain for the water utility context(Figure 3) that reflects the circular feedback cycleinherent in data-driven management models, as wellas the asset management process that alyzeFigure 3. The data value chain model for turningdata into useful information.The key concept in putting the data value chain intopractice is to understand that the human andtechnological systems used to generate informationmust address every link in the chain. To begin with, keyevents that occur in the daily operations of the utilitymust generate data. For example, when customersmake a payment, this must be recorded in a ledger ordatabase that will allow the commercial office toupdate account balances and record the transactionas revenue. The organization also needs to collectthis data in some way that it can be used for analysis.This step may seem easy to perform with the widearray of mobile data collection apps now available, buteffective collection requires standard definitions thatare applied consistently across the organization orsector. Otherwise, useful data will become stuck atthe collection step.Data that is collected through different systems,including operations and maintenance logs,commercial accounting systems, and geographicinformation systems (GIS), often requiresprocessing before it can be analyzed. This caninclude review and validation by technical staff,aggregating by site or location, and formatting foranalysis. The more systems that are used by the utility,the more complex this step becomes. Large utilitiesoften require an entire office to keep the varioussystems of record for each data type in sync. For thisreason, there is a broad industry trend toward theconsolidation of these functions under a singleplatform or data center.Analysis is the process by which data aboutindividual events are transformed into information,often in the form of key performance indicators (KPIs).Digital technologies can help compensate for capacitygaps by automating the analysis process, avoidingbottlenecks that arise when others are waiting on ananalyst to update results. It is also increasinglycommon to couple the analysis process withmechanisms to share data in real time, throughonline dashboards, reports, and alerts. A utility oftenmust differentiate their reporting for differentaudiences, including internal staff, regulators andwater authorities, financial institutions and donors,and the public. Although managers may like to seevisually appealing dashboards showing KPIs across theorganization, often the most useful type of sharing isto provide specific data to frontline workers as theygo about their daily tasks. This can take the form ofalerts, filtered reports, and digital work orders.Page4
Finally, information only has value to an organizationif it can use it. While there has been much attentiondevoted to the value of data for planning and policy atthe district or national level, much of the progressmade toward better services comes in the form of“small wins,” or minor changes that agents make asthe result of learning16. Therefore, a key task in datause is to connect the primary agents to informationthat they need, when and where they need it.The unique data needs of water utilitiesAt the beginning of the USAID Water and SanitationProject, research carried out using the organizationalcapacity assessment tool (OCAT) methodology foundthat managers and staff were fully aware of their ownchallenges but lacked the specific information thatwould enable them to make changes. For example, anational cadastral exercise had been conducted tomap every water connection, but that data was notavailable to the utilities and was not integrated withthe commercial databases on billing and accountspayable.Many of the survey-based data collection apps used inthe WASH sector are not well-suited to the task ofactively managing and updating utility data, which haslimited the ability of utilities to use the data collected.Based on our user research in Haiti and with othermWater partners worldwide, we concluded that autility information system should have the followingcapabilities:---Ability to map and update physicalinfrastructure, including vertical assets (watersupply, storage, and treatment works) andhorizontal assets (pipes).Flexible form design and editing tools.Ability of staff to create new analyses andvisualizations without writing code.Import and export of data in useful formats,including XLX, CSV, and shape file.Capacity to automatically transfer data to andfrom other data systems, includingcommercial and accounting software.Localizable to different languages.-Unlimited data transfer capacity to ensuresustainability under local revenues.Industry standard security protocols, such asencrypted data transfer and role-based accesscontrols for different types of data.These core capabilities do not necessarily need to beprovided through a single digital platform, and oftenthey are not. However, if separate solutions fordifferent tasks are used then the organization needsto provide for the human resource capacity to keepthe data synchronized. The organization should alsodesignate a single “system of record” for each type ofdata to minimize conflicts.Democratizing access to data analyticsIn response to the high cost of commercialinformation technology and data analytics software,the information and communication technology fordevelopment (ICT4D) sector has developed opensource software and low-cost or free software-as-aservice (SaaS) delivered via the internet, often takingadvantage of the decreasing cost of accessing theinternet via mobile devices in developing countries.However, much of the ICT4D sector remains focusedon donor-driven projects and once-off interventions,rather than on supporting governments withgeneralized tools for data management.Early software tools developed for internationaldevelopment applications were focused on datacollection, rather than complete solutions for analysisand reporting. Recently, this has changed with theintroduction of integrated data managementplatforms such as DHIS2, mWater, and others. Withthese options available at little or no cost to users,technical assistance efforts of development partnerscan shift away from developing new software andtoward the challenge of how to effectively introducedata-driven approaches.Mobile-first data managementThe majority of internet users in low- and middleincome countries access the internet through amobile connection and 94% of the global populationPage5
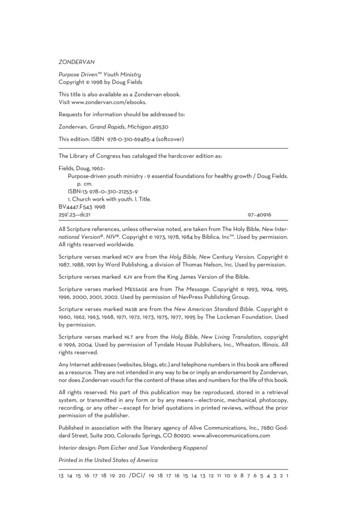
now lives in an area covered by a mobile broadbandconnection17. The rapid adoption of smartphones inthese contexts offers an opportunity to developmobile solutions that leapfrog traditional back-officedata management software models. A mobile-firstapproach, in which most or all data are available onthe mobile device, is also more resilient to commonissues such as unreliable electrical power and poorinternet connectivity during periods of peak demand.To help address the unique needs and challenges ofdata management in Haiti, the project selectedmWater because it was already a trusted platform inuse by government and donor organizations in Haitiand was cost effective, with no per-user or otherrecurring software fees. mWater operates a free andcentrally hosted data management platform thatprovides a mobile app for field agents to collect andview data, a web-based data management portal, andthe ability to deploy a custom managementinformation system (MIS) for use by all the staff of anorganization. The mWater platform already metmost of the requirements identified by DINEPAduring the problem definition phase. Where gaps infunctionality existed, the USAID Water and SanitationProject was able to work with mWater to developnew features that then became available to all120,000 users of the free mWater platform.This collaboration model helps to ensure thesustainability of the data systems because newprograms can build on past contributions and userscan influence the future evolution of the platform.That said, as we describe in the next section, thesustainability of a data-driven approach relies muchmore on the work done to align human capacity andorganizational processes than the technologyplatforms selected. Utilities should strive todocument the data model, operating procedures, andinterfaces involved in the management informationsystem so that it will be easier to move to a newtechnology platform in the future, if necessary.As a mobile-first technology, most of the corefeatures in mWater, such as creating or editing anasset or record, can be performed using the mobileapp, even when working offline or in areas with poordata coverage. This enables front line workers tomake changes directly to mapped infrastructure andcustomer data, rather than simply recording data thatmust be manually transferred to the back office. Thisensures that field staff always have the most up to dateinformation on their mobile device, allowing them tobring the appropriate spare parts and tools to the jobsite. The mobile-first approach also helps to increasebuy-in because the frontline workers can correctproblems themselves without needing support fromthe IT department.Figure 4. The mWater mobile app allows utilityworkers to view piped network infrastructure and addupdates or new connections.Page6
Design and implementation of the utility data systemIn this section we document the process used toimplement the data-driven utility managementapproach in Haiti. The implementation approach wasinformed by the literature on adaptive managementand Problem-Driven Iterative Adaptation (PDIA)18, aswell as lessons derived from lean and agilemanagement strategies that are more commonlyfound in the technology sector.The implementation process is summarized below inFigure 5. Each phase took roughly one year tocomplete and involved frequent workshops, fieldsupport visits, and specialized support from theproject team to help utilities with specific needs. Byproject end, the utility management system was fullyunder local control and rolled out to all 26 urbanwater utilities in Haiti.Figure 5. Implementation process for the WATSAN utility management system.Defining the problemProblem definition is too often neglected or rushed inthe design of water sector monitoring systems. Acommon mistake is to define the problem as the lackof a preferred solution or “best practice.” Yet, bytaking the time to define the context-specificproblems related to poor service delivery in Haitithrough dedicated workshops and site visits, ourpartners discovered a set of underlying causes thatwere related to data but also rooted in organizationalprocesses and staff performance. Identifying theseroot causes allowed the team to relate aspects ofpoor performance that they have observed forthemselves to an objective or desired outcome of thedata system, rather than simply imposing a set ofstandard sector indicators.Well-defined problems are helpful when dealing withcomplex challenges and uncertainty around the mosteffective policies. This is clearly the context in Haiti,where public service delivery has failed in most areasof the country and civil strife and natural disastersfrequently disrupt projects. This concept of using aproblem or crisis to build a shared vision for the pathforward is frequently taught and studied in the fieldsof political science and public management.In Haiti, problem definition was conducted throughmeetings with representatives from all levels of thefive initial participating utilities, the four regionalwater authorities that oversee them, and DINEPA. Ineach meeting, participants were encouraged toidentify management problems that intersect withdata and to prioritize them based on the severity ofthe problem and the potential to make progress on asolution. The technical team consolidated this focusgroup feedback, categorized the needs, and calculatedthe average priority ranking for each one. Theprioritized needs (Figure 6) were then presented tostakeholders for review and validation.Page7
Needs assessment rankings 14,00023Piped network and client management 12,000Commercial management system 10,000Water quality monitoring and reportingCustomer service systemMeter management4Leak management5-Year Total Cost for SoftwarePriority ranking (average)1Engineeringdesign tools 8,000Hydraulicanalysis tools 6,000 4,000GAP 2,0005Figure 6. Priority ranking of needs identified by utilityand water authority stakeholders in Haiti (lower scoremeans higher priority).The highest-ranking data management needs were forbetter piped network and client management toaddress the lack of effective revenue collection;improving the poor functionality rate of public kiosks;and improved commercial management to trackfinancial performance. Lower priority needs weremore focused on quality-of-service issues, includingwater quality monitoring, customer service, meterreading, and leak management.In response to the identified needs, the team carriedout a market landscape assessment to determine ifexisting software solutions could meet some of theseneeds, since the mWater platform lacked some ofthose functions at the time. The landscape assessmentfound that there were indeed high-quality, butexpensive, software solutions for piped networkmapping. However, there was a clear market gap forsoftware that could provide the more basicfunctionality required at an affordable cost (Figure 7).Although open source software is often described as“free,” the use these tools still result in significantcosts for the organization. These costs include hostingservices for server-based applications, IT support forfrequent updates and security patches; and trainingand technical support for staff. For example, the opensource QGIS application provides very advanced GIScapabilities, but it requires a high level of expertise tooperate and is not integrated with mobile apps.Free and opensource software 00246810121416Feature ScoreFigure 7. Landscape assessment for piped waternetwork mapping and analysis software. Featurescores were based on whether the solution offeredvari
enabled software have democratized the tools of data-driven management, reducing the cost and expertise needed to collect and analyze data. But the most important resources needed to adopt a data-driven approach are people and processes, which were strengthened in Haiti using the strategies outlined in Box 1.