Transcription
EXCEL ASSIGNMENT: PORTFOLIO RISK AND RETURNFinance 4385On December 31, 2007 you received 1,000,000 to invest for a client. You invested themoney in exactly four stocks (see stock assignments worksheet on course website), based onthe closing prices as of December 31, 2007, and held the stocks until December 31, 2014. OnDecember 31, 2014, you liquidated your positions, calculated your holding period return,and performed a statistical analysis on your investment results.The dataset (on website to be provided in class) contains monthly closing prices for each ofthe stocks, the monthly closing level (price) of the S&P 500 composite index, and the riskfree rate. In addition, dividends for the stocks are provided on a tab in the excel file.Please observe the following restrictions.1. You must invest at least 800,000 in your four stocks, with at least 100,000 in each ofthe stocks.2. You may not purchase fractional shares (shares are not divisible).3. Money not invested in stocks must be invested in the money market fund, whichyields 1.2% per year, compounded monthly (i.e., 0.1% per month).4. Stock dividends received will be deposited into the money market fund at the end ofeach month.5. You must pay commissions both when you open your position (buy) and close yourposition (sell). Commissions are 2% of the dollar value of shares bought or sold. Thereis no commission charge for the money market fund.Note: Your grade for this assignment does not depend in any way on how the stocks you’vechosen perform over the holding period.1 Page
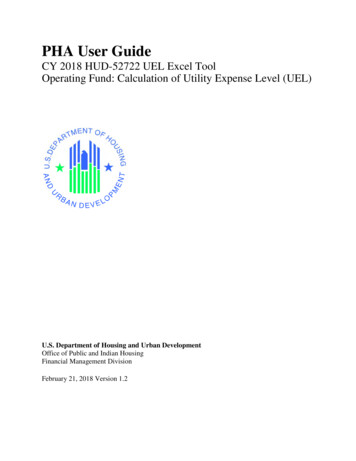
EXCEL ASSIGNMENT: PORTFOLIO RISK AND RETURNFinance 4385Complete assignments will include the following: Excel workbook with a neatly-formatted summary of all Calculations required in steps1 through 14, Worksheets with the regression output for your four stocks and your portfolio, and A Word document that includes a brief analysis of your results, including a comparisonof the individual stock results with those of the stock portfolio and market index Please name your Excel workbook as “FIN4385 Lastname.xls”.The portfolio calculations should print out on one neatly-formatted page that you would bewilling to present to your boss for discussion in a face to face meeting.To turn-in your completed assignment, please email the Excel file and the Word documentto me at mark.moore@ttu.edu before class on the due date. You MUST turn in a hard copyof the assignment write-up to me on the next business day after the due date.Your grade on this project will be determined primarily by the accuracy of your calculationsand the write-up of your analysis; however, grades will also reflect effectiveness of yourformatting scheme and the clarity with which results are presented.Group Interaction: Each member of the group must complete their own Excel workbook andwrite-up. However, I expect group members to work together and learn from each other onthe project. To facilitate this, I have assigned each member of the group the same stocks. Assuch, group members can compare the results of their calculations and resolve anydiscrepancies. Do not discuss this project with anyone outside your group.2 Page
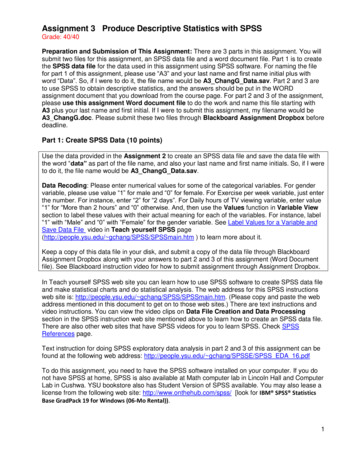
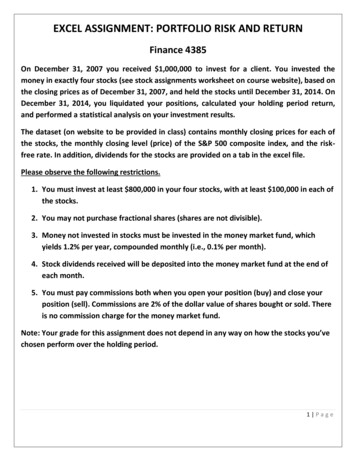
EXCEL ASSIGNMENT: PORTFOLIO RISK AND RETURNFinance 4385Calculations1. Construct a spreadsheet containing the monthly returns of the S&P 500 composite index(market index or M), your stocks’ end-of-month prices, dividends, and the risk-free rate usingthe data extracted from Yahoo Finance and the St. Louis Fed data in the FRED database.2. Calculate the monthly value of your stock portfolio. It does not include the MMF:where nI,t is the number of shares of stock i that you own at month t, and PI,t is the price ofstock i at month t.3. Compute the monthly return on each stock, and the stock portfolio. For each stock:where Pt is the price of the stock and is the monthly dividend. When dividends are paid, youshould invest them in the MMF.The return on your stock portfolio for month t is computed as:where Divt represents the dividend for the portfolio computed as:4. Calculate monthly excess returns for each stock, the stock portfolio, and the market index bysubtracting the risk-free rate from the monthly returns.3 Page
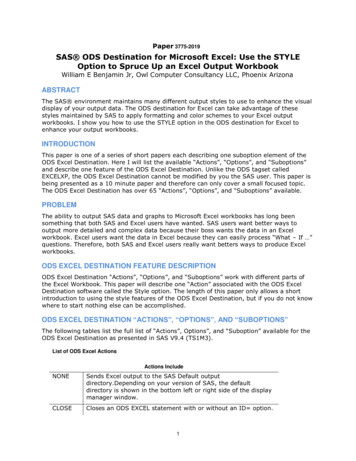
5. Calculate and report the monthly balance in the money market fund (don’t forget interestand dividends).6. Calculate the average return for each stock, for your stock portfolio, & for the market index:where T is the total number of months in the holding period. The equivalent function in Excelis AVERAGE.7. Calculate the average excess return for each stock, for your stock portfolio, and for the index:8. Calculate the variance and standard deviation of excess returns for each stock, the stockportfolio, and the market index:andThe equivalent functions in Excel 2010 are VAR.S and STDEV.S.9. For each of your stocks and stock portfolio calculate its covariance with the marketindex (use excess returns):The equivalent function in Excel 2010 is COVARIANCE.SNote: Excel’s COVAR function in Excel 2007 and earlier uses the formulaTherefore, if you use the Excel COVAR function, it will be necessary to multiply itsoutput by T/(T-1) to get the correct result, where T is the number of returns used inthe covariance calculation.4 Page
10.Calculate beta for each stock and the stock portfolio mathematically compute beta as:11.Calculate beta for each stock and the stock portfolio by regressing the respectiveexcess returns (Y-axis) on the market index excess returns (X-axis) (Note: select“residuals” for the next question).12.For any asset, Total Risk Systematic Risk Unique Risk. Total Risk is simply thevariance of the asset’s excess return, calculated in Step 8. Total risk is comprised oftwo components:andWhereis the variance of the residuals obtained from the regression results.For each stock, the stock portfolio, and the index, partition total risk into systematicrisk and unique risk:To calculate unique risk, calculate the variance of the residuals obtained in theregression results in Step 12.13.For each stock, your stock portfolio and the market index, express systematic risk andunique risk as a percentage of total risk:and5 Page
EXCEL ASSIGNMENT: PORTFOLIO RISK AND RETURNFinance 438514.Calculate holding period return on invested capital: Beginning Wealth is defined as the total initial investment which equals the beginningvalue of your stock portfolio, plus the beginning balance of the MMF, pluscommissions paid to purchase stocks. Ending Wealth is equal to the ending value of your stock portfolio (after commissionsare paid), plus the ending balance of the MMF. Report a) return for the entire holding period and b) Annualized average return. Theformula to calculate annualized average return is as follows: .6 Page
3. Compute the monthly return on each stock, and the stock portfolio. For each stock: where P t is the price of the stock and is the monthly dividend. When dividends are paid, you should invest them in the MMF. The return on your stock portfolio for month t is computed as: where Div t represents the dividend for the portfolio computed as: 4.