Transcription
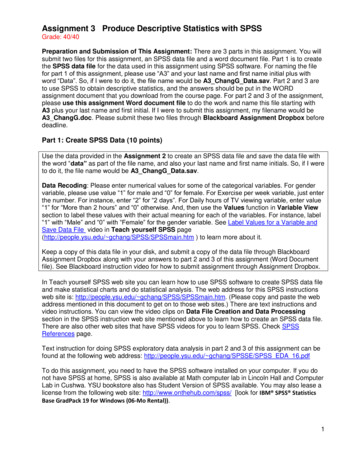
Assignment 3 Produce Descriptive Statistics with SPSSGrade: 40/40Preparation and Submission of This Assignment: There are 3 parts in this assignment. You willsubmit two files for this assignment, an SPSS data file and a word document file. Part 1 is to createthe SPSS data file for the data used in this assignment using SPSS software. For naming the filefor part 1 of this assignment, please use “A3” and your last name and first name initial plus withword “Data”. So, if I were to do it, the file name would be A3 ChangG Data.sav. Part 2 and 3 areto use SPSS to obtain descriptive statistics, and the answers should be put in the WORDassignment document that you download from the course page. For part 2 and 3 of the assignment,please use this assignment Word document file to do the work and name this file starting withA3 plus your last name and first initial. If I were to submit this assignment, my filename would beA3 ChangG.doc. Please submit these two files through Blackboard Assignment Dropbox beforedeadline.Part 1: Create SPSS Data (10 points)Use the data provided in the Assignment 2 to create an SPSS data file and save the data file withthe word “data” as part of the file name, and also your last name and first name initials. So, if I wereto do it, the file name would be A3 ChangG Data.sav.Data Recoding: Please enter numerical values for some of the categorical variables. For gendervariable, please use value “1” for male and “0” for female. For Exercise per week variable, just enterthe number. For instance, enter “2” for “2 days”. For Daily hours of TV viewing variable, enter value“1” for “More than 2 hours” and “0” otherwise. And, then use the Values function in Variable Viewsection to label these values with their actual meaning for each of the variables. For instance, label“1” with “Male” and “0” with “Female” for the gender variable. See Label Values for a Variable andSave Data File video in Teach yourself SPSS page(http://people.ysu.edu/ gchang/SPSS/SPSSmain.htm ) to learn more about it.Keep a copy of this data file in your disk, and submit a copy of the data file through BlackboardAssignment Dropbox along with your answers to part 2 and 3 of this assignment (Word Documentfile). See Blackboard instruction video for how to submit assignment through Assignment Dropbox.In Teach yourself SPSS web site you can learn how to use SPSS software to create SPSS data fileand make statistical charts and do statistical analysis. The web address for this SPSS instructionsweb site is: http://people.ysu.edu/ gchang/SPSS/SPSSmain.htm. (Please copy and paste the webaddress mentioned in this document to get on to those web sites.) There are text instructions andvideo instructions. You can view the video clips on Data File Creation and Data Processingsection in the SPSS instruction web site mentioned above to learn how to create an SPSS data file.There are also other web sites that have SPSS videos for you to learn SPSS. Check SPSSReferences page.Text instruction for doing SPSS exploratory data analysis in part 2 and 3 of this assignment can befound at the following web address: http://people.ysu.edu/ gchang/SPSSE/SPSS EDA 16.pdfTo do this assignment, you need to have the SPSS software installed on your computer. If you donot have SPSS at home, SPSS is also available at Math computer lab in Lincoln Hall and ComputerLab in Cushwa. YSU bookstore also has Student Version of SPSS available. You may also lease alicense from the following web site: http://www.onthehub.com/spss/ [look for IBM SPSS StatisticsBase GradPack 19 for Windows (06-Mo Rental)).1
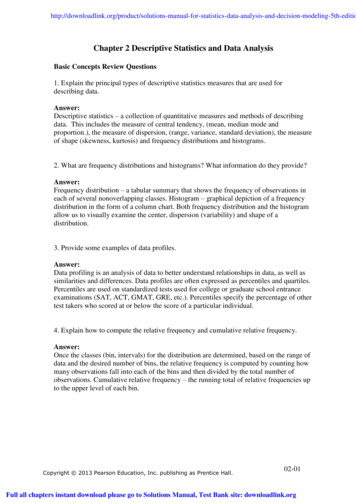
Tracy GeiselmanPart 2: Exploratory Data Analysis (20 points)In part 1 of this assignment, you have created an SPSS data file. This part of the assignment is touse that data file to perform the following tasks (make charts) using SPSS statistical software forexploring and understanding the data. For each chart below that you put in for answer, you mustalso label it with figure number and title and above each chart you need to write a sentence or twoto describe what you see in the chart. (See Example of Assignment 3 in this document.)1. Make a histogram for the Weight variable to display the distribution of this variable. (Use aclass width of 10.)Figure 1 below is a histogram for displaying the frequency distribution of the quantitativevariable weight (kg). The distribution for this graph is right skewed and multimodal.Figure 1: Histogram for Weight (kg)2. Make a frequency distribution table for the gender variable to see the frequency distributionand then make a bar chart.Figure 2 below is frequency distribution table for displaying the frequency distribution of thequalitative variable gender. The table shows that the distribution of females and males areequal.GenderFrequencyPercentValid ale1550.050.0100.0Total30100.0100.0Figure 2: Frequency Distribution Table for Gender2
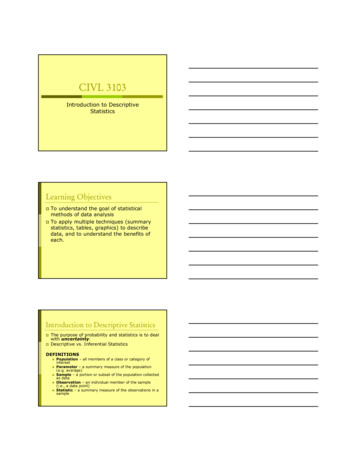
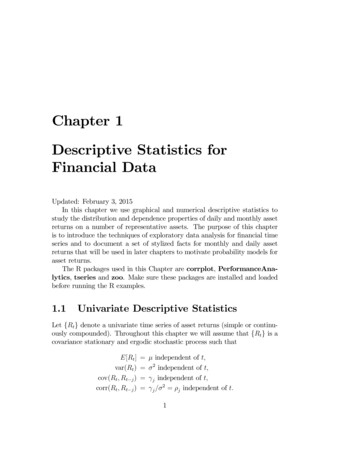
Figure 3 below is a bar chart for displaying the frequency distribution of the qualitative variablegender. The distribution of females and males is uniform.Figure 3: Bar Chart for Gender3. Make a cluster bar chart to examine the correlation between gender and Daily hours of TVviewing variables. (Use the Daily hours of TV viewing variable as the category axis andgender variable as the cluster variable.)Figure 4 below is a cluster bar chart for displaying the correlation between the qualitativevariable gender and the quantitative variable daily hours of TV viewing. The chart shows thatfemales are more likely to watch 2 or fewer hours of TV and males are more likely to watchmore than 2 hours of TV.Figure 4: Cluster Bar Chart for Gender and TV Viewing3
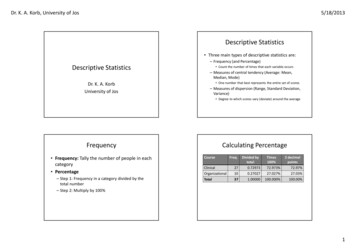
4. Make a scatter plot to examine the correlation between weight and height variables, andwrite a sentence to describe the trend you observed from the scatter plot.Figure 5 below is a scatter plot that shows the correlation between the quantitative variablesweight (kg) and height (m). The scatter plot shows that there is no correlation between thesetwo variables.Figure 5: Scatter Plot for Height (m) and Weight (kg)5. A quality control officer recorded the average length for a random sample of 10 of steel framesmade from a production line in (inches). The sample was taken one every hour. Produce a timeplot to display the trend.Year8 am9 am10 am11 am12 am1 pm2 pm3 pm4 pm5 pm6 pmAverage Length5.14.95.15.25.05.35.55.96.57.79.64
Figure 6 below is a time plot showing the quantitative variable of average length (in) of steelframes every hour. The time plot line is ascending, which indicates an increase over time.Figure 6: Time Plot for Average Length (in) of Steel FramesRemember that all graphs in your paper should be properly labeled with figure number and title, seeExample of Assignment 3. You should adjust the graph so that the graph is not too large in thedocument. To do so, after you have pasted the graph in MS-Word document, you can click on thegraph and move the mouse pointer to a corner of the graph, and click and drag the corner to adjustthe graph size.Grading:For each of the 5 questions above, if youprovide no answerprovide a chart with statement but are all not quite correctprovide a correct chart but no statementprovide a correct chart and statement but did not label with figure numberprovide a correct chart with proper statement and proper label0 points1 points2 points3 points4 pointsNotes:The web address for the SPSS text instructions on Exploratory Data Analysis is:http://people.ysu.edu/ gchang/SPSSE/SPSS EDA 16.pdfVideo instructions can be also found in SPSS References page for using SPSS and using MSWord for typing report.http://people.ysu.edu/ gchang/SPSS/SPSSmain.htmIf you have not used MS-WORD, this is the time to learn it. It is an important tool that you shouldknow for many good reasons. Feel free to see me or contact me for assistance in learning this wordprocessor.5
Part 3: Descriptive Measures (Please fill in your answers in this document.)(20 points)1) Find the overall mean, median and sample standard deviation of weight variable in this dataset.Sample Mean 61.804Sample Standard Deviation 17.858Sample Variance 318.892Sample Median 57.382) Does the distribution of the weight data for these children symmetrical belled-shape by lookingat the histogram?(Circle or underscore or red colored your answer)YesNo3) Report the percentage distribution of the Daily hours of TV viewing variable using the validpercentage distribution that do not include missing data.Hours of TV Viewing2 or fewer hoursMore than 2 hoursRelative Frequency51.7 %48.3 %4) Report the percentage distribution of Exercise Per Week variable using the valid percentagedistribution that do not include missing data.Exercise Per Week0 Days1 Days2 Days3 Days4 Days5 Days6 Days7 DaysRelativeFrequency20 %13.3 %13.3 %6.7 %20 %6.7 %6.7 %13.3 %5) Does the weight data suggest that it was from a normally distributed population? Perform anormality test and report the p-value of the test using .05 or 5% as the cutoff for decisionmaking of the normality test.Report the p-value from the Shapiro-Wilk’s normality test and it is: 0.000Your conclusion on the normality is (type your answer using less than 30 words):According to the normality test, since the p-value from the normality test is 0.000, the datasuggests that weight data is not likely from a normally distributed population.6) Report the mean, median and sample standard deviation of weight variable for femalesubjects in this data set.Sample Mean 59.389Sample Standard Deviation 18.584Sample Median 52.16Notes:6
A test of normality video is in the following link:http://people.ysu.edu/ gchang/SPSS/One Quant.htmlRemark: Charts and tables should always be properly numbered and labeled. See examplebelow which will be the format of your all other future SPSS projects.Example of Assignment 3: Descriptive Statistics1. Figure1 below is a bar chart for displaying the distribution of the qualitative variableGender. The frequency of the females is more than that of e 1: Bar Chart for Gender2. The figure below is a histogram for the quantitative variable of height. The distributionseems slightly skewed to right.Figure 2: Histogram for Height (m)7
Few tips on MS-WORD1) UseCtrl Alt (press them at the same) to type superscript, and do thesame to go back to normal text. Example: X 22) UseCtrl to type subscript, and do the same to go back to normal text.Example: X23) For Greek letters and math symbols, from the MS-WORD menu bar, click and selectthrough the following sequence: Insert / Symbol. You can insert symbols like: and more 4) Click and select through the following sequence for inserting page number:Insert / Page Number 5) Click and select through the following sequence to produce a mathematical equationwith mathematical symbols: Insert / Object / EquationnExample: i 1xiThere are more to explore in MS-WORD. You should start getting use to using a wordprocessor to write your projects and papers.8
Assignment 3 Produce Descriptive Statistics with SPSS Grade: 40/40 Preparation and Submission of This Assignment: There are 3 parts in this assignment. You will submit two files for this assignment, an SPSS data file and a word document file. Part 1 is to create the SPSS data file for the data used in this assignment using SPSS software. For .