Transcription
MegaStat User’s GuideJ. B. OrrisButler UniversityCopyright 2014 by J. B. Orris
Table of Contents1. Basic Procedures . 2Buttons . 4Data Selection. 5Entering values. 6Data Labels . 6Output . 7Repeat Last Option . 7Generate Random Numbers . 7Utilities . 7Insert descriptive information .7ChartDataSheet utilities .8Start new output sheet .8Delete output sheet .9Remove MegaStat .9Uninstall MegaStat .9Help/Information . 10Help System .10About MegaStat .102. Tutorial Examples . 11Example 1: Frequency distribution – selecting data . 11Example 2: Normal Distribution – entering values; modifying output . 15Example 3: Entering Proportions . 213. Reference. 22Descriptive Statistics . 22Frequency Distributions . 24Quantitative .24Qualitative.25Probability . 27Counting Rules .27Discrete Probability Distributions .28Continuous Probability Distributions.28Normal Distribution .29t Distribution.30ii
F Distribution .31Chi-square Distribution .32Confidence Intervals / Sample Size . 33Confidence interval – mean .33Confidence interval – p .33Sample size –mean .33Sample size – p .34Sample size –mean, p, and mean with specified and .34Hypothesis Tests. 35Mean vs. Hypothesized Values .35Compare Two Independent Groups .36Paired Observations .36Proportion vs. Hypothesized Value .37Compare Two Independent Proportions .37Chi-square Variance Test .38Analysis of Variance . 39One-Factor ANOVA .39Randomized Blocks ANOVA .40Two Factor ANOVA .41Correlation / Regression . 42Scatterplot .42Correlation Matrix .43Regression Analysis .44Predictor values from worksheet cells . 44Type in predictor values . 45Select Options: . 45Select Residuals options . 46Time Series / Forecasting . 47Trendline Curve Fit .47Deseasonalization .48Moving Average .49Exponential Smoothing .49Simple Exponential Smoothing .49Two-factor Exponential Smoothing .50Chi-Square / Crosstab . 51Contingency Table .51Crosstabulation .52iii
Goodness of Fit Test .53Nonparametric Tests. 54Sign Test .54Runs Test for Random Sequence .54Wilcoxon – Mann/Whitney Test.55Wilcoxon Signed Ranks Test .55Kruskal – Wallis Test .56Friedman Test .57Kendall Coefficient of Concordance .57Spearman Coefficient of Rank Correlation .58Fisher Exact Test .58Quality Control Process Charts . 59Control chart for variables (Xbar and R chart) .59Control chart for proportion nonconforming (p chart) .59Control chart for number of defects per sample (c chart) .59Generate Random Numbers . 60Appendix A. Accessing MegaStat with Excel 2003 . 61Appendix B. An Alternate Method of Accessing MegaStat . 62Appendix C. MegaStat Installation and Start-up (Windows) . 63Appendix D. MegaStat Installation and Start-up (Mac) . 68iv
MegaStat User’s GuideJ. B. Orris, Ph.D.Butler UniversityMegaStat12 is an Excel add-in that performs statistical analyses within an Excel workbook.After it is installed it appears on the Excel Add-Ins ribbon and works like any other Exceloption. The purpose of this User’s Guide is to introduce you to how MegaStat works. Thefirst chapter will describe the general operating procedures and conventions that arecommon throughout MegaStat. The second chapter will work through a few tutorials. TheReference section shows the dialog boxes for all of the options and notes briefly whatdata/input is expected and any unique aspects of each option. If you do not already haveMegaStat installed, Appendix C describes the installation and startup procedures.While MegaStat is an excellent tool for learning statistics, this document focuses on usingMegaStat and is not intended to teach statistics. Indeed, it assumes that you know what thevarious procedures do and are familiar with the terminology. It also assumes you have abasic working knowledge of Excel.1MegaStat a registered trademark of J. B. Orris. Excel is a registered trademark of Microsoft.This document was written for version 10.1 and later of MegaStat; however, most of it will berelevant for other versions also.21
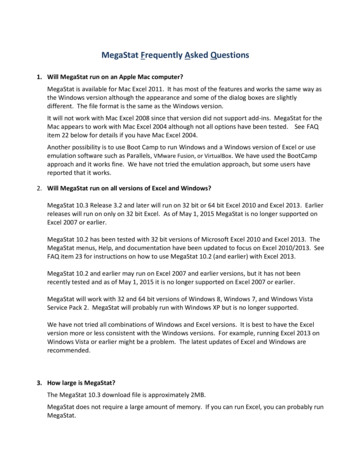
1. Basic ProceduresThis guide is written for Excel 2007, Excel 2010, and Excel 2013. (See Appendix A if youhave Excel 2003 or earlier.) The screen shots in this guide are from Excel 2010, but Excel2007 and 2013 are very similar. The only visual difference between Excel 2007 and Excel2010/2013 is the Office Button of Excel 2007 is replaced by a File tab on Excel 2010/2013:Excel 2007:Excel 2010 & Excel 2013:MegaStat also works with Excel 2011 on Apple Mac computers. (See Appendix D if youhave Excel 2011 on a Mac.) The Mac version has all of the options and features of theWindows version although some dialog boxes have minor differences in appearance. Thescreenshots in this guide are from the Windows version, but they will look very similar on aMac.With Excel 2007/2010/2013 you access MegaStat from the Add-Ins tab. After MegaStathas been installed it will appear on the Add-Ins ribbon. If you have installed other add-ins,they will also be on the ribbon. When you click the Add-Ins tab, your screen should looksimilar to Figure 1. The colors, fonts, and general appearance may be different on yourcomputer depending on the version of Windows & Excel you have and the color schemesyou have selected.Add-Ins tabMegaStat onthe Add-InsribbonFigure 1. Excel with Add-Ins tab selected.2
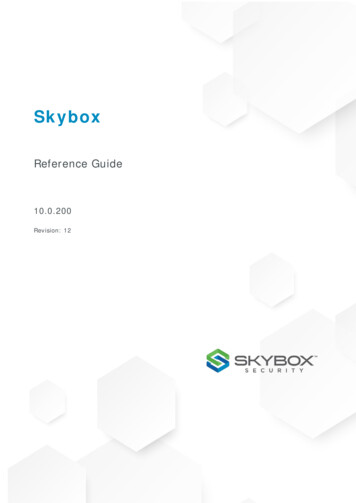
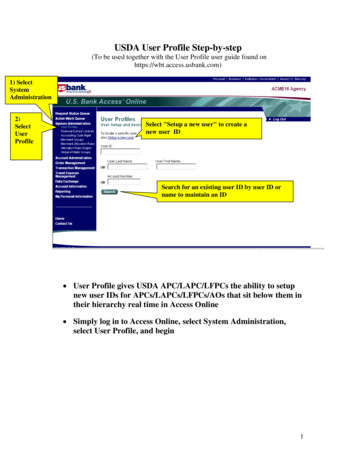
Appendix B shows an alternate method of accessing MegaStat from the Quick AccessToolbar.When you click on MegaStat in the Add-ins list, the MegaStat menu appears (Figure 2).Most of the menu options display sub-menus. If a menu item is followed by an ellipsis ( )clicking it will display the dialog box for that option. Figure 2 shows the sub-menu for theFrequency Distributions option.MegaStatsub menuMegaStatmain menuFigure 2. MegaStat main menu and a sub menu.A dialog box allows you to specify the data to be used and other inputs and options.Figure 3 shows a typical dialog box. After you have selected the data and options you clickOK, the dialog box disappears and MegaStat performs the analysis.3
Figure 3. MegaStat dialog boxBefore we look at specific dialog boxes let’s take a minute to look at some items that arecommon to all of the options. MegaStat use is intuitive and very much like other Exceloperations; however, there are some features unique to MegaStat and some ways to makeusing it more efficient so it will be worth your time to look at the following materialButtonsEvery dialog box has the four buttons shown on Figure 3.OKThis button could also be labeled “Calculate”, “Go”, “Execute” or “Do it”. Ittells MegaStat that you are done specifying inputs and you are turningcontrol over to it to do its thing. First your input values are validated and thenthe dialog box disappears and the output worksheet is displayed. When thedialog box disappears, it is still in memory and will contain the same inputs ifrecalled later.ClearThis button removes all input values and resets any default options on theform.CancelThis button could be labeled “Never mind”. It simply hides the dialog box.The dialog box is not cleared or removed from memory until you exit Excel.Dialog boxes do not take much memory and there is no problem with havingseveral of them in memory. However, if you really want to unload the form,click the “X” in the upper right corner of the form.HelpAs you have guessed, this button displays context sensitive help for theactive dialog box. If you want to see the full Help System, use the Helpselection on the main menu.4
Data SelectionMost MegaStat dialog boxes have fields where you select input ranges that contain thedata to be used. Input ranges can be selected four ways:1. Pointing and dragging with the mouse (the most common method).Since the dialog box “pops-up” on the screen it may block some of your data.You can move dialog boxes around on the screen by placing the mouse pointerover the title bar (colored area at the top), clicking and holding the left mousebutton while dragging the dialog box to a new location. You can even drag itpartially off the screen.You will also notice that when you start selecting data by dragging the mousepointer, the dialog box will collapse to a smaller size to help you see theunderlying data. It will automatically return to full size when you release themouse button. You can also collapse and uncollapse the dialog box manually byclicking the Collapse button at the right end of the field. Clicking the buttonagain will uncollapse the form. (Do not use the ‘X’ button to uncollapse a form.).2.Using MegaStat’s AutoExpand featurePointing and dragging to select data can be tedious if you have a lot of data.When you drag the mouse down it is easy to ‘over-shoot’ the selection and thenyou have to drag the mouse back until you get the area correctly selected.AutoExpand allows rapid data selection without having to drag through theentire column of data. Here is how it works: Make sure the input box has the focus. (Click in it or tab to it.) An inputbox has the focus when the insertion pointer is blinking in it. Select one row of data by clicking in one cell of the column you want. Ifmore than one column is being selected, drag the mouse across thecolumns. The data range will expand to include all of the rows in the region whereyou selected one row when you do one of the following:oDouble-click over the input fieldoRight-click over the input fieldoLeft-click the label next to input box.With a little practice you will find this is a very efficient way to select data. Theonly time you cannot use it is when you want to use a partial column of data.You should also be aware that the AutoExpand stops when it finds a blank ornon-numeric cell; thus any summations or other calculations at the bottom of acolumn would be selected. It is good practice to leave a blank cell at the bottomof each column before inserting formulas or text.Note: When using the above methods of data selection you may selectvariables in an alternate sequence by holding the CTRL key while makingmultiple selections and then do the AutoExpand.3. Using the cursor movement keys.5
If you use the arrow keys when the input box has the focus, you will see thecurrent cell address in the box. Move the cell to the start of the range you wantand then hold the shift key to move to the end of the range.You can use CTRL-arrow to quickly jump to the end of a range.4. Typing the name of a named range.If you have previously identified a range of cells using Excel’s name box, youmay use that name to specify a data range in a MegaStat dialog box. Thismethod can be very useful if you are using the same data for several differentstatistical procedures.5. Typing a range addressYou may type in any valid Excel range address, e.g. B5:B43. This is the leastefficient way to specify data ranges but it works.Entering valuesIf an input box requires a single value, you may do one of the following (make sure theinsertion cursor is blinking in the box): Type a value into the box. If an input box has a data selection button (as shown below) that means that, inaddition to typing in a value, you may also select an existing value from a cell.Data selection buttonClick on any Excel cell that contains a value. When you click on a cell, the celladdress is shown in the input box. If you double-click the input box the address willchange to the value in the cell. Type any formula that you could be entered into a cell. You do not have to type the‘ ’ sign as you would in an Excel cell. Type a cell address, e.g. B6, or the name of a named cell.Data LabelsFor most procedures the first cell in each input range can be a label. If the first cell in arange is text it is considered a label; if the first cell is a numeric value it isconsidered data. If you want to use numbers as variable labels you must enter thenumbers as text by preceding them with a single quote mark e.g. ‘2. Even though Excelstores times and dates as numbers, MegaStat will recognize them as labels if they areformatted as time/date values.If data labels are not part of the input range, the program automatically uses the cellimmediately above the data range as a label if it contains a text value.If an option can consider the entire first row (or column) of an input range as labels, anynumeric value in the row will cause the entire row to be treated as data.6
If the program detects sequential integers (1,2,3 ) in a location where you might wantlabels it will display a warning message otherwise the rule is: text cells are labels,numeric cells are data3.OutputWhen you click OK on a MegaStat dialog box it performs some statistical analysis andneeds a place to put its output. It looks for a worksheet named Output. If it finds one it goesto the end of it and appends its output; if it doesn’t find an Output worksheet it creates one.MegaStat will never make any changes to the user’s worksheets, it only sends output to itsOutput sheet.MegaStat makes a good attempt at formatting the output but it is important to rememberthat the Output sheet is just a standard Excel worksheet and can be modified in any way bythe user. You can adjust column widths and change any formatting that you think needsimprovement. You can insert, delete and modify cells. You can copy all or part of the outputto another worksheet or to another application such as a word processor.MegaStat charts get their values from cells on the Output sheet (or one of your worksheetsin the case of the Scatterplot). You can click a chart and select ‘Source Data’ to see whatvalues are being displayed.When you click a chart the MegaStat menu item will disappear from the main menubarsince the Chart menu becomes active. Click outside the chart to bring back the main menuthat contains the MegaStat menu item.When the program generates output it adjusts column widths for the current output. If youhave previous output from a different option already in the Output sheet, the column widthsfor the previous output may get messed up. You can attempt to fix this by manuallyadjusting the columns widths or by always starting a new output sheet.The Utilities menu has options for deleting the Output sheet or making a copy of it andstarting a new one.Repeat Last OptionOnce you have performed a MegaStat option, this menu selection will allow you to redisplay the last dialog box without having to go through the menu selections. This can behandy if you need to make a change or when you need to repeat the same operation withthe different data sets.Generate Random NumbersThis option allows you to create random numbers. It is described on page 49.UtilitiesThe Utilities menu contains some items that perform useful functions.Insert descriptive informationThis option is used for identifying output. It will insert rows with labels forDescription, Name, Data source, Time and Version. You then use the adjacent cells3An exception is the Crosstabulation option that can count text data.7
to type in the appropriate information. Figure 9 in the next chapter shows an Outputsheet after clicking this option.The Data source line will show the name and location of the active workbook andthe most recently accessed worksheet. The Time entry with show the currenttime/date and the version of MegaStat.This option is not limited to MegaStat output sheets – it can be used on any Excelworksheet.ChartDataSheet utilitiesIn order to display a graphical output (e.g., a chart) Excel must reference values in aworksheet. If the values are not available as a part of the output sheet, MegaStatstores them in a hidden worksheet called “ChartDataSheet ”. If MegaStat needs aChartDataSheet it creates one unless one already exists, in which case it appendsits values to the end.The following options use ChartDataSheets:Descripitive Statistics – BoxPlotRegression Analysis – Plot residuals by X valuesRegression Analysis – Normal Probability PlotQuality Control Process ChartsIn general you do not need to be concerned with ChartDataSheets; however, thefollowing utilities exist for advanced users.ViewChartDataSheets exist only to provide values to charts and thus the output isnot labeled. However, at the top of each output section is a label telling whattype of chart it is used for and a time/date stamp. Under the correspondingchart there is also a time/date stamp so you can associate the data with achart.If you change or delete any of the values on ChartDataSheet thecorresponding chart will be changed.HideThis will hide the ChartDataSheet after viewing it. You can also use Excel’sFormat Sheet command to view/hide ChartDataSheets.DeleteYou would use this option if you wanted to delete a ChartDataSheet that nolonger has any associated charts. If you delete a ChartDataSheet that has anexisting chart, the chart will still exist but will not have any values plotted.There is no UnDo so make sure before you click OK.Start new output sheetIf there is an existing Output sheet it will be renamed Output(2) so that your nextoutput will be on a fresh Output sheet. You can rename Output(2) to whatever youwish by double-clicking the name tab.8
Delete output sheetThis option deletes the current Output sheet. It will present a warning messagebecause there is no way to recover a sheet once it is deleted.You may also rename and delete Output sheets with Excel by right-clicking theworksheet name.Remove MegaStatThis option is used to remove the ‘MegaStat’ item from the Add-Ins ribbon. It doesnot delete any files or uninstall MegaStat. To restore the ‘MegaStat’ to the Add-Insribbon item click Excel Options Add-Ins Go and then check the MegaStatoption that you will see in the list of available add-ins. (See Appendix C for moredetails.)Uninstall MegaStatThis menu item does not actually uninstall MegaStat. It displays a dialog boxprompting you on how to start the uninstallation process.Uninstalling is the process of removing the installed MegaStat files from yoursystem. Uninstalling does not remove any of your data files nor does it remove thefile you used to install MegaStat. You may delete the installation file if it is still onyour system.Uninstall steps:1. Remove MegaStat from the Add-Ins ribbon using the Utilities menu2. Exit Excel3. Click: Start Control Panel Add/Remove Programs4. Find MegaStat in the list of programs, click it and then click the Add/RemovebuttonAppendix C gives more information about removing and uninstalling MegaStat.9
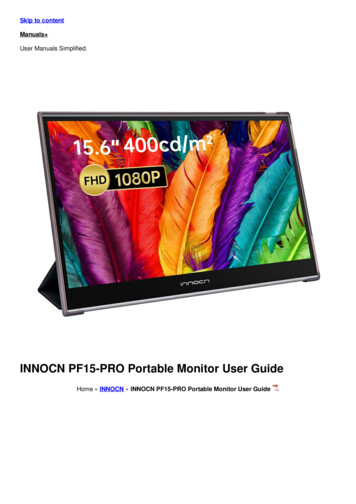
Help/InformationHelp SystemThis option displays the full MegaStat help program as shown in Figure 4. Help onthe Mac version will have the same content; however, it will look slightly differentbecause it is viewed with the default web browser.The ‘How it works (General Operating Procedures)” section contains all of theinformation in this tutorial. You can click specific topics or search for a particularitem by clicking on Index. Click Using Help for details on using the help system.Figure 4. MegaStat Help SystemAbout MegaStatThis option displays current version information. There are also links for theMegaStat website and e-mail for tech support. These links will only work if you havean active Internet connection and your system is setup to properly respond toInternet and e-mail links.The form also contains a System Information button, which causes the form toexpand and display some technical information regarding system parameters andfile locations. If you click the Insert button, the information will be placed in thecurrent Output sheet. If you click Hide System Information, the form will go back toits original size.10
2. Tutorial ExamplesAlthough MegaStat performs many different statistical options the various dialog boxes allwork the same way and have standard Excel objects (input boxes, buttons, checkboxes,etc.). Thus it is not necessary to show graphical examples of every MegaStat option. Thischapter will work through a few detailed examples and will point out a few things that areunique to MegaStat. The next chapter will provide a reference source for the variousoptions.Example 1: Frequency distribution – selecting dataThe first tutorial example will perform a quantitative frequency distribution on the Pricevariable of the Sheet1 worksheet of the Testdata.xlsx workbook. If you want to workthrough this example, start Excel and open Testdata.xlsx and click on the Sheet1worksheet tab.The steps in this font are what you would do to work through the tutorials.a. Open the Quantitative Frequency Distributions dialog box by clicking: MegaStat Frequency Distributions Quantitative.b. Click the Help button. Review the Help screen and then exit Help.Since we want to do the frequency distribution on the Price variable we need to select allthe data in column B. This example will illustrate the use of the AutoExpand featurealthough you could get the same result with any of the other methods of data selection.c. Make sure the insertion cursor is blinking in the input box. If necessary, click inthe box with the left mouse button.d. Click anywhere in column B, e.g. cell B6e. Place the mouse pointer over the input box label and double click the left mousebutton.Figure 5 shows the dialog box at this point.Click a cellin column BThen doubleclick the inputbox or click theinput box label.Figure 5. Illustration of AutoExpand11
After clicking the label, the dialog box appears as shown in Figure 6 with all of the data incolumn B being selected. The selection expands up/down until it encounters a blank cell orthe top/bottom of the column.When using AutoExpand make sure you do not have sums or other non-data values in thelast cell of the range.All of the datain column B isautomaticallyselected.Figure 6. All of the data in column B is selected with AutoExpand.f. Type 50 in the Interval width box and click each of the checkboxes. Click OK.Determining the proper number to enter is something you will learn in your statisticscourse. If you leave either input box empty the MegaStat will calculate an appropriatevalue. Prior to clicking OK the dialog box will look like Figure 7.Figure 7. Completed dialog box waiting for OK click.12
After you click OK the dialog box disappears and MegaStat does the requestedcalculations. A new Output worksheet (shown in Figure 8) is created and displayed. If therewere already an Output sheet MegaStat would have appended the new output to the end.New Outputworksheet createdClick Sheet1 toreturn to the dataFigure 8. MegaStat Output sheetThe amount displayed on your screen will be different depending on the size of yourscreen. You may need to use the vertical and/or horizontal scrollbars to view the entireoutput.The Output sheet is just an Excel wo
2007 and 2013 are very similar. The only visual difference between Excel 2007 and Excel 2010/2013 is the Office Button of Excel 2007 is replaced by a File tab on Excel 2010/2013: Excel 2007: Excel 2010 & Excel 2013: MegaStat also works with Excel 2011 on Apple Mac computers. (See Appendix D if you have Excel 2011 on a Mac.)