Transcription
Tourism in Iceland:Soft landing or a belly flop?Arion ResearchOctober 2018
Table of contents Key findings (p. 3) From zero to hero (p. 4) Airlines operating environment and impact on tourist arrivals (p. 11) The downside risk is significant (p. 21) Are we getting ahead of ourselves in hotel construction? (p. 28)– How do Icelandic hotels fare in international comparison? (p. 38)– Airbnb showing signs of growing pains (p. 49) How quickly the tide turns (p. 54)
Key findings Increased capacity of the Icelandic airlines has played a large role in the sensational growth in tourist arrivals to Iceland. Although oil prices have surged since 2016, airfares have not followed. According to estimates, the Icelandic airlines willpay around one thousand ISK with each passenger in 2018, a development that is unsustainable in the long run. Airfares aresimply too cheap and they need to increase. Analysis of tourist’s price elasticity of demand indicate that rising airfares could leadto decrease in number of tourists, especially if the ISK remains strong. We predict very little growth in tourism in the coming years. In our base case tourist arrivals will increase by 1.4% next yearand 2.4% in 2020. There is quite a lot of uncertainty, but we consider the downward risk to be greater. For example, if growth inVIA passengers continues at the same rate in 2019 as it has done in 2018, number of inbound tourists could slightly decrease.Global trade tension could also slow growth in passenger transport, a development which would affect Iceland. Last year, hotels accounted for less than half of all registered overnight stays in Iceland. In recent years, the vast majorityof hotel nights have been in the capital area. However, countryside hotels have been attracting increased shareholding, mostly inSouthern Iceland, Reykjanes Peninsula (South-West) and West Iceland. Increase in tourism beyond supply growth in hotels has created basis for Airbnb to gain market share. However, recent numbersindicate that Airbnb’s activities are shrinking, as Airbnb’s overnight stays reduced significantly over the summer. It appears that strong króna and high prices has not shortened tourist’s vacation time as much as previously thoughtbecause tourists have increasingly sought after cheaper accommodation, such as Airbnb. Tourist’s consumption in ISK has inturn contracted, but pretty much stayed unchanged in foreign currency. Developments differ from nationalities where someare more vulnerable than others. For the economy in general, consumer behavior is now more important than before, since the tourism industry can nolonger rely on revenue growth through an increased number of tourists.
From zero to heroIn a very short period of time, tourism has gone from asmall industry to the largest export sector in the country.
A Cinderella StoryMore and more foreign tourists, less and less seasonalityTourist arrivals via KEFairport- millions2.5Total number of tourists- 6.01.545%4.03.00.52.06 years1.064 20122013-2018Sources: Icelandic Tourist Board, Arion Research. * Based on Research‘s forecast.Percentage of tourists visiting in June-AugustPercentage of tourists visiting in other months
Tourism contribution to GDP has doubledFor the past three years, tourism has accounted for roughly 23% of business investmentGDP and tourism*Business investment- bn. ISK at constant prices- bn. ISK at constant %2010201120122013Tourism contribution to GDPShare of tourism in GDP (r.axis)2014201520162017GDP without tourism5000%2010201120122013201420152016Tourism contribution to business investmentBusiness investment without tourismShare of tourism in business investment (r.axis)Sources: Statistics Iceland, Arion Research. * The weight of tourism in GDP is not in perfect accordance with Statistics Iceland'sTSA, as air passenger transportation weighs more here than in the TSA.2017
The recovery time would have been much longer The economic upturn in Iceland has been in a class of its own, largely due to growth in tourismEconomic growth and effects of .7%0%-0.1%-1%20112012Economic growth withouth tourism contribution to GDP2013201420152016Economic growth withouth tourism contribution to GDP and business investmentSources: Statistics Iceland, Arion Research2017Actual GDP growth
and the current account would only be a shadow of its current selfThe surplus of trade in services, which is primarily due to tourism, has carried the trade surplus. It should benoted that the analysis below is likely inaccurate, as the impact of tourism on imports has not been taken intoaccount.Export revenues of foreign travellersScenario where export revenues of foreigntravellers increase by 5% annually- bn. ISK at constant exchange rate600- bn. ISK at constant exchange 1002010201120122013Travel20142015201620172018*Air transportSources: Statistics Iceland, Arion Research. * Research‘s forecast from August.201120122013201420152016Secondary incomePrimary incomeBalance on servicesBalance on goodsCurrent account balanceCurrent account balance with 5% growth20172018*
For every 100 tourists, one new job has been createdThe increase in tourist related jobs has closely followed the increase in tourist arrivals. The figuresfor Q2 indicate that the slowdown in tourist arrivals has begun to affect the labor market.Increase in tourist arrivals* and the number of tourist related jobs- increase between years, quarterly 0201120122013201420152016Other activities linked to tourismTravel agency, tour operator and other reservation service and related activitiesFood and beverage service activitiesAccommodationPassenger air transportIncrease in the number of tourists, thous. (r.axis)Sources: Statistics Iceland, Icelandic Tourist Board, Arion Research. * Tourist arrivals via KEF airport.20172018
Handing over the growth reinsAccording to our forecast from August, other export sectors will grow more than tourism in 2018Share in total exportsExports revenues- YoY growth, constant exchange rate100%50%20%90%18%17%18%20%19%19%18% 19%23%40%80%70%60%31%36%35%33%30%29%23%28%23% 23%30%20%50%20%40%27%30%26% 25%26%23%22%10%26%0%20%39%10% 20% 19%0%200916% 2Seafood2013201420152016Industrial goods2017 2018*2010OtherSources: Statistics Iceland, Arion Research. * Research‘s forecast from August.2011Tourism201220132014Industrial goods20152016Seafood2017Other2018*
Airlines operating environmentand impact on tourist arrivalsFor small islands, passenger transport is the key driverof tourism. With rising oil prices and fierce competition,Icelandic airlines are now facing considerableheadwinds. How will that impact the amount of touristscoming to the country?
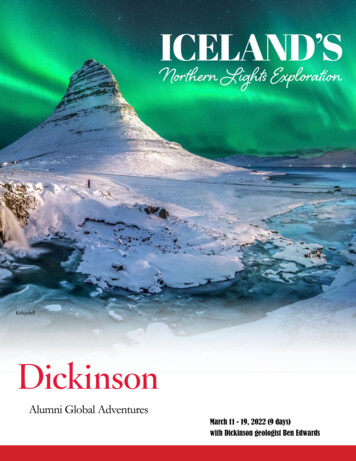
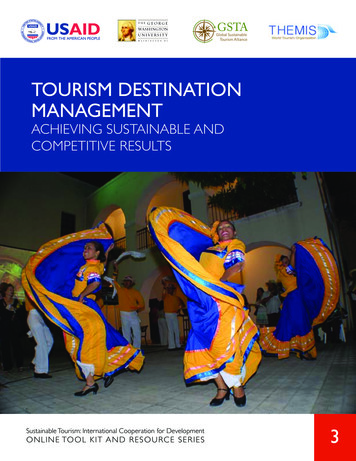
Out of European countries, Iceland is the most dependent on home-basedairlinesTwo other Nordic countries are on the list of top 15 European countries for home carriersHome carriers- seat rmanyAustria0%1210%20%30%Sources: Anna aero, Arion Research40%50%60%70%80%90%100%
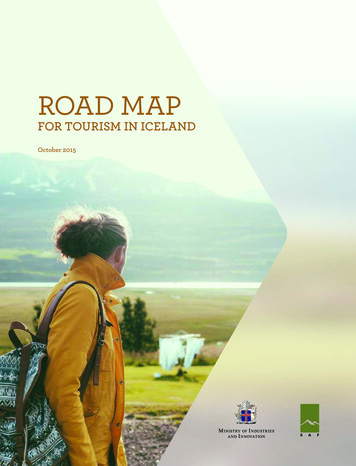
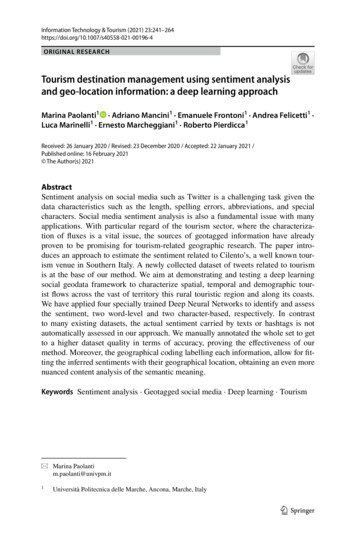
Capacity has increased a lotThe Icelandic airlines will carry around eight million passengers this yearNumber of passengers- in .50.102012201320142015Icelandair13Sources: Icelandair Group, WOW air, Arion ResearchWOW air201620172018e
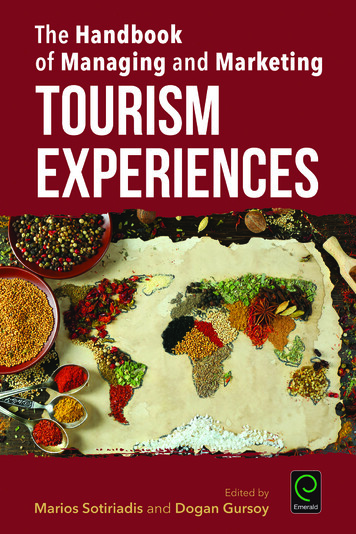
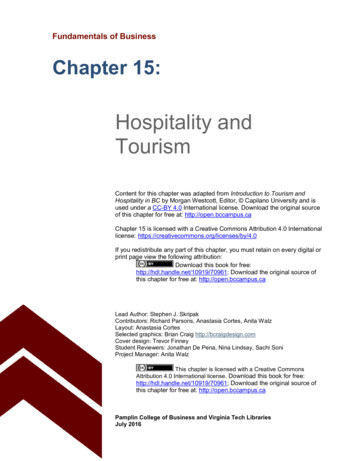
Tourism has followed the Icelandic airlines capacity increaseProportionately higher growth in tourism 2014 and 2015 than increased airline capacity, can possibly beexplained by increased flight offerings from foreign airlinesIcelandair and WOW air capacity growth and tourist arrivals via KEF 6Icelandair and WOW air142017TouristsSources: Icelandair Group, WOW air, Icelandic Tourist Board, Arion Research2018e2019e
Broken up since 2016: Oil price and airfaresWhen oil price started plummeting, airfares followed. However, that has not been the case since oil pricestarted rising again.Jet fuel (USD/Ton) and unit revenue ( 100, 42015Jet fuel (l.axis)152016European airlines (r.axis)Sources: Bloomberg, Icelandair Group, WOW air, Arion ResearchUnit revenue Revenues / Revenue passenger kilometers (RPK)2017Icelandair (r.axis)2018WOW air (r.axis)
Parallel with unfavorable development of external factors, earnings havegone southIcelandair Group and WOW air projections assume that operating loss (EBIT) for 2018 will be aroundthousand ISK per passengerEarnings per passenger- USD80706050403020100-10-2020142015Icelandair Group, EBITDA162016Icelandair Group, EBIT2017WOW air, EBITDASources: Icelandair Group, WOW air, Arion ResearchArion Research projections for 2018 Icelandair Group‘s EBIT based on company‘s EBITDA guidance2018 T12mWOW air, EBIT
Our base case projects very little growth in tourism in the coming yearsBased on expected flight capacity and continuing growth in share of VIA passengersTourist arrivals via KEF airport- millions annually, % %1.51.00.50.02016172017Sources: Icelandic Tourist Board, Arion Research20202021
With capacity blow, we could go roughly two years back in timePessimistic scenario: Capacity of a major airline disappearsPessimistic scenario- millions annually, % 0-17.8%40.1%1.51.00.50.0201620172018Base case18Sources: Icelandic Tourist Board, Arion Research2019Pessimistic scenario20202021
Less fluctuations are in our optimistic scenario than the pessimisticOptimistic scenario: Airline operations improve and they continue to growOptimistic scenario- millions annually, % increase3.07.1%6.5%2.54.5% 0172018Base case19Sources: Icelandic Tourist Board, Arion Research2019Optimistic scenario20202021
The scenarios are three, but possible outcomes are moreIf airfares increase and the ISK stays strong, we could see results in the gray area between the base- andpessimistic scenariosAll scenarios- millions, annually32.521.510.50201620172018Base case20Sources: Icelandic Tourist Board, Arion ResearchPessimistic scenario20192020Optimistic scenario2021
The downside risk issignificantWhat if airfares increase significantly?What if the world economy slows down?
Sources: The Travel, Insider, Frugal Travel Guy
Flying to and from Iceland has never been so cheapWhile the ISK has appreciated, flights to Iceland have become cheaper. Lower airfares have somewhatoffset the rising cost of staying in the country.Flight ticket to Iceland: Passenger air transport per tourist- in EUR and USD, 20132014EUR20152016USDSources: Statistics Iceland, Icelandic Tourist Board, CBI, Arion Research. * Estimation based on airfares in 1H 2018.20172018*
What could it mean if airfares increase?First, we have to look at the price elasticity of demand. For tourism in Iceland, Europe and North-Americaare the most important markets, although the Asia market is growing. According to studies, tourists fromAmerica are more sensitive to price changes than others. Europeans are fairly price sensitive as 046-0.917-0.449Europe-1.374-0.750-1.205Sources: A Meta-Analysis of International Tourism Demand Elasticities.OceanaEurope-2.190
If airfares to Iceland rise, it could have significant impactDepends on the price elasticity of demand, whether airfares to Iceland would increase relativelymore than to other destinations and whether other costs would decrease, for example throughdepreciation of the ISK.Effect of 10% increase in airfares on tourist arrivals- millions of tourists, based on different price elasticity of demand and Research's base case, all other things beingequal2.42.32.22.12.01.91.81.720162017Base CaseSources: Icelandic Travel Board, Arion Research2018-0.4-0.8-1-1.22019-1.6
Economic growth is the fundamental driver of demand for air travelFurther escalation in global trade protectionism could have negative effect on air transportEstimatednegative impacton GDPGlobal air passengers- billion, income elasticity 1Assumed income elasticity4.711.31.8-0.1%-0.1% (-4)*-0.1% (-6)-0.2% (-8)-0.4%-0.4% (-18)-0.5% (-23)-0.7% (-32)-1.1%-1.1% (-48)-1.4% (-63)-2.0% (-87)4.64.54.4Selected passenger shocks in the past- global passenger numbers, YoY change6%4.32008-20175%Trade lobalfinancial crisisSecond oilshock42017Gulf War19911980198120092001201910-yearaverageSources: IATA. * Numbers in brackets represent millions of tourists.Base caseLarger impact on GDP (-1.1%)20182019Very small impact on GDP (-0.1%)
What does the pessimistic scenario mean for the economy?All other things being equal, fewer tourists would mean a drop in tourism expenditure, which could leadto firings. The current account surplus could easily be reversed. The graphs below show what could becalled the worst case scenario, as the ISK is kept stable and the effects of tourism on imports is ignored.Inbound tourism expenditurein Iceland- bn. ISK, floating exchange rateNew/lost jobs in touristrelated activities5,000Current account- % of 003503002502001501002013 2014 2015 2016 2017 2018 201950201727Current account - pessimistic scenario-2,000201820192014 2015 2016 2017 2018 2019Sources: Statistics Iceland, CBI, Arion Research
Are we getting ahead of ourselvesin hotel construction?Accommodation is on average the largest expense oftraveling. Hotel construction has been trying to keeppace with booming demand from tourists. With touristarrivals slowing down rapidly, the question is raised: Arewe getting ahead of ourselves in hotel construction?
Hotels shoulder the burdenEvery four in ten overnight stays by tourists were spent at hotels in 2017Registered overnight stays by type of 001,500,0001,000,000500,0000HotelUnlisted AirbnbGuesthouses201229Sources: Statistics Iceland, Arion ResearchOther unlisted20132014Apartments andPrivate-homeaccommodation201520162017Camping sitesYouth hostelsOther
Lion‘s share of overnight stays are spent in the capital areaIn relative terms, however, growth has been slowest in the capital area as occupancy rates have been veryhigh. The number of tourists visiting the country has outpaced hotel construction, growing 378% since2010 while the latter has grown by 79%.Overnight stays in hotels by regions- stays (thous) and change from %0Capital areaSouthwestWest and Westfjords201030Sources: Statistics Iceland, Arion Research2014North2017EastSouth
Overnight hotel stays per thousand travelers has decreasedSupply shortage, appreciation of the króna and competition with Airbnb seem to be the main causesOvernight hotel stays per 1000 tourists, byregion1,800Overnight hotel stays per 1000 001508006001004005020000SouthwestCapital area201031Countryside20142017Sources: Statistics Iceland, Arion ResearchWest andWestfjords2010North2014East2017South
Length of stay per each hotel guest has not decreased markedly,indicating supply shortageTourists cut their stay in the capital area in 2014, but since then their average stay has hovered around 2.2nightsAverage length of stay by hotel guest- stays and YoY percentage 3220112012Sources: Statistics Iceland, Arion Research20132014201520162017
In the beginning of the year, overnight stays decreased in all parts of thecountry except South Iceland and West IcelandThis trend reversed in August with travelers lengthening their stay at hotelsOvernight stays- change between 2017 and 00-10%-15,000-25,00033-15%JanFebCapital areaSouthwestMarWest and WestfjordsSources: Statistics Iceland, Arion ResearchAprMayNorthEastJunEastTotal changeJulAugTourist arrivals (YoY - r.ax)
Which has coincided with lower occupancy ratesOccupancy rates in the capital area are still robust and higher than outside the capital areaHotel room occupancy ratesHotel room occupancy rates- capital region- other %30%30%20%20%10%10%0%0%Jan Feb Mar201034Apr May Jun2014Jul2016Aug Sep Oct Nov Dec2017Sources: Statistics Iceland, Arion Research2018Jan Feb Mar Apr May Jun20102014Jul2016Aug Sep Oct Nov Dec20172018
We forecast that the number of hotel rooms in the capital area will bearound 7,000 by 2022Should our forecast materialize hotel rooms will increase by 43%Arion Research's hotel room forecast in the capital 013201420152016Hotel rooms35Sources: Statistics Iceland, City of Reykjavik, media, Arion Research20172018New rooms (forecast)2019202020212022Year end2022
We expect overnight stays at hotels to increaseIncreased supply, together with slower growth in tourist arrivals, lead to a decline in occupancy ratesArion Research's forecast for overnight stays and occupancy in the capital area- 0040%1,00030%20%50010%00%2003200420052006Base scenario3620072008200920102011Room occupancy (r. ax)Sources: Statistics Iceland, Arion e occupancy in Nordic capital areas (2010-2017)2021
Are we getting ahead of ourselves in hotel construction?Compared to the Nordic countries, it seems we are rather reaching a sustainable long-term equilibrium.The substitution effect over to other accommodation has been considerable since 2010 in the capital area.That development seems to have reversed over the last few months when supply has increased.Occupancy forecast: optimistic scenarioOccupancy forecast: pessimistic scenario- Only current construction finished, travelers increasetheir length of stay at hotels- All projections in development realize, travelersdecrease their length of stay at hotelsBase scenarioBase scenarioOptimistic tourist arrivals scenarioOptimistic tourist arrivals scenarioPessimistic tourist arrivals scenarioPessimistic tourist arrivals scenarioAverage occupancy in Nordic capital areas (2010-2017)Average occupancy in Nordic capital areas (2010-2017)Sources: Statistics Iceland, Arion %200490%200337100%Forecast2003100%
38How do Icelandic hotels farein international comparison?What do sliding occupancy rates mean in the bigpicture?
Icelandic hotels rely on foreign travelersIn other Nordic countries locals comprise the majority of overnight hotel staysForeign travelers' overnight hotel stays in 2017 as a percentage of total100%90%80%70%60%50%40%30%20%10%0%39Sources: Eurostat, Arion Research. *2017 data for those available
The capital area reaching occupancy seen in the Nordic countries overthe summertimeThe occupancy in Reykjavík is generally better during winter than in other capital areasOccupancy rates in the Nordic countries- capital penhagenOsloSources: Statistics Iceland, local statistics agencies in Nordic countries, Arion 7/201004/201001/20100%
Occupancy of hotel rooms at a national level is very good in EuropeancomparisonThe seasonality is similar to that seen in the Nordic countriesOccupancy rates in ources: Eurostat, Arion 1207/201205/201203/201201/20120
Occupancy in Reykjavík will remain with the best in classOccupancy rates in European 2018 - forecastSources: Statistics Iceland, PwC, Benchmarking Alliance, Arion ResearchZurichMilanGenevaEuropean average 2015-2017RomeFrankfurt
Prices are, however, very highAccommodation prices have more than doubled over the last decade. Prices of hotels and restaurants inIceland are among the highest in Europe.Hotel and restaurants prices- price level indices, EU 28 DenmarkSwedenSources: Statistics Iceland, Eurostat, Arion lands2016Switzerland2017
Considerable seasonality in ADR as wellRising ISK prices in parallel with the appreciation of the króna has led to hotel rooms in the capitalbecoming more expensive than in the Nordic countriesHotel room ADR in Nordic capital areas- euros25020015010050Oslo44StockholmHelsinkiSources: Benchmarking Alliance, local statistics agencies in Nordic countries, Arion 4/201001/20100
ADR similar to that seen in London and AmsterdamIt should be borne in mind that there are still no five-star hotels in Reykjavik that distorts comparison tosome extentAverage daily rate (ADR) in European cities- íkLondon2016Sources: Statistics Iceland, PwC, Arion ResearchAmsterdam2017RomeMilano2018 - forecastFrankfurtLisbonPortoAverage ADR 2015-2017BerlinPrague
RevPAR has been largely unchanged since 2016Off season RevPAR decreased YoY in 2018*Revenue per available room (RevPAR) in Reykjavík- ISK, thousands and change from previous 2%22%502010201120122013High season462014Off seasonSources: Statistics Iceland, Benchmarking Alliance, Arion Research *Jan-May2015201620172018
RevPAR among the highest in EuropeRevPAR in European rich201547ReykjavíkLondon2016Sources: Statistics Iceland, PwC, Arion ResearchAmsterdamRomeMilano20172018 - forecastLisbonFrankfurtPortoAverage RevPAR 2015-2017PragueBerlin
Equity ratios have never been betterEquity ratios in tourism related 03200420052006Transport by air48Sources: Statistics Iceland, Arion 14Food and beverage service activities20152016
49Airbnb showing signs ofgrowing painsAirbnb has soaked up demand for overnight stays in thepast three years, especially in the capital area.However, the development over this summer indicatesthe sharing economy for overnight stays is shrinking
Same old story: Airbnb has been growingThe growth has been particularly powerful outside the capital area. However, it is difficult to quantify theactual number of overnight stays on Airbnb, as Airdna and Statistics Iceland tell a different story. Thus, thetotal share of Airbnb was 21% in 2017, based on data from Statistics Iceland, but 31% based on Airdna'sdata.Overnight stays on Airbnb- stays and percentage change ,000,000500,0001630%020152016Capital area50Sources: Statistics Iceland, Airdna.com, Arion Research *Jan-Aug2017Countryside2018*
But growing pains are appearingFollowing growth spur over the last two years overnight stays in Airbnb have decreased YoY over the pastfive months in the capital areaOvernight stays on Airbnb- stays and percentage change YoY250,000200,000-11%6%10%150,00013%11%-2%58% -6%22%100,00065%50,0000Capital area51Sources: Statistics Iceland, Airdna.com, Arion ResearchCountryside52%27%-20%-19%-6%-4%
Supply of Airbnb rentals has started to decreaseA strong real exchange rate, tightening regulation and increased competition with hotels has potentiallyreduced the incentive to rent out assets through Airbnb. Rising real estate prices have also made sellingmore attractive.Active Airbnb rentalsActive Airbnb rentals- capital area- 020002000150015001000100050050000Jan Feb Mar Apr May Jun201752Jul2018Aug Sep Oct Nov DecJan Feb Mar Apr May Jun2017JulAug Sep Oct Nov Dec2018Sources: Statistics Iceland, Airdna.com, Arion Research *A working paper by the Central Bank of Iceland suggests that full time rentals on Airbnb in 2017 werearound 752-1,898 in the capital area and 204-902 in the countryside.
Less seasonality in Airbnb ADROn average there are more bed places per bedroom on Airbnb, compared to hotel roomsHotel and Airbnb ADRHotel and Airbnb ADR- ADR in ISK per bed room- ADR in ISK per bed 201711/201701/201803/201805/201807/20180Airbnb - Entire homeAirbnb - Entire homeAirbnb - Private roomHotel roomSources: Statistics Iceland, Airdna.com, Arion ResearchAirbnb - Private roomHotel room
How quickly the tide turnsIn no time at all the tourist industry has gone fromdouble digit growth to much more sustainablelevels. What happened?
The Icelandic airlines are not expanding as fastThe main reason for slower growth in tourist arrivals is that the Icelandic airlines route network is notexpanding as fast as before. The composition of nationalities visiting Iceland largely depends on where,and how often, the airlines fly.Icelandair and WOW air capacity growth andtourist arrivals via KEF airport45%Flight supply and tourists- change between July 2017 and %-30%2013201420152016Icelandair and WOW air2017Tourists2018e2019eUnited StatesFranceChange in available flightsSources: Icelandair Group, WOW air, Túristi.is, Icelandic Tourist Board, Arion ResearchNordic countriesGermanyChange in the number of tourists
More VIA passengers than ever beforeOther development that contributes to slower growth in tourist arrivals is the growing importance of VIApassengers. To some extent, this trend can be attributed to new destinations in the Icelandic airlines routenetwork, but another important factor is how expansive the country has become.VIA passengers- % of total traffic through the archApril2012Sources: Isavia, Arion mber2018OctoberNovemberDecember
wSplitKrakowRigaVilniusSt. PetersburgBudapestZagrebSarajevoČeský BelgradeSofiaBucharestKievIstanbulOne of the most expensive destination in the worldFew places are as expensive as Iceland for the typical tourist, both because of strong króna and highpricesEurope 3-star travel index for 2018- typical budget for normal daily expenses*25,00020,00015,00010,0005,000Sources: Priceoftravel.com, CBI, Arion Research. * Prices from May, in ISK. Exchange rate from September 18.
What does this dubious title mean for theconsumption pattern of foreign tourist?Studies indicate that consumer behavior and theduration of stay is more vulnerable to price increasesthan arrivals. This is especially true for small islands.
The income effect seems to be relatively smallWhen the trip becomes more expensive, many tourists respond by shortening their stay. Looking at allovernight stays in the country, registered and unlisted, the effect seems to be small – so far.Overnight stays per tourist and the real exchange 50701.00650.50-602010201120122013Overnight stays per tourist201420152016Real exchange rate (r.axis)Sources: Statistics Iceland, Airdna, Arion Research. *Research‘s estimation for 2018.20172018*
The substitution effect is clearerIf all overnight stays are summarized, the duration of stay has changed only slightly, while registeredovernight stays per tourist have dropped. This indicates that as prices of hotels and guesthouses increase,tourists look to cheaper options, i.e. Airbnb.Overnight stays per ter* - all20082009Summer - all201020112012Winter - registered2013201420152016Summer - registeredSources: Statistics Iceland, Airdna,
Out of European countries, Iceland is the most dependent on home-based airlines Two other Nordic countries are on the list of top 15 European countries for home carriers 0% 10% 20% 30% 40% 50% 60% 70% 80% 90% 100% Austria Germany UK Luxembourg Netherlands Latvia Slovenia Finland Moldova Norway Russia Belarus