Transcription
Uncertainty and Sensitivity AnalysesMarcelo Coca PerraillonUniversity of ColoradoAnschutz Medical CampusCost-Effectiveness AnalysisHSMP 660920201 / 46
OutlineDefining terms: variability, heterogeneity, uncertaintySensitivity analysis: “deterministic” and “probabilistic”Base case, one-way, two-way, three-way, scenariosInfluential variables: tornado diagramsMore advanced methods: probabilistic sensitivity analysis (PSA)Probability distributionsHow to choose probability distributions for probabilistic sensitivityanalysisExample: HIV model2 / 46
What is sensitivity analysis?We have already done sensitivity analyses in homework and duringclassIt is essentially the study of how changes in model inputs affectmodel outputsInputs are quantities, prices, probabilities, and so on. In essence, allwe measure in a CEA studyOutputs are the model outcomes we care about: average or expectedcosts, average or expected years of life gained, average or expectedICER or Net Monetary Benefit. Most often than not, the focus is onICERThe objective of a sensitivity analysis is to understand 1) which arethe most important inputs/parameters that affect ourstudy/model and 2) quantify the overall uncertainty of our modelsWe often cannot do traditional statistical analyses (p-values,confidence intervals, etc) because we don’t have individual data3 / 46
Deterministic and probabilistic sensitivity analysisWe’ll cover two types of sensitivity analyses:Deterministic: We choose values for one or more parameters keepingthe rest constant. For example, min or max or a case that has policyrelevance. This is what we have done so far2 Probabilistic: We assign parameters a probability distribution and usesimulations to compute new ICERs or other outcomes of interest1One confusing part is that, once again, we are dealing with conceptsthat are called different names in different fieldsWe need to spend some time defining terms4 / 46
Defining termsVariability: Variation due to chance; random variability. Even withidentical patients facing the same probability of an event, someexperience the event and some do not. Sometimes called stochasticuncertainty or first-order uncertainty (less common)Heterogeneity: Differences between patients that can be attributedor explained by patient’s characteristics (think sex, age, income, andso on)Uncertainty: What sensitivity analysis tries to measure. We do notknow the true value of some input (parameter) or the true way aprocess is generatedTwo types of uncertainty: parameter uncertainty and modeluncertainty5 / 46
Parameter uncertaintyWe do not know the true value of a parameter. For example, the trueaverage cost for a procedure in the populationWe could estimate the mean cost in a sample but the estimatedparameter (the mean) itself has some variabilityIn statistics, a measure of parameter uncertainty is the standarderror (do not confuse it with the standard deviation)We can reduce some of this uncertainty if we had a larger sample; thestandard error depends on sample sizes. The larger the sample themore precise the estimate and the smaller the standard error(A related concept: consistency. In probability, the larger the samplesize, the closer the estimated parameter will be to its true value)For the purpose of this class: Each model parameter has someuncertainty that we somehow should take into account6 / 46
Parameter uncertaintyLast week when we covered the SIR/SEIR models used to understandthe coronavirus, I mentioned parameter uncertaintyWe just don’t have good information right now (as of mid April) tobuild good modelsWhat is the transmission rate, β? What is the recovery, γ? Evenmore basic, what is the mortality rate?In the HIV example: is the relative risk really 0.509? What was theconfidence interval of the study? Intuitively, if the 95% confidenceinterval was, say, (0.45 - 0.55) we’d argue that the parameteruncertainty less than if it were (0.2 - 0.70)All that is parameter uncertainty(I’m going to say more about confidence intervals in about 30 mins)7 / 46
Model uncertaintyModels are simplifications of reality; some models capture the keyelements of reality and some don’tAny model that you see in the literature could be modified to make itmore “realistic” but it adds complexity. More realistic models are notnecessarily betterThe uncertainty we have about model assumptions is called modeluncertaintyFor example, when we were modeling breast cancer recurrence, wewere wondering if not keeping track of time from recurrence was aproblem–we used tunnels to sidestep that problem. Was it the wrongassumption?Is ignoring the Exposed health state in the SIR model a terriblemistake?8 / 46
Analogy with regressionMandatory slide in cost-effectiveness. Cover your ears if you don’tknow regression analysis (but don’t get too distracted)A standard linear regression model can be written as:yi β0 β1 X1i . βk Xki iwhere i is assumed to distribute normal with mean 0 and variance σ 2After collecting data on variables y and X1 to Xk , the estimateedmodel is:E [ŷ ] βˆ0 βˆ1 X1 . βˆk XkStandard errors for the coefficients SE (β̂j ) are also estimatedEach coefficient is a random variable with a (theoretically) knowndistribution. Once you know the estimated coefficients and their SEs,it is possible to test hypotheses, build confidence intervals, etc9 / 46
Analogy with regressionThe random error corresponds to stochastic uncertainty orvariability due to chanceParameter uncertainty is measured by the standard error SE (β̂j ) ofthe estimated parameter β̂jHeterogeneity of effects is represented by coefficients β̂jModel uncertainty is the uncertainty around the assumptions of themodel. Is it correct to assume that the error, and consequently theoutcome Y , distribute normal? Are we including all the relevantcovariates X ? Should we model Y or log (Y )?Anyhow, most textbooks and articles introducing uncertainty use thisanalogy so there you go10 / 46
Cheat sheetOf course, there is an article trying to come up with an agreement onnamesFrom Briggs et al (2012). I used red to underline what I think is themost common term (apparently I don’t agree with Briggs)11 / 46
Deterministic sensitivity analysisWe’ll focus on simple deterministic sensitivity analysesOne-way: Change one parameter at a time keeping all othersconstantStandard way of presenting one-way sensitivity analyses results is toplot the parameter you are changing in the x-axis and an output ofinterest on the y-axisIn the HIV example, we could change the relative risk and analyzewhat happens to average costs in the combination therapy group andthe ICERYou did that in one homework12 / 46
HIV transition diagram, reminderSee Excel file for more details13 / 46
One-way sensitivity analysis of relative risk with respectcombination therapy costLower RR implies combo therapy more effective, so more people stayin states that are costly. It would be unrealistic to choose very high orvery low relative risks. Combination therapy at the time of the trialwas not a miracle medication14 / 46
One-way sensitivity analysis of relative risk with respect toICERICER shows more nuance because of more moving parts. Moreeffective drug increases costs but it also increases life expectancy.Less effective combo therapy becomes more similar to mono therapybut costs keep going up15 / 46
For special assignment IIMost of the time we want to understand how changing a parameterchanges the ICER, not just one component of the ICERThe ICER has four components:Ccombo CmonoYearscombo YearsmonoYou need to understand how the four components are changingSome analyses result in weird-looking graphs and non-linearity, usuallybecause of dividing by number close to zeroA ratio in which the denominator is close to zero tends to infinity,positive or negativeIn the HIV example, if the relative risk is close to 1, then there is nodifference in effectiveness between mono and combo therapy. Thatmeans that Yearscombo Yearsmono 016 / 46
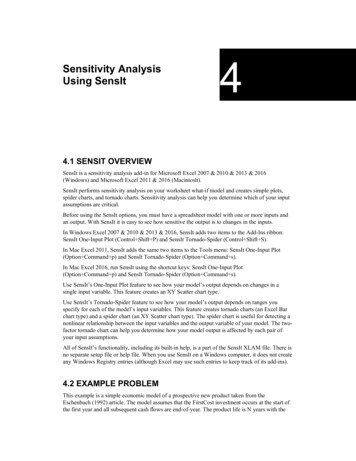
Using a macro for sensitivity analysis in ExcelIt is easy to change values in Excel but it is not the most practicalway to perform sensitivity analysesExcel has a macro language that is very flexible and relatively easyto use, although it can take a while to master itIt’s based on a version of a programming language, Visual Basic(Visual Basic for Applications, VBA)Fortunately, you don’t need to master it in order to use it for simpleanalysesWe will use a simple macro for quick sensitivity analysesBut it’s worth learning macros. Add it to resume (if you learnedhow to use macros, of course)17 / 46
Macros in ExcelFirst, make sure that you can see the Developer ribbon in Excel:Click the File tab.Click Options.3 Click Customize Ribbon.4 Under Customize the Ribbon and under Main Tabs, select theDeveloper check box1218 / 46
Record a macroThe easiest way to use macros is to record a macro of a repetitivetask like changing the RR and then copying and pasting the resultingICER into a new columnExcel will create VBA code to do the repetitive taskIt is then (relatively) easy to modify the code so the repetitive task is,well, repeated several timesSee the Excel file HIV “sensitivity m.xlsm” for an example (macroscould be used as a computer virus so you’ll get a warning beforeopening the file)See the video “Recording a macro” to see how I created the macro(one good thing about the coronavirus: I learned how to make screenvideos)19 / 46
Final code20 / 46
LogicFor each copy-paste step, Excel creates a chunk of codeWe used this chunk of code to create a loop so Excel does the samein a range of cells, from rows 5 to 17We added123Dim i As IntegerFor i 5 To 17Next iSee http://www.excel-easy.com/vba.html for more ExamplesRemember, this code only repeats interactions with Excel that youcould do “by hand” (pointing, clicking, or using the keyboard)VBA is quite flexible so you can do many more things21 / 46
Tornado diagramsTornado diagrams are a nice way of depicting results of one-waysensitivity analysesProvides a way to quickly figure out which parameters have themost influence on outcomesThis is very helpful because one needs to pay more attention to themost important parametersIn other words, we may not need to worry too much about oneparameter value if it turns out that the parameter is not that“important”We will do a tornado diagram of the the HIV model22 / 46
Finished tornado diagramThe top variable has more uncertainty or is more sensitive to possiblerange of values23 / 46
Tornado diagram HIV modelWe need to come up with a range of values for the parametersTo make things simpler, I’ll focus on only three variablesI came up with a range for them:24 / 46
Where do we get these numbers?The base-case scenario is our best estimate (sometimes calledbaseline) scenario or baseline valuesThe range could be obtained from multiple sources, like drug pricesthat are common for hospitals or prices after discountsThe relative risk was obtained from a meta-analysis, so a confidenceinterval could be availableWe can then calculate the ICER corresponding to each of the valuesin the table to obtain a lower and upper bound estimate of the newICER corresponding to lower and upper bound range of values25 / 46
Table for tornado diagramLb lower bound; Ub upper boundThe range is the absolute value of the difference between the upperand the lower boundTable is sorted from lowest to largest rangeA tornado diagram is a graphical representation of this table26 / 46
Tornado diagramVertical line is the ICER for base case ( 11,499); the most influentialvariable is the drug price for combination therapySee the video “Tornado diagram” to learn how to do this graph inExcel27 / 46
Tornado diagram in ExcelA tornado diagram is a essentially a bar chartSelect the upper and lower bound ICER estimates, click insert andselect a 2-D horizontal bar chartSelect the horizontal axis (where the ICER values are) and find theoption “Vertical axis crosses.” Choose Axis value and enter thebaseline ICER 11499Select one bar and find the option that says Series Overlap andincrease the overlap to 100That’s it.You can then change the colors, labels, etc28 / 46
Why are they useful? Department of Big PicturesLet’s go to basics. You (somehow) come up with a range of plausiblevalues. Then you calculate ICERs for the range. Then you graphicallysee which variable has the largest range (the “top” of the tornado)This way you identify –and communicate– the most important(sensitive to changes) variables in your model, in the sense thatchanging the value of those variables changes the ICER (or any otheroutcome of interest, but mostly the ICER)About the “somehow” part. If, for example, the estimate comes froma study, you could use the 95% confidence intervalIf it’s the price of a medication, you could use different prices:wholesale, what the VA pays, what an average hospital paysYou could ask a bunch of experts. There are no hard rules abouthow one come up with these numbers29 / 46
The end of deterministic sensitivity analysisThat’s all about deterministic sensitivity analysis. Same rules apply tochanging two variables at the same time, although it’s harder tocommunicate what happensI covered two-way sensitivity analyses in the decision tree classSometimes you want to do a scenario analysisIt could involve changing several parameters at the same time. Say, ifthe cost of the combo medication is reduced by 25% and thegovernment manages to reduce hospital costs, would the new drug becost effective?This is a preview of our policy class, but one reason drug prices(technology in general) are cheaper in countries that that usecost-effectiveness is because companies could do a CEA study andfigure out at which price the new drug or technology will be costeffective, which means that it’s more likely to be approved. In the US,pricing is more or less like this: how high can we get away with?30 / 46
Probabilistic Sensitivity Analysis (PSA)Instead of changing one or more variables at a time we will change all(or many) variables simultaneously using a simulation (sometimescalled second-order Markov simulation)Instead of coming up with a range of possible values for each variablewe will assume that a parameter has a probability distributionRemember that a probability distribution assigns a probability to eachpossible outcome of a random variableWe can describe a distribution using its parametersFor example, a normal distribution can be described by its mean andvariance (two-parameters)Another way: assuming a probability distribution for each parameteris equivalent to assuming many, many possible values a parametercould take (as many as infinity in most cases)31 / 46
Stats 101 to understand the logic of PSAConfidence intervals: If we could repeat the experiment many, manytimes, 95 percent of the time the value of the parameter would becontained within the upper and lower bound of the confidence intervalIn the frequentist framework, the confidence interval is not a“probability” interval in the sense that the confidence interval is NOTdefined as saying that we are “95 percent confident” that the truevalue of the parameter will be within the confidence intervalThat’s a bit closer to the Bayesian interpretation of confidenceinternals (aka credible intervals)Language is so important. How we call things changes how weunderstand them. And it can lead to confusion32 / 46
Stats 101 to understand the logic of PSACurrently the fights between Bayesians and Frequentists have mostlyturned into love affairsUnder flat priors, both produce similar results so no need to argue somuch about which approach to statistics is betterFlat priors mean that we approach an analysis assuming that we don’tknow anything about the true value of a parameterBut the idea that we repeat the experiment many times to come upwith a confidence interval is key to make sense of probabilisticsensitivity analysisSo what is PSA? A way to come up with a confidence interval for aCEA study by “repeating” the study many many times (with asimulation) to understand the possible values the ICER could take –and thus quantify “uncertainty” (of the parameters)33 / 46
Digression: Hypothesis testingThere is a direct connection between confidence intervals andhypothesis testing you learned in stats 101Suppose we know that the 95% confidence interval for the relativerisk is (0.4 - 0.6) and we want to test the hypothesis that the relativerisk is zero. So the null is H0 0. Would we reject the null?Yes, of course. Because if we repeat the experiment many times, 95%percent of the time zero is not within the confidence interval (thusthe error is 5%)What about testing if the relative risk is 0.5? We would not reject thenull“Counting” and repeating experiments is fundamental to statistics.Think about calculating the probability of obtaining a 2 rolling a dice.We calculate that by rolling the dice many times and counting thetimes 2 comes up34 / 46
PSA and Groundhog DayThink of PSA as a kind of Groundhog Day experimentBill Murray’s character, Phil, keeps repeating the same day. Manytimes. Let’s say 1000 times (we are never told how many times)He is trying to get Andie MacDowell’s character, Rita, but he getsrejected and slapped pretty much all the time. Being a Hollywoodmovie, he does succeed – once (after he becomes a nice person, ofcourse)We could use this “experiment” to quantify the probability that Philgets Rita or the uncertainty: 1 in 1000 timesEverybody’s behavior in the movie kept changing with every new day,within certain parameters. But only once he succeeded35 / 46
Simulation or how we get plausible numbersIf we assume that a variable (in this case, a model parameter) has adistribution and we have the parameters of the distribution, we canuse software to generate a sample of possible valuesThink of this as asking the computer to pick random numbers foryou. The only condition is that these numbers must come from aprobability distribution with certain characteristicsFor example, I used Stata to simulate 10 draws of a normaldistribution with mean of 100 and standard deviation of 50. The firstten numbers were:52.3, 125.6, 187.7, 113.5, 113.8, 138.1, 74.3, 77.4, -21.8, 37.0Pay attention to the numbers. All are reasonably close to 100, themean. How close depends on the standard deviation, in this case, 50Digression: technically, computers generate pseudo-randomnumbers; need a “seed”36 / 46
Normal distributionSimulated values for a normal variable with mean 100 and standarddeviation of 50; N(100, 502 )37 / 46
PSAThe procedure to conduct PSA is fairly simple:Assign a probability distribution to each model parameterAsk the computer to draw a number from these distributionsCalculate ICER (or any other outcome of interest but mostly the ICER)Save the new ICERRepeat procedure many times (1000 or 10,000 times)Plot all ICERs in a cost-effectiveness plane7 Calculate statistics (like the percent of time the ICER is belowthreshold)123456The resulting “cloud” of ICERs will give you a sense of the overalluncertainty of the study38 / 46
PSA for HIV exampleCampbell et al (2014) performed a PSA of the HIV exampleAssumed distributions39 / 46
PSA for HIV examplePerformed 10,000 simulation draws40 / 46
Why is PSA important?It gives you an idea of the overall uncertainty of the studyIf the points are scattered all over the four quadrants, there is a lot ofuncertaintyIn general results are presented as the percent of times the ICER isbelow the threshold lineObviously, less uncertainty means that our model is less sensitive tothe value of parameters, which is goodPSA is essentially trying to mimic frequentist statistical inference41 / 46
Choosing probability distributions for probabilisticsensitivity analysisThe normal distribution is the first one you learn but in CEA fewparameters distribute normalCosts, for example, cannot distribute normal because they have to be 0 and costs are usually skewed (but prices are often close tonormally distributed)Utilities and probabilities must be bounded between 0 and 1 so theycan’t be normally distributedCommon distributions in PSA are Gamma, Beta, and Log-normal,Poisson depending on the parameterObviously, the domain or support of the distribution must match thecharacteristics of the parameter. It would be a bad idea to use anormal distribution to model the number of test needed, which areinteger, positive numbers like 0, 2, 3, etc42 / 46
Example distributionsSee Stata code for simulations43 / 46
CharacteristicsGamma: γ(k, θ) has two parameters (shape and scale), support from 0 to infinity. Used to simulate costs because costs are positive andskewedBeta: β(a, b) has two shape parameters, support from 0 to 1. Goodfor simulating utilities or probabilities because they are boundedbetween 0 and 1Log-normal: the exponent of a normal distribution exp(N(µ, σ 2 )).Support from 0 to infinityNote: support is also called the domain of a distribution; the rangeof values for which the distribution is defined44 / 46
How to simulate numbersMost statistical packages (SAS, Stata, R, Excel) have randomnumbers generators for common distributionsInverse Transform Method: It is possible to simulate numbers fromany (continuous) distribution by using a uniform random generatorWe only need 1) a random generator for the uniform distribution and2) the formula of the inverse cumulative distribution (may not exist inclosed form)Now most software has random number generators so no need for theinverse transform method, but you still see this because that’s howsome people learned how to simulate random numbersSee Excel file for examples45 / 46
SummaryWe have used Markov models as examples, but everything we havelearned apply to decision treesSensitivity analyses are vital parts of CEAPSA may be complicated to implement but it is very easy tounderstand46 / 46
Using a macro for sensitivity analysis in Excel It is easy to change values in Excel but it is not the most practical way to perform sensitivity analyses Excel has a macro language that is very exible and relatively easy to use, although it can take a while to master it It's based on a version of a programming language, Visual Basic