Transcription
SAND2014-3134PPhotos placed in horizontal positionwith even amount of white spacebetween photos and headerDakota Sensitivity Analysis andUncertainty Quantification, with ExamplesSandia National Laboratories is a multi-program laboratory managed and operated by Sandia Corporation, a wholly owned subsidiary of Lockheed MartinCorporation, for the U.S. Department of Energy’s National Nuclear Security Administration under contract DE-AC04-94AL85000. SAND NO. 2011-XXXXPSAND2014-3134P
Dakota Sensitivity Analysis (SA) SA goals and examples Global SA approaches and metrics available in Dakota Select Dakota examples for parameter studies and global SA
Why Perform Sensitivity Analysis? What? Understand code output variations as input factors varyWhy? Identify most important variables and their interactions Identify key model characteristics: smoothness, nonlinear trends, robustness Provide a focus for resources Data gathering and model development Code development Uncertainty characterization Screening: Identity the most important variables, down-select for further UQor optimization analysis Can have the side effect of identifying code and model issues Data can be used to construct surrogate modelsDakota SA formalizes and generalizes one-off sensitivity studies you’re likelyalready doingProvides richer global sensitivity analysis methods
Sensitivity Analysis:Influence of Inputs on allocalAssess variations in f(x1) due to (small or large) perturbations in x1. Local sensitivities Partial derivatives at a specific point in input space. Given a specific x1, what is the slope at that point? Can be estimated with finite differences Global sensitivities Found via sampling and regression. What is the general trend of the function over all values of x1? Typically consider inputs uniformly over their whole rangex1many already dobasic SA;perturb fromnominal, see effect
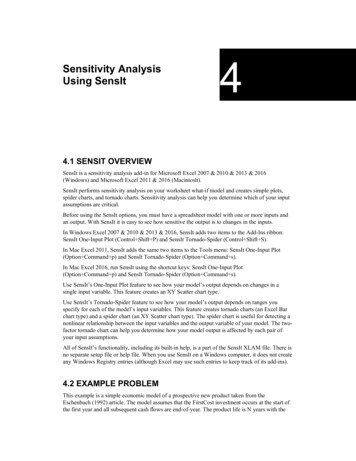
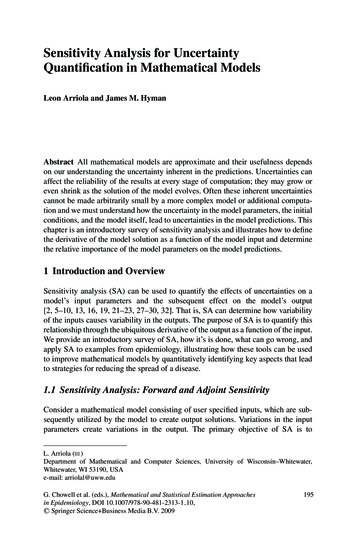
Global Sensitivity Analysis Example:Earth Penetrator12 parameters describing target & threatuncertainty, including threat: width, lengthtarget: soil depth,structure width (span)φNotional model for illustration purposes netrator.html)57.71819.648725 1.6824wall spansoil coveryzerojfd1jfd3dydpyieldthreat oMidHighLoMidHighLoLoMidHighMidHigh-9.6397Lo Underground target with external threat: assess sensitivity in target response to targetconstruction and threat characteristicsResponse: angular rotation (φ) of target roof at mid-spanAnalysis: CTH Eulerian shock physics code; JMP statsRevealed most sensitive input parameters and nonlinear relationshipsRotation(deg.) threat width
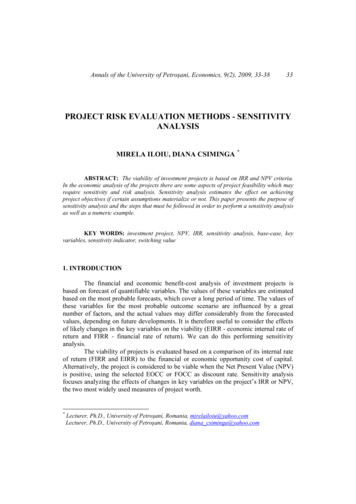
Global SA Example:Nuclear Reactor Thermal-Hydraulics Modelparameter influence on number of boiling sites Assess parameter influenceon boiling rate, a key crud predictor Dakota correlation coefficients:strong influence ofcore operating parameters(pressure more important thanpreviously thought) Dittus-Bolter correlation model maydominate model form sensitivities(also nonlinear effects of erature-0.15pressure0.04-1.00-0.500.000.50 Scatter plots help visualize trend ininput/output relationshipssensitivity of mass evaporation rate (max) to operating parameters1.00
Group Discussion Questions:Your Sensitivity Analysis Practice Do you currently perform sensitivity analysis or parameter perturbations?What are example SA questions you (could) ask in your domain?How do (would) you answer them?What measures of sensitivity, ranking, or importance are you mostfamiliar with? What are the key challenges you face?
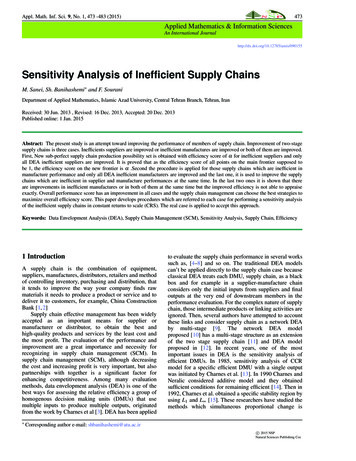
Cantilever Beam ModelYXtwLParameters:L: length (in)w: width (in)t: thickness (in.)ρ: density (lb/ft3)E: Young’s modulus (lb/in2)X: horizontal load (lb)Y: vertical load (lb)Responses:M: mass (lb)S: stress (lb/in2)D: displacement (in)𝐿𝑀 𝜌 𝑤𝑡 312𝑆 600𝑌2𝑤𝑡34𝐿𝐷 𝐸𝑤𝑡 600𝑋2𝑤 𝑡𝑌𝑡22𝑋 𝑤228
Global Sensitivity Analysis in Dakota Assess effect of input variables considered jointly over theirwhole range. Dakota process: Sample designs (methods) available: Specify variables: lower and upper boundsSpecify method: e.g., uniform random samplingSpecify responses: compute response value at each sample pointRun Dakota and analyze input/output relationshipsParameter studies: list, centered, grid, vector, userRandom sampling: Monte Carlo, Latin hypercube, Quasi-MC, CVTDOE/DACE: Full-factorial, orthogonal arrays, Box-Behnken, CCDMorris one-at-a-timeSobol indices via variance-based decomposition, polynomial chaosMetrics: trends, correlations, main/interaction effects, Sobolindices, importance factors/local sensitivities
Basic Dakota SA for Cantilever:Centered and Grid Parameter Studies Start at nominal values, perturb up and down in eachcoordinate directionSpecify the parameter variations, which responses to studySee Dakota input and output (following slides)What changes to Dakota input will instead perform thegrid parameter study at left?Dakota Reference Manual helps with keyword choice What are benefits/drawbacks of these methods?Example:uniform gridover [-2.0, 2.0]
Dakota Input File: CantileverCentered Parameter Studyenvironmenttabular data output precision 1e-16 Catalog variable/responsesets to tabular file Algorithm configuration:steps in each variable Center point: initial point /initial stateinterface,forkanalysis driver ‘driver.sh' How parameters aremapped to responsesresponses,num objective functions 3response descriptors 'mass' 'stress' 'displacement'no gradientsno hessians Responses from simulationmethodcentered parameter studystep vector 0.1 0.1 2.010 1.e5 5. 10.steps per variable 2variablesactive allcontinuous design 3initial point 2*1.0 20.0descriptors"w""t""L"continuous state 4initial state 500. 29.E 6 50. 100.descriptors'p''E''X' 'Y'
Results: Centered Parameter Study Python plots of Dakota tabular file Univariate effects of parameters oneach response What do you observe? What are benefits/drawbacks?
Exercise: Multi-dimensionalParameter Study Goal: understand how responses area, stress, and displacement vary withrespect to the inputs w and t on a grid of points.Exercise: change previous input file to run the mod cantilever computationalmodel at a grid of points over [1.0, 4.0] using the multidim parameter studymethodTry 9 points in one dimension, 6 in the otherSee method and variable commands in Dakota reference manualWhat parts of the file did you have to change?Example:uniform gridover [-2.0, 2.0]
Dakota Input File and Results: CantileverMulti-dimensional Parameter Studyenvironmenttabular data output precision 1e-16methodmultidim parameter studypartitions 2 2 2 2 2 2 2variablesactive allcontinuous design 3upper bounds 1.2 1.2 6.0lower bounds 0.8 0.8 4.0descriptors"w""t""L"continuous state 4upper bounds 600. 35.E 6 60. 120.lower bounds 400. 23.E 6 40. 80.descriptors'p''E''X' 'Y'Dakota tabular data plotted with Minitabinterface,forkanalysis driver 'driver.sh'responses,num objective functions 3response descriptors 'mass' 'stress' 'displacement'no gradientsno hessiansWhat are benefits/drawbacks?
Dakota Input File and Results: CantileverMulti-dimensional Parameter Study
Workhorse SA Method: Random Sampling Generate space filling design (typicallyMonte Carlo or Latin hypercube withsamples 2x or 10x number of variables) Run model at each point Analyze input/output relationships with Correlation coefficients Simple correlation: strength and directionof a linear relationship between variables Partial correlation: like simple correlationbut adjusts for the effects of the othervariables Rank correlations: simple and partialcorrelations performed on “rank” of data Regression and resulting coefficients Variance-based decomposition Importance factorsTwo-dimensional projectionsof LHD for Cantilever(plotted with Minitab)
Dakota Input File:Cantilever LHS Studymethodsamplingsample type lhssamples 70seed 3845variablesactive allcontinuous design 3upper bounds 1.2 1.2 6.0lower bounds 0.8 0.8 4.0descriptors"w""t""L"continuous state 4upper bounds 600. 35.E 6 60. 120.lower bounds 400. 23.E 6 40. 80.descriptors'p''E''X' 'Y'interfaceforkanalysis driver 'driver.sh'responsesresponse functions 3descriptors 'mass' 'stress''displacement'no gradients no hessians
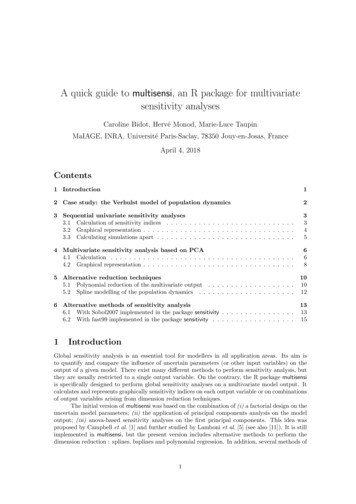
Global Sampling Results for CantileverwtLpEXYPartial Correlation Matrix for -0.030.540.050.120.820.44correlation coefficientsfrom Dakota consoleoutput (colored w/ Excel)(plotted with Matlab)Dakota tabular data plotted in Minitab (can use Matlab, JMP, Excel, etc.)
Group discussion What is expected, limited about this approach? What approaches would you take? What assumptions are we making? How would changingthem affect results?Bounds [-1, 3]Bounds [1, 3]response vs. x1response vs. 33.500.511.522.533.5
Morris One-at-a-Time (MOAT) Sample paths around global space in coordinate directions Give good measure of main (linear, first-order) and interaction / nonlineareffect for modest simulation budget How would you know how to configure Dakota to do this study?
Other SA ApproachesRequire Changing Method Dakota Reference Manual guides in specifying keywordsmethod,samplingsample type lhsseed 52983samples 100LHS Samplingmethod,samplingsample type lhsseed 52983samples 500variance based decompVariance-based Decompositionusing LHS Samplingmethod,dace oasmain effectsseed 52983samples 500Main Effects Analysis usingOrthogonal Arraysmethod,psuade moatpartitions 3seed 52983samples 100Morris One-At-a-Time
Dakota SensitivityAnalysis Summarycentered, vector, listSamplingsampling, dace lhs, dace random, fsu quasi mc,fsu cvtwith variance based decomp.dace {oas, oa lhs, box behnken,central composite}MOATpsuade moatPCE, SCpolynomial chaos, stoch collocationMean valuelocal reliability PgridDACE (DOE-like)importancefactors /local sensisParameterstudiesmain effectsSobol inds.Dakota method namesmodifiedmean, s.d.Categorycorrelations What? Understand code output variations as input factors vary; main effects and keyparameter interactions.Why? Identify most important variables and their interactionsHow? What Dakota methods are relevant? What results?univariatetrends DPAlso see Dakota Usage Guidelines in User’s ManualPDmultipurpose!DDDDDDDD: DakotaP: Postprocessingrd(3 party tools)
Sensitivity Analysis References Saltelli A., Ratto M., Andres T., Campolongo, F., et al., Global Sensitivity Analysis:The Primer, Wiley, 2008.J. C. Helton and F. J. Davis. Sampling-based methods for uncertainty and sensitivityanalysis. Technical Report SAND99-2240, Sandia National Laboratories,Albuquerque, NM, 2000.Sacks, J., Welch, W.J., Mitchell, T.J., and Wynn, H.P. Design and analysis ofcomputer experiments. Statistical Science 1989; 4:409–435.Oakley, J. and O’Hagan, A. Probabilistic sensitivity analysis of complex models: aBayesian approach. J Royal Stat Soc B 2004; 66:751–769.Dakota User’s Manual Parameter Study Capabilities Design of Experiments Capabilities/Sensitivity Analysis Uncertainty Quantification Capabilities (for MC/LHS sampling)Corresponding Reference Manual sections
Provides richer global sensitivity analysis methods . Sensitivity Analysis: Influence of Inputs on Outputs x 1 f(x 1) x 1 f(x 1) . Dakota tabular data plotted in Minitab (can use Matlab, JMP, Excel, etc.) correlation coefficients from Dakota console output (colored w/ Excel) (plotted with Matlab) mass stress displacement w 0.95 -0.96 -0.78