Transcription
Web-based Training on Best Modeling Practices and Technical Modeling IssuesCouncil for Regulatory Environmental ModelingSensitivity and Uncertainty AnalysesNOTICE: This PDF file was adapted from an on-line training module of the EPA’s Council for Regulatory Environmental Modeling Training. To theextent possible, it contains the same material as the on-line version. Some interactive parts of the module had to be reformatted for this noninteractive text presentation.The training module is intended for informational purposes only and does not constitute EPA policy. The training module does not change orreplace any legal requirement, and it is not legally enforceable. The training module does not impose any binding legal requirement. Mention oftrade names or commercial products does not constitute endorsement or recommendation for use.Links to non-EPA web sites do not imply any official EPA endorsement of or responsibility for the opinions, ideas, data, or products presented atthose locations or guarantee the validity of the information provided. Links to non-EPA servers are provided solely as a pointer to information thatmight be useful to EPA staff and the public.1Sensitivity and Uncertainty Analyses
Welcome to CREM’s Sensitivity and UncertaintyAnalyses Module!Table of ContentsPREFACE . 3DESIGN . 4INTRODUCTION . 5Overview . 5Model Evaluation . 6UNCERTAINTY . 9Variability . 9Uncertainty . 10Complexity . 12Summary Table . 14SENSITIVITY ANALYSIS . 15Definition . 15Methods . 16Terminology . 17Parametric . 19Monte Carlo . 20Differential Analysis Methods. 22Example . 23UNCERTAINTY ANALYSIS . 25Uncertainty Analysis . 25Priorities . 27Quantitative Methods. 28Qualitative Approaches . 31Tiered Approach. 35Conceptual Example . 42Capabilities . 44SUMMARY . 46Uncertainty . 46Sensitivity Analysis . 47Uncertainty Analysis . 48SA and UA Resources. 50End of Module . 51REFERENCES . 52Page 1 . 52Page 2 . 53Page 3 . 54GLOSSARY . 552Sensitivity and Uncertainty Analyses
PREFACEEPA’s Council for Regulatory Modeling (CREM) aims to aid in the advancement of modeling science and application to ensure modelquality and transparency. In follow-up to CREM’s Guidance Document on the Development, Evaluation, and Application ofEnvironmental Models (PDF) (99 pp, 1.7 MB, About PDF) released in March 2009, CREM developed a suite of interactive webbased training modules. These modules are designed to provide overviews of technical aspects of environmental modeling and bestmodeling practices. At this time, the training modules are not part of any certification program and rather serve to highlight the bestpractices outlined in the Guidance Document with practical examples from across the Agency.CREM’s Training Module Homepage contains all eight of the training modules: Environmental Modeling 101The Model Life-cycleBest Modeling Practices: DevelopmentBest Modeling Practices: EvaluationBest Modeling Practices: ApplicationIntegrated Modeling 101Legal Aspects of Environmental ModelingSensitivity and Uncertainty AnalysesQA of Modeling Activities (pending)3Sensitivity and Uncertainty Analyses
DESIGN This training module has been designed with Tabs and Sub-tabs. The “active” Tabs and Sub-tabs are underlined. Throughout the module, definitions for bold termsModeling Glossary on the internet.(with the icon) appear in the Glossary. You can also access CREM’s The vertical slider feature from the web is annotated with the same image; superscripts have been added for furtherclarification. The information in the right hand frames (web view) typically appears on next page in the PDF version.Corresponding Figure/TextVertical Slider Feature11What is a model?Vertical Slider #1Image caption. Similar to the web version of the modules, these dialogue boxes will provide you with three important types of information:This box directs the user to additional insight of a topic by linking to other websites or modulesThis box directs the user to additional resources (reports, white papers, peer-reviewed articles, etc.) for a specific topicThis box alerts the user to a caveat of environmental modeling or provides clarification on an important concept.4Sensitivity and Uncertainty Analyses
UNCERTAINTYANALYSISSUMMARYREFERENCESModel EvaluationSENSITIVITY AND UNCERTAINTY ANALYSESThis module builds upon the fundamental concepts outlined inprevious modules: Environmental Modeling 101 and BestModeling Practices: Model Evaluation. The purpose of thismodule is to provide extended guidance on the concepts ofsensitivity and uncertainty analyses – not to provide thoroughinstruction on the available methods or practices. Whenappropriate, this module will point the user in the direction oftechnical guidance.Uncertainty Analysis – Investigates the effects of lack ofknowledge or potential errors of the model (e.g., the uncertaintyassociated with parameter values or model design and output).Sensitivity Analysis – The computation of the effect of changesin input values or assumptions (including boundaries and modelfunctional form) on the outputs.Uncertainty and sensitivity analysis are an integral part of themodeling process (Saltelli et al., 2000).This module will expand upon the topics discussed in CREM’sGuidance Document on the Development, Evaluation, andApplication of Environmental Models (99 pp, 1717 KB, about PDF)5Sensitivity and Uncertainty Analyses
UNCERTAINTYANALYSISREFERENCESModel Evaluation1THE PROCESS OF MODEL EVALUATIONModel evaluation is defined as the process used to generateinformation that will determine whether a model and its analyticalresults are of a sufficient quality to inform a decision (EPA,2009a).Vertical Slider #1Model corroboration assesses the degree to which a modelcorresponds to reality, using both quantitative and qualitativemethods. The modelers may use a graded approach todetermine the rigor of these assessments which should beappropriately defined for each model application.In practice, model evaluation should occur throughout themodel’s life-cycle. For review, the recommended practicesassociated with model evaluation include (EPA, 2009a): SUMMARYQualitative methods, like expert elicitation, can provide thedevelopment team with beliefs about a system’s behavior in adata-poor situation. Utilizing the expert knowledge available,qualitative corroboration is achieved through consensus andconsistency (EPA, 2009a).Peer reviewCorroboration2Quality Assurance (QA) and Quality Control (QC)Sensitivity AnalysisUncertainty Analysis13Similarly,the NRC (2007) has also identified elements ofmodel evaluation.4Links to additional modules with background informationon model evaluation.6Sensitivity and Uncertainty Analyses
23Vertical Slider #2Vertical Slider #3NRC (2007) defined elements of model evaluation:QA Planning and Data Quality AssessmentA well-executed quality assurance project plan (QAPP) helps toensure that a model performs the specified task. The objectivesand specifications of the model set forth in a quality assuranceplan can be subjected to peer review.Data quality assessments are an integral component of any QAplan that includes modeling activities. Similar to peer review, dataquality assessments evaluate and assure that (EPA, 2002a): Evaluation of the scientific basis of the model Computational infrastructure Assumptions and limitations Peer review QA/QC controls and measures the data used by the model is of high quality Data availability and quality data uncertainty is minimized Test cases the model has a foundation of sound scientific principles Corroboration of model results with observations Benchmarking against other models Sensitivity and Uncertainty Analyses Model resolution capabilities Degree of transparencyAdditional Web Resource:Additional information on QA planning (includingguidance documents) can be found at the Agency’swebsite for the Quality System for Environmental Dataand Technology.7Sensitivity and Uncertainty Analyses
4Vertical Slider #4Additional Web Resource:Further information can be found in these modules: The Modeling Life-cycle Best Modeling Practices: Development Best Modeling Practices: Application Best Modeling Practices: Evaluation QA of the Model Life-cycle (Coming Soon)8Sensitivity and Uncertainty Analyses
REFERENCESSummary TableVARIABILITYThe CREM Guidance Document (EPA, 2009a) uses the term“data uncertainty” to refer to the uncertainty caused bymeasurement errors, analytical imprecision and limited samplesizes during data collection and treatment.In contrast to data uncertainty, variability results from theinherent randomness of certain parameters or measured data,which in turn results from the heterogeneity and diversity inenvironmental processes (EPA, 1997). Variability can be bettercharacterized, but hard to reduce, with further study.Separating variability and uncertainty is necessary to providegreater accountability and transparency (EPA, 1997). However,variability and uncertainty are inextricably intertwined and everpresent in regulatory decision making (EPA, 2001a; 2003).9Sensitivity and Uncertainty Analyses
REFERENCESSummary Table1UNCERTAINTYIn the general sense, uncertainty can be discussed in terms of its12nature andtype. Alternatively, uncertainty can also bediscussed in terms of its reducibility or lack thereof (see Mattot etal., 2009).Vertical Slider #1Nature of Uncertainty:The nature of uncertainty can be described as (Walker et al.,2003; Pascual 2005; EPA, 2009b):Uncertainty is present and inherent throughout the modeling3process and within a modeling context is termedmodeluncertainty. Model uncertainty arises from a lack of knowledgeabout natural processes, mathematical formulations andassociated parameters, and/or data coverage and quality.Walker et al. (2003) identify yet another model uncertaintyassigned to the predicted output of the model. Stochastic uncertainty – resulting from errors inempirical measurements or from the world’s inherentstochasticity “Variability-related uncertainty”\ Epistemic uncertainty – uncertainty from imperfectknowledge (of the system being modeled) “Knowledgerelated uncertainty”Despite these uncertainties, models can continue to be valuabletools for informing decisions through proper evaluation andcommunication of the associated uncertainties (EPA, 2009a). Technical uncertainty – uncertainty associated withcalculation errors, insufficient data, numericalapproximations, and errors in the model or computationalalgorithmsUncertainty analysis (UA) investigates the effects of lack ofknowledge or potential errors on model output. When UA isconducted in combination with sensitivity analysis; the modeluser can become more informed about the confidence that canbe placed in model results (EPA, 2009a).10Sensitivity and Uncertainty Analyses
23Vertical Slider #2Vertical Slider #3Type of Uncertainty:Model UncertaintyTotal uncertainty (in a modeling context) is the combination ofmany types of uncertainty (Hanna, 1988; EPA, 1997; 2003,Walker et al., 2003):EPA (2009a) identifies uncertainties that affect model quality. Data/input uncertainty – variability, measurement errors,sampling errors, systematic errorso In some conventions, parameter uncertainty, isdiscussed separately. This type of uncertainty isassigned to the data used to calibrate parametervaluesModel uncertainty – simplification of real-world processes, misspecification of the model structure, use of inappropriate variableor parameter values, aggregation errors, application/scenario11 Application niche uncertainty – uncertainty attributed tothe appropriateness of a model for use under a specificset of conditions (i.e. a model application scenario). Alsocalled ‘scenario uncertainty’. Structure/framework uncertainty – incompleteknowledge about factors that control the behavior of thesystem being modeled; limitations in spatial or temporalresolution; and simplifications of the system. Parameter uncertainty – resulting from datameasurement errors; inconsistencies between measuredvalues and those used by the model.Sensitivity and Uncertainty Analyses
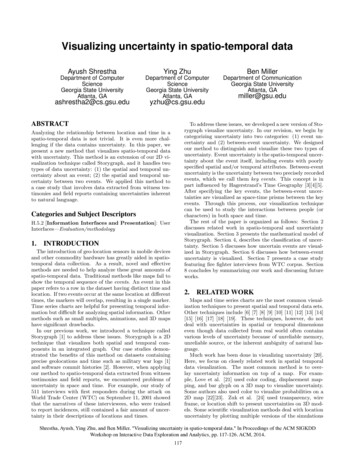
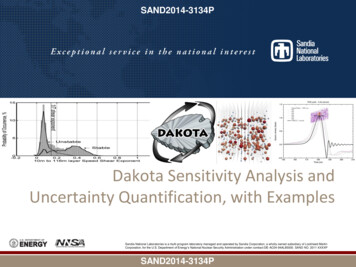
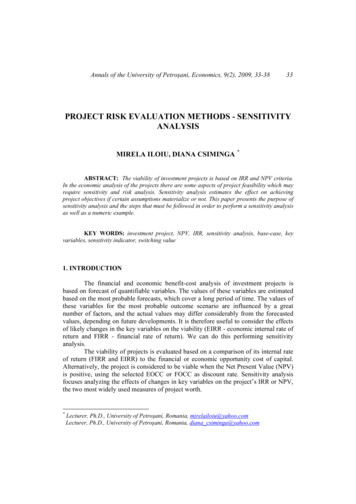
REFERENCESSummary TableMODEL COMPLEXITY AND UNCERTAINTYThe relationship between model uncertainty and modelcomplexity is important to consider during model development.Increasingly complex models have reduced modelframework/theory uncertainty as more scientific understandingsare incorporated into the model. However, as models becomemore complex by including additional physical, chemical, orbiological processes, their performance can degrade becausethey require more input variables, leading to greater datauncertainty (EPA, 2009a).(Figure and caption are on the next page.)An NRC Committee (2007) recommended that models used inthe regulatory process should be no more complicated than isnecessary to inform regulatory decision and that it is oftenpreferable to omit capabilities that do not substantially improvemodel performance.12Sensitivity and Uncertainty Analyses
Relationship between model framework uncertainty and data uncertainty, and their combined effect on total model uncertainty.Application niche uncertainty would scale the total uncertainty. Adapted from Hanna (1988) and EPA (2009a).13Sensitivity and Uncertainty Analyses
REFERENCESSummary TableA SUMMARY OF MODEL AND DATA UNCERTAINTY:Model ata/Input UncertaintyStructural /FrameworkParameterSystematic /Measurement ErrorVariability andRandom ErrorKnowledge relatedKnowledge andVariability relatedN/AVariability esYesYesYes – but alwayspresentCan be bettercharacterized, butnot eliminatedMethod toCharacterizeExpertElicitation;Peer ReviewExpert Elicitation;Peer ReviewBasic statisticalmeasuresBiasBasic statisticalmeasuresHow toResolveAppropriateapplication ofmodelBetter scientificunderstanding;determiningappropriate level ofmodel complexityBetter scientificunderstanding;more datasupporting thevalueImprovedmeasurementsMore sampling14Sensitivity and Uncertainty Analyses
onte CarloSUMMARYREFERENCESDifferential Analysis MethodsExampleSENSITIVITY ANALYSISSensitivity analysis (SA) is a method to determine whichvariables, parameters, or other inputs have the most influence onthe model output. Sensitivity analyses are not ‘pass / fail’evaluations, but rather informative analyses.There can be two purposes for conducting a sensitivity analysis:(1) SA computes the effect of changes in model inputs on theoutputs.(2) SA can be used to study how uncertainty in a modeloutput can be systematically apportioned to differentsources of uncertainty in the model input.****By definition, this second function of sensitivity analysis is aspecial case of uncertainty analysis.A spider diagram used to compare relative changes in modeloutput to relative changes in the parameter values can revealsensitivities for each parameter (Addiscott, 1993). In thisexample, the effects of changing parameters A, B, and C arecompared to relative changes in model output. The legsrepresent the extent and direction of the effects of changingparameter values.15Sensitivity and Uncertainty Analyses
onte CarloMETHODS OF SENSITIVITY ANALYSISREFERENCESDifferential Analysis MethodsExampleScreening ToolsPreliminary screening tools are used instead of more intensivemethods that involve multiple model simulations (Cullen andFrey, 1999; EPA, 2009a). By identifying parameters that havemajor influence on model output, you can focus further analyseson those parameters. Examples of screening tools:There are many methods for sensitivity analysis (SA), a few ofwhich were highlighted in the Guidance on the Development,Evaluation, and Application of Environmental Models (EPA,2009a). The chosen method should be agreed upon duringmodel development and consider the amount and type ofinformation needed from the analysis. Those methods arecategorized into: SUMMARYDescriptive statistics: Select summary statistics(Coefficient of variation, Gaussian approximations, etc.)can be used to indicate the proportionate contribution ofinput uncertainties.Screening ToolsParametric Sensitivity AnalysesMonte Carlo AnalysisDifferential Analysis MethodsScatter plots: A high correlation between an input andoutput variable may indicate dependence of the outputvariation on the variation of the input.Depending on underlying assumptions of the model, it may bebest to start SA with simple methods to identify the mostsensitive inputs and then apply more intensive methods to thoseinputs. A thorough review of methods can be found in Frey andPatil (2002).Pearson’s Correlation Coefficient (ρ): Reflects therelationship between two variables. It ranges from ( 1) to(-1). A correlation (ρ) of ( 1) or (-1) means that there is aperfect positive or negative linear relationship betweenvariables, respectively.16Sensitivity and Uncertainty Analyses
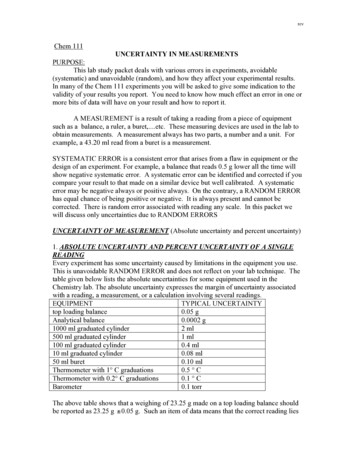
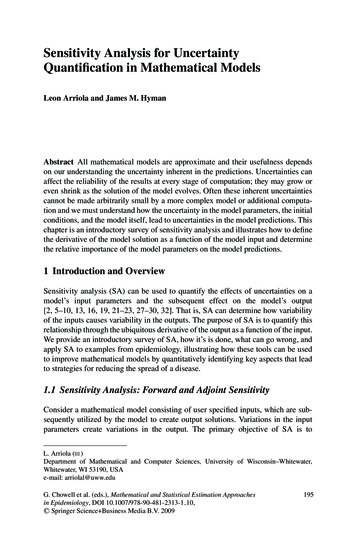
onte CarloSUMMARYDifferential Analysis Methods1TERMINOLOGY FOR SENSITIVITY ANALYSISREFERENCESExampleVertical Slider #1For many of the methods it is important to consider the geometryof the response plane and potential interactions ordependencies among parameters and/or input variables.Response Surface/Plane: A theoretical multidimensional ‘surface’ that describes the response of amodel to changes in input values. A response surface isalso known as a sensitivity surface.1Local Sensitivity Analysis: analysis conducted in closeproximity to a nominal point of a response surface (i.e. worksintensely around a specific set of input values) (EPA, 2003).2Global Sensitivity Analysis: analysis across the entireresponse surface. Global sensitivity analysis can be of use as aquality assurance tool, to make sure that the assumeddependence of the output on the input factors in the modelmakes physical sense and represents the scientificunderstanding of the system (Saltelli et al., 2000).A response surface for a local sensitivity analysis. Here, themodel output (y) is a function of (X1) and (X2). In a localsensitivity analysis, one often assumes a simple (i.e. linear)response surface over an appropriate interval of X1 and X2.Figure was adapted from EPA (2009a).17Sensitivity and Uncertainty Analyses
2Vertical Slider #2A response surface for the function (Y) with parameters X1 and X2. For global sensitivity analyses, it is apparent that assumptions atthe local scale (magnified area) may not hold true at the global scale. Complex (non-linear) functions and interactions amongvariables and parameters change the shape of the response surface. Figure was adapted from EPA (2009a).18Sensitivity and Uncertainty Analyses
onte CarloSUMMARYREFERENCESDifferential Analysis MethodsExamplePARAMETRIC SENSITIVITY ANALYSISParametric sensitivity analysis is a very common methodwhich provides a measure of the influence input factors (data orparameters) have on model output variation. It does not quantifythe effects of interactions because input factors are analyzedindividually. However, this approach can indicate the presence ofinteractions.A base case of model input values are set and then for eachmodel run (simulation) a single input variable or parameter ofinterest is adjusted by a given amount, holding all other inputsand parameters constant (sometimes called “one-at-a-time”).A non-intensive sensitivity analysis can first be applied to identifythe most sensitive inputs. By discovering the ‘relative sensitivity’of model parameters, the model development team is thenaware of the relative importance of parameters in the model andcan select a subset of the inputs for more rigorous sensitivityanalyses (EPA, 2009a). This also ensures that a singleparameter is not overly influencing the results. This approach isconsidered non-intensive, in that it can be automated in someinstances.An example of non-intensive sensitivity analysis. Relativesensitivities of F (model output) with respect to parameters a andb. In this example, it is clear that parameter a has little influenceon the model output, F; however, parameter b, has an interestingeffect on model output, F. Adapted from EPA (2002b).An example of a parametric sensitivity analysis is given on theExample subtab in this section.19Sensitivity and Uncertainty Analyses
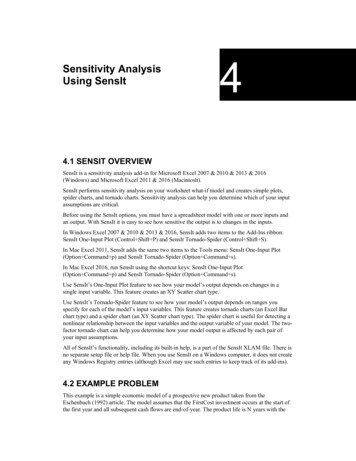
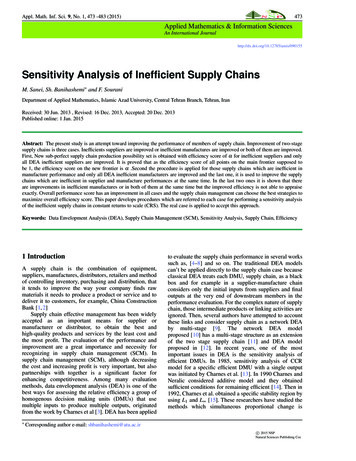
onte CarloSUMMARYREFERENCESDifferential Analysis MethodsExampleMONTE CARLO ANALYSISMonte Carlo simulations are based on repeated sampling andare a popular way to incorporate the variance of the input factors(e.g. parameter values or data) on the model output. Dependingon the work and time needed to run the model, Monte Carlosimulations (often 1000’s of iterations) can be difficult toimpossible.Overview of a Monte Carlo simulation:1. Randomly draw a value for each parameter of interestfrom an appropriate distribution. Note that the multipleparameters can be analyzed simultaneously.(Figure and caption are on the next page.)2. Run the model to make a prediction using the selectedset of parameters3. Store prediction4. Repeat MANY times5. Analyze the distribution of predictionsMore examples of Monte Carlo simulations appear in the nextsection under Quantitative Methods.20Sensitivity and Uncertainty Analyses
This figure is an example of the Monte Carlo simulation method. The distribution of internal concentration (model output) versus timeis simulated by repeatedly (often as many as 10,000 iterations) sampling input values based on the distributions of individualparameters (blood flow rate, body weight, metabolic enzymes, partition coefficients, etc.) from a population. Adapted from EPA(2006).21Sensitivity and Uncertainty Analyses
onte CarloDIFFERENTIAL ANALYSISSUMMARYREFERENCESDifferential Analysis MethodsExampleThe assumptions for differential sensitivity analysisinclude (EPA, 2009a):Differential analyses typically contain four steps. Again,depending on the work and time needed to run the model, thisapproach can be difficult to impossible. The model’s response surface is hyperplane The results of a sensitivity analysis only apply to specificpoints on the response surface and that these points aremonotonic first order Interactions among input variables are ignoredFour steps of a differential analysis (Saltelli et al., 2000; EPA,2009a):1. Select base values and ranges for input factors.2. Using the input base values, develop a Taylor seriesapproximation to the output.Further Insight:3. Estimate uncertainty of the output in terms of its expectedvalue and variance using variance propagationtechniques.Computational methods for this technique are described in:Morgan, G., and M. Henrion. 1990. Uncertainty: A Guide toDealing With Uncertainty in Quantitative Risk and PolicyAnalysis. Cambridge, U.K.: Cambridge University Press.4. Use the Taylor series approximations to estimate theimportance of individual input factors22Sensitivity and Uncertainty Analyses
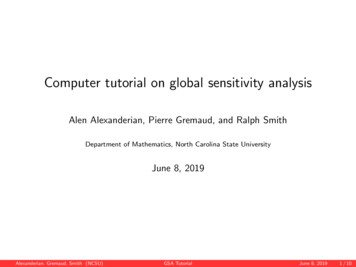
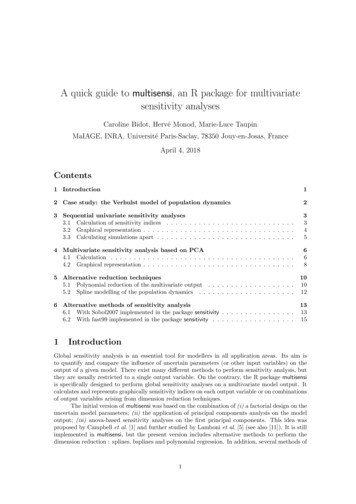
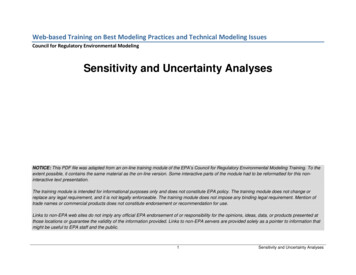
onte CarloSUMMARYDifferential Analysis Methods1PARAMETRIC ANALYSIS OF THE MARKAL MODELREFERENCESExampleVertical Slider #11MARKAL is a data-intensive, technology-rich, energysystems economic optimization model that consists of twoparts: an energy-economic optimization framework a large database that contains the structure and attributesof the energy system being modeled.Additional Web Resources:Additional information on the MARKet Allocation(MARKAL) model:2An illustrative example of a sensitivity analysis ofMARKAL to examine the penetration of hydrogen fuel cellvehicles into the light-duty vehicle fleet is tracked (Y-axis) asmodel output. The reference case level of hydrogen fuel cellvehicle penetration in 2030 is 0%. This is represented by thepoint at the origin. The magnitude of each input is increased anddecreased parametrically along a range deemed realistic for realworld values. The figure shows, for example, that a 25% increasein gasoline and diesel cost results in a model-predicted hydrogenfuel cell vehicle penetration of approximately 12%. Increasing thecost of gasoline and diesel by 50% increases penetration toaround 25%. The analysis conveys a great deal of information,including not only the maximum magnitude of the response butalso the response threshold and an empirical function of thatresponse. Background and development information forMARKAL An Agency website describing MARKAL(Note: Results shown are for illustrative purposes only)23Sensitivity and Uncertainty Analyses
2Vertical Slider #2H2-FCV Penetration (%), 203035%30%25%20%Gasoline/diesel costH2 -FCV costGasoline-HEVefficiencyGasoline-HEV cost15%10%Cost ofH2 fuel5%0%-40% -30% -20% -10% 0%10% 20% 30% 40% 50% 60% 70% 80% 90% 100%% Change from Reference ValueSensitivity diagram in which five inputs to the MARKAL model are changed parametrically and the response of an output is tracked.Note: Results shown above are for illustrative purposes only.The inputs evaluated in this parametric sensitivity analysis include:(1) the cost of gasoline and diesel fuel(2) the cost of gasoline hybrid-electric vehicles (Gasoline-HEVcost)(3) the cost of hydrogen fuel cell vehicles (H-FCVcost)(4) the efficiency of gasoline hybrid electric vehicles (Gasoline-HEV efficiency)(5) the cost of H2 fuel.24Sensitivity and Uncertainty Analyses
Y ANALYSISThe end goal of an uncertainty analysis may be to examine andreport the sources and level of uncertainty associated with themodeling results. The level of uncertainty should meet the criteriadetermined at the onset of the modeling activity. This informationcan also help to identify areas that may need more research toreduce the associated uncertainty.(Vertical sliders are on the next page.)Some uncertainties can be quantified (e.g. data/input, parameter,and model output); whereas other uncertainties are bettercharacterized qualitatively (e.g. model framework and theunderlying theory or model application). Therefore, uncertaintyanalysis is presented in both quantitative and qualitativeapproaches.1Questions to consider before an uncertaintyanalysis2Further insight into uncertainty analysis25Sensitivity and Uncertainty Analyses
12Vertical Slider #1Vertical Slider #2Questions to consider before
Sensitivity Analysis - The computation of the effect of changes in input values or assumptions (including boundaries and model functional form) on the outputs. Uncertainty and sensitivity analysis are an integral part of the modeling process (Saltelli et al., 2000). This module will expand upon the topics discussed in CREM's