Transcription
Sensitivity Analysis for UncertaintyQuantification in Mathematical ModelsLeon Arriola and James M. HymanAbstract All mathematical models are approximate and their usefulness dependson our understanding the uncertainty inherent in the predictions. Uncertainties canaffect the reliability of the results at every stage of computation; they may grow oreven shrink as the solution of the model evolves. Often these inherent uncertaintiescannot be made arbitrarily small by a more complex model or additional computation and we must understand how the uncertainty in the model parameters, the initialconditions, and the model itself, lead to uncertainties in the model predictions. Thischapter is an introductory survey of sensitivity analysis and illustrates how to definethe derivative of the model solution as a function of the model input and determinethe relative importance of the model parameters on the model predictions.1 Introduction and OverviewSensitivity analysis (SA) can be used to quantify the effects of uncertainties on amodel’s input parameters and the subsequent effect on the model’s output[2, 5–10, 13, 16, 19, 21–23, 27–30, 32]. That is, SA can determine how variabilityof the inputs causes variability in the outputs. The purpose of SA is to quantify thisrelationship through the ubiquitous derivative of the output as a function of the input.We provide an introductory survey of SA, how it’s is done, what can go wrong, andapply SA to examples from epidemiology, illustrating how these tools can be usedto improve mathematical models by quantitatively identifying key aspects that leadto strategies for reducing the spread of a disease.1.1 Sensitivity Analysis: Forward and Adjoint SensitivityConsider a mathematical model consisting of user specified inputs, which are subsequently utilized by the model to create output solutions. Variations in the inputparameters create variations in the output. The primary objective of SA is toL. Arriola (B)Department of Mathematical and Computer Sciences, University of Wisconsin–Whitewater,Whitewater, WI 53190, USAe-mail: arriolal@uww.eduG. Chowell et al. (eds.), Mathematical and Statistical Estimation Approachesin Epidemiology, DOI 10.1007/978-90-481-2313-1 10, C Springer Science Business Media B.V. 2009195
196L. Arriola and J.M. Hymanprecisely quantify the ratio of output perturbations with respect to the input perturbations. That is, SA provides an approach to determine which parameters havethe most/least effect on the output solution. For example, if u denotes the outputsolution to a mathematical model and p denotes any of the input parameters, theprimary objective of SA is to efficiently calculate u/ p.We introduce and apply the concepts and methodology of SA to three types ofmathematical models:rrrstatic problemsdynamical systemsoptimization problemsAlthough static problems do not change in time, they can include complexrelationships between parameters and the solution. As a typical example, consider solving a system of linear equations Au b. SA can determine how thesolution u depends on perturbations to the coefficients ai j or the right-hand sideterms bi . Perturbations to these input parameters will directly affect the solutionand raises the question: Which of these parameters has the most effect on thesolution? To answer this question, we calculate the derivative expression u/ p,where p represents any of the ai j or bi by introducing an auxiliary problem-theadjoint problem. This adjoint problem will allow us to efficiently find the desiredderivative.The same type of situation occurs for the common eigenvalue problem Au λu that arises, for example, in determining the reproductive number in epidemicmodels. Since the eigenstructure of this linear operator depends on the underlying parameter space, uncertainty in the ai j produces uncertainty in the eigenvalues and eigenvectors of A. SA is an approach that can define how λ or uwill change if the elements of the matrix A change as measured by: λ/ ai jand u/ ai j . We will use the adjoint SA methodology to derive explicit formulafor the derivatives of the eigenvalue and eigenvector. In epidemic models, theelements of A are often functions of the parameters, such as the infectivity or population size, in the underlying mathematical model and SA is used to determinehow the eigenvalues change as a function of, say, a change in the transmissionrate.Epidemiological phenomena are often modeled by time dependent ordinarydifferential equations (ODEs), or if there is spatial, age, or other relational dependences, by partial differential equations (PDEs). If the time or spatial dependenceis formulated on a lattice structure, then difference equations can be used as themathematical model. Often the parameters or initial conditions (IC’s) are not knownexactly. Again, SA is an approach that can quantify how the uncertainty in inputvalues is related to uncertainty in the model output u u(t). As in the staticcase, we will introduce an appropriate auxiliary problem, the adjoint problem. Whenchosen properly, the adjoint formation can reduce the computational complexity toanswer targeted questions when the full SA is not needed, or is not computationallyfeasible.
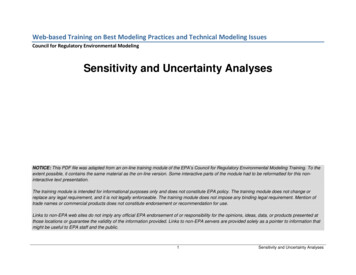
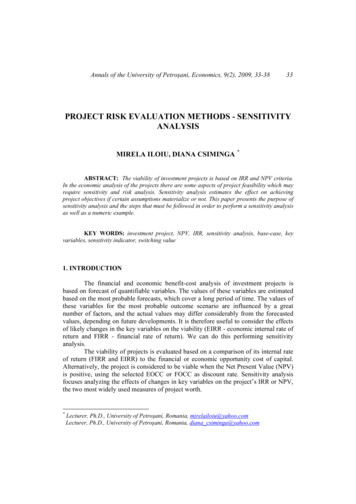
Sensitivity Analysis for Uncertainty Quantification in Mathematical Models1971.2 Parameter EstimationParameter estimation is needed:rrrrwhen there is observational data with significant errors,when there are unknown or unspecified parameters, in the model that must beestimated (parameter estimation (PE)),to quantify the inevitable effects of uncertainty, in the observed data set and onthe specification of parameter values, which ultimately leads to uncertainty in themodel prediction (forward sensitivity analysis (FSA)), andto determine which regions in time or parameter space have the most effect onthe model prediction (adjoint sensitivity analysis (ASA)).Consider the graphical representation in Fig. 1 of the overall structure of theFSA problem, where ODS represents observational data set, PS denotes the parameter space, and MP represents the set of model predictions. Notice that the PS ispartitioned into two disjoint sets; one containing those parameters for which wecurrently do not have specified values: { p1 , . . . , pk }, and the other set of parameterswhich do have assigned values { pk 1 , . . . , pk l }. The application of a computationalalgorithm whereby one uses the incomplete ODS and obtains specific values for theunknown parameters can be viewed as the mapping F : ODS { p1 , . . . , pk }. Thisis the objective of data assimilation. Once the unknown parameters are specified,the mathematical model can be evaluated providing the MP, that is, G : PS MP.Measurement errors in the ODS (shown as the dashed curves in Fig. 2) introduceuncertainties produce uncertainty in the PS, and hence uncertainty in the MP.{P1,.PK}{PK 1,.PK L}ODSPSMPFig. 1 Using the observational data set (ODS) to obtain values for unspecified parameters{ p1 , . . . , pk } in the parameter space (PS), which allows evaluation of the epidemiological modelto obtain the model prediction (MP){P1,.PK}{PK 1,.PK L}ODS δODSPS δPSMP δMPFig. 2 Uncertainty in the ODS, (shown as dashed curves), produces uncertainty in the PS, whichleads to uncertainty in the MP of the epidemiological model
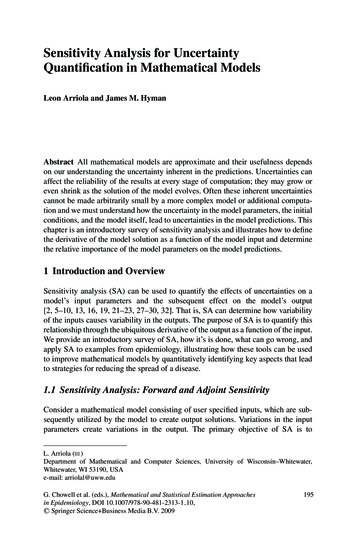
198L. Arriola and J.M. HymanWe will describe local SA approaches to estimating the change in the solutionresulting from small changes in nominal fixed values of the defining parameters.This introduction to SA will not discuss in detail the methodology of data assimilation, as applied to parameter estimation in epidemiology. However, we willprovide the basic tools needed for parameter estimation. Furthermore, global SA(uncertainty quantification) [28] issues such as the sensitivity of bifurcation points,critical/degenerate points, extrema, variance-based methods such as Monte Carlomethods or the Fourier Amplitude Sensitivity Tests, Latin Hypercube or FractionalFactorial sampling, or Bayesian SA.2 Sensitivity Analysis2.1 Normalized Sensitivity IndexThe fundamental objective of SA is to quantitatively estimate how uncertainty ofinputs gives rise to uncertainties of the model outputs. In particular, we describeFSA and ASA for deterministic (non-stochastic) mathematical models.FSA quantitatively determines how the output solution u, to our mathematicalmodel, or some response function(al) J (u), changes as small perturbations are madeto a model parameter p, as is shown in Fig. 3. If the solution and functional aredifferentiable wrt. a parameter p, then in FSA we calculate the derivatives u/ pand J (u)/ p and define the normalized sensitivity indexes (SI): 1δuδpp u(1) Su p : limδp 0upu p δ J δp 1J uS J p : lim.(2) δp 0 Jpp pThe normalized SI [13, 28–30] measure the relative change in the output δu/u orδ J/J , wrt. a small relative change to the input δp/ p.Fig. 3 The forward problem(FP-top figure) takes nominalinput parameters p andproduces the associatedoutput solution u. Forwardsensitivity analysis(FSA-bottom figure)introduces perturbations tothe input parameters, via δpand quantifies the subsequentperturbations to the outputsolution via δuPP δPFPFPFSAUU δU
Sensitivity Analysis for Uncertainty Quantification in Mathematical ModelsFig. 4 Adjoint sensitivityanalysis (ASA) introducesperturbations to the outputsolution, via δu andquantifies how these changesare related to perturbations inthe input parameters via δpP δqFP199U δvASAOne of the pitfalls in applying the results of SA is in not paying close attention tothe relationships between the signs of S, u, δu, p, and δp. Often the output variableu is nonnegative, such as the infected population in an epidemic model and, withoutloss of generality, we will assume that the parameters and output variables in thisarticle are all positive. When this is not the case, then the analysis must pay closeattention to signs of the variables.If the mathematical model is a dynamical system, then the SI can depend ontime and the relative importance of the parameters can also depend on time. Forexample, for t tc , the parameter p1 might have more affect on the solution thanthe parameter p2 , whereas for t tc the roles of importance might reverse. Thisoften occurs when comparing the relative importance of model parameters in earlyand late stages of an epidemic.Whereas, for dynamical systems, FSA measures the future change in the solutioncaused by small changes in the parameters, ASA [12, 21–23] looks back in time, asshown in Fig. 4.2.2 Motivation for Sensitivity AnalysisConsider the two species symbiotic population model [26] given bydu 1 u 1 (1 u 1 au 2 )dtdu 2 bu 2 (1 u 2 cu 1 ),dt(3)(4)where the parameters a, b, and c are nonnegative, ac is constant, and we are giventhe initial population of the two species as u 1 (0) and u 2 (0). For physical reasons, werequire that the parameters satisfy the conditions 0 a, c 1.Some typical questions one might ask arerrrWhich of the parameters has the most influence on the value (not stability) of theequilibrium point(s)?Which of the parameters has the most influence on the stability/instability of theequilibrium points?Which of the parameters has the most influence on the time dependent solutionsu 1 and u 2 ?For more sophisticated models [1], numerous other relevant questions could easilycome to mind. We will study this problem in more detail in the following sections.
200L. Arriola and J.M. Hyman3 Linear System of Equations and Eigenvalue Problem3.1 Linear System of Equations: Symbiotic PopulationFor the two species symbiotic population model given above, let us determine whichof the three parameters has the most influence on the value (not stability) of theequilibrium point(s) (ū 1 , ū 2 ) of Equations (3, 4). In other words, we would like toknow how the solutions (ū 1 , ū 2 ) of the steady state systemū 1 (1 ū 1 a ū 2 ) 0bū 2 (1 ū 2 cū 1 ) 0are affected by changes to the two parameters a or c.Solving this nonlinear system, we find the four equilibrium points 1 a 1 c,(ū 1 , ū 2 ) (0, 0), (0, 1), (1, 0),1 ac 1 ac .Notice that the extinct and single species equilibrium points (0, 0), (0, 1), and (1, 0)are independent of the a or c and therefore are unaffected by perturbations tothese parameters. The two species equilibrium point however does depend on theseparameters in which case we find the normalized relative sensitivity indices to bea(1 c)a ū 2aca ū 1 , ,ū 1 aū 2 a(1 a)(1 ac)1 acacc ū 2c(1 a)c ū 1 ,and .ū 1 cū 2 c1 ac(1 c)(1 ac)Notice that the sensitivity of u 1 wrt. c is the same as it is for u 2 wrt. a.The relative importance, as measured by the sensitivity indices, may be differentin different regions of the parameter space. For this example, consider the sensitivityof u 1 wrt. a and u 2 wrt. c, where we want to know what the ordering is;a ū 1c ū 1?ū 1 aū 2 ca(1 c)c(1 a) ? (1 a)(1 ac)(1 c)(1 ac)1 c1 a? . caHere the symbol ? is an inequality symbol, such as or . Since the functionf (x) : (1 x)/ x, for x (0, 1) is a strictly decreasing function, if x1 x2 , then
Sensitivity Analysis for Uncertainty Quantification in Mathematical Models201f (x1 ) f (x2 ). In other words, the relative importance, via the sensitivity indices,depends on whether c a or c a.Although we now have a methodology for determining the sensitivity of theequilibrium points, even more information can be gleaned by using SA for theevolution of the solution. In simpler examples the closed form solution is easilyfound and elementary calculus can be applied to find the associated sensitivityindices.Let us restate and reformulate the problem of interest, that is to obtain the derivatives ū 1 / p and ū 2 / p, where p represents any of the three parameters a, b orc. Even when the closed form solutions for the equilibrium points is not known,then we can directly construct the FSA by differentiating the equilibrium problem.The associated forward sensitivity equations (FSE) containing these derivatives arefound by taking the partial derivatives / p of both equilibrium equations, andapplying the standard chain rule, to get the linear systemDu u p F, pwhere, the notation we use will become apparent shortly, 1 2ū 1 a ū 2Du bcū 2 a ū 1,b(1 2ū 2 cū 1 ) ū 1 p u , p ū 2 p a ū 1 ū 2 p . p F c ū 1 ū 2 pOne could calculate D 1u directly, however for large systems of equations thisprocedure is both analytically difficult or computationally expensive. Direct inversion of the linear operator should always be avoided, except in very small systems.Instead for large systems, we obtain D 1u p F by introducing an auxiliary problemcalled the adjoint problem.Before describing the adjoint problem, we make the important observation thatthe system of equations defining the derivative du/dp is always a linear system,even though the original system was nonlinear. This particular example suggeststhat although the equilibrium point(s) could be solutions to nonlinear equations, theFSE’s are linear in the derivative terms. To see this is true in general, consider the2-D systemdu 1 f 1 (u 1 , u 2 ; p)dtdu 2 f 2 (u 1 , u 2 ; p)dt
202L. Arriola and J.M. Hymanwhere f 1 and f 2 are differentiable in u 1 , u 2 and p. Since the equilibrium points aresolutions of the nonlinear systemf 1 (ū 1 , ū 2 ; p) 0f 2 (ū 1 , ū 2 ; p) 0then the associated FSE’s is the linear systemDu u p F, p(5)where f1 f1 ū 2 , f2 ū 1 Du f2 ū 1 ū 2 ū 1 p u , p ū 2 p f 1 p p F f2 p . .The notation chosen is suggestive: Du denotes the Jacobian wrt. the variables u and p F denotes the gradient wrt. the parameters p.Thus, the FSE for the equilibrium solutions of the IVP can be written in thegeneral formAw b,(6)where A is a real N N nonsymmetric and nonsingular matrix, which in this example is the Jacobian matrix. Let p denote any of the parameters ai j or bi and assumethat for the specified values of p, the forward solution w is a differentiable functionof the parameters and is sufficiently far away from any singularities in the parameterspace, then the FSE are given byA b A w w. p p p(7)Since perturbations to the parameter p produces perturbations in the forward solution w, FSA requires the calculation of the derivative w/ p. This FSE equationcould be solved by premultiplying by the matrix inverse A 1 , however, for largersystems, this procedure is computationally expensive, often numerically unstable,and should be avoided if at all possible.The ASA accomplishes the same goal, while avoiding computing A 1 , byintroducing an auxiliary problem which isolates how the solution depends on theparameters; that is, w/ p. This is accomplished by defining an appropriate innerproduct and cleverly choosing conditions so as to isolate the desired quantity. For
Sensitivity Analysis for Uncertainty Quantification in Mathematical Models203this simple case, we use the usual vector inner product for standard Euclidean spaceand premultiply the FSE by some, as of yet unspecified, nontrivial vector vTvT A w vT p b A w . p p(8)Now consider the 1 N vector cT : vT A, or written as the associated adjointproblemAT v c.(9)Since we wishterm w/ p, choose N forcing vectors of the to isolate the derivative form ciT 0 · · · 0 1 0 · · · 0 , where the 1 is located in the ith column. This forcesthe product vT A to project out the desired components wi / p, for i 1, . . . , N ,in which case wi viT p b A w . p p(10)This particular choice for the adjoint problem leads to an intimate relationshipbetween the inverse matrix A 1 and the matrix of adjoint vectors V : v1 v2 · · · vN , namely VT A 1 . The relationships between the forward andadjoint problems and sensitivity equations, in this example, shown in Fig. 5, illustrates connections between the forward and adjoint problem.3.2 Stability of the Equilibrium Solution: The Eigenvalue ProblemThe stability of the equilibrium solution of (3) and (4) depends upon the eigenvalues of the Jacobian of the linearized system at the equilibrium. These eigenvaluesare functions of the parameters p. Therefore, we can use sensitivity analysis toFig. 5 The relationshipsbetween the forwardsensitivity and associatedadjoint problems creates aself-consistant framework forsensitivity analysis
204L. Arriola and J.M. Hymandetermine how the stability of an equilibrium point is affected by changes to theparameters. The eigenvalues λ of the Jacobian A 1 2ū 1 a ū 2 a ū 1 bcū 2b (1 2ū 2 cū 1 )(11)could be found by constructing the characteristic polynomial and solving the associated characteristic equationp(λ) λ2 (1 2ū 1 a ū 2 b(1 cū 1 2ū 2 ) λ abcū 1 ū 2andp(λ) 0.For this simple problem, the eigenvalues can be explicitly found, and subsequentlythe derivatives λ/ p can be calculated. However, as the system of differential equations increases, so does the degree of the associated characteristic polynomial andthis approach becomes impracticable. The roots of high degree polynomials cannotbe defined analytically, and the numerical methods for finding these roots oftensuffer from numerical instabilities.As was done in the previous example of finding the sensitivity of a linearsystem of equations, we proceed to find the sensitivity of the right eigenvalueproblem1Au λu(12)where A is an N N nonsymmetric matrix with distinct eigenvalues and an associated complete, nonorthonormal set of eigenvectors, which span R N . This particularexample will shed light on a significant inherent limitation of ASE that is rarelydiscussed, much less emphasized.Since the eigenvalues λ and the eigenvectors u depend on the coefficients ai j ,differentiate the right eigenvalue problem to get the FSEA A u λ u u λ u. ai j ai j ai j ai j(13)The difficulty that arises in this example is that there are two unknown derivatives ofinterest, the derivative of the eigenvalues λ/ ai j and the derivative of the eigenvectors u/ ai j . The purpose of the adjoint methodology is to produce one, and onlyone, additional auxiliary problem. That is, a single associated adjoint problem canonly be used to find the derivative of the eigenvalues or the derivative of the eigenvectors, but not both simultaneously. As we will show, using the adjoint problem tofind λ/ ai j precludes the ability to find u/ ai j , unless additional information isprovided.1 As we will see shortly, the associated left eigenvalue problem is the adjoint problem for (12),namely AT v λv.
Sensitivity Analysis for Uncertainty Quantification in Mathematical Models205Let v be some nonzero, as yet unspecified, vector and take the inner product withthe FSE (13) to get() () A λ u u, v u, v (A λI),v . ai j ai j ai j(14)Because (A λI)T AT λI, we can use the Lagrange identity for matrices, underthe usual inner product, to get((A λI)) () u T u,v , A λI v . ai j ai jNow annihilate the second inner product by forcing the adjoint conditionAT v λv,(15)which is known as the left eigenvalue problem. For the original eigenvalue problem,the left eigenvalue problem is the associated adjoint problem. (For more details, see[18, 32].)The properties of the left and right eigenvalue problems include:rrrrIf the right eigenvalue problem has a solution, then the left eigenvalue also has asolution.The right and left eigenvectors u and v are distinct, for a specified eigenvalue λ. TThe right eigenvectors u(k) u 1 (k) u 2 (k) · · · u N (k) and left eigenvectors v(l) (l) (l)* T v1 v2 · · · v N (l) are orthogonal for k l and u(k) , v(k) 0 for k l.Using previous result, the right and left eigenvectors can be normalized, i.e.,* (k) theu , v(k) 1.Using the left eigenvalue problem (adjoint problem), Equation (14) reduces to λ u, v vi u j . ai jSince the right and left eigenvectors are normalized, the explicit expression for thederivative of the eigenvalue wrt. the coefficients ai j is λ vi u j . ai j(16)To find an explicit expression for u/ ai j , we must introduce additional information. The reason for this diversion is that no new information can be gleenedabout u/ ai j from the adjoint problem. The key to making further progress is torecall that we have assumed that the N N matrix A has N distinct eigenvalues, inwhich case there exists a complete set of N eigenvectors. We now make use of the
206L. Arriola and J.M. Hymanfact that any vector in C N can be expressed as a linear combination of the spanningeigenvectors. Since u/ ai j is an N 1 vector, we can write this derivative as alinear combination of the eigenvectors.It will be helpful to introduce some additional notation describing the right andleft eigenvector matrices U and V, whose columns are the individual eigenvectorsu(k) and v(k) respectively, and let Λ be the diagonal matrix of eigenvalues λk , that is U : u(1) u(2) · · · u(N ) , V : v(1) v(2) λ10 λ2 · · · v(N ) and Λ : . 0λNUsing this notation, the right and left eigenvalue problems can be written asAU UΛandAT V VΛ.(17)Earlier we forced the right and left eigenvectors to be normalized, and thereforethe matrix of eigenvectors satisfy the identityVT U I.(18)The derivative of the matrix of eigenvectors can written as a linear combination ofthe eigenspace; U UC .(19) ai jThis equation defines the coefficient matrix c1 (1) c1 (2) c1 (3) · · · c1 (N ) c2 (1) c2 (2) c2 (3) · · · c2 (N ) C : . , . (1)(2)(3)c N c N c N · · · c N (N )(20)where for a fixed eigenvector u(k) , the derivative can be expanded as the sum u(k) c1 (k) u(1) · · · ck (k) u(k) · · · c N (k) u(N ) . ai j(21)We now describe how to define the coefficients cl (m) .Differentiating the right eigenvector matrix Equation (17) givesA U A Λ U U U Λ. ai j ai j ai j ai j(22)
Sensitivity Analysis for Uncertainty Quantification in Mathematical Models207Using Equation (17) and (19) and rearranging we getU [Λ, C] U Λ A U, ai j ai j(23)where [·, ] denotes the commutator bracket [Λ, C] : ΛC CΛ.Next, premultiply by the left eigenvector matrix and use the normalizationcondition, this equation reduces to[Λ, C] A Λ VTU. ai j ai j(24)Expanding the commutator bracket we find that 0 c2 (1) (λ2 λ1 ) c (1) (λ λ )331[Λ, C] . . c1 (2) (λ1 λ2 )0c3 (2) (λ3 λ2 ) c1 (3) (λ1 λ3 ) · · · c1 (N ) (λ1 λ N )c2 (3) (λ2 λ3 ) · · · c2 (N ) (λ2 λ N ) 0· · · c3 (N ) (λ3 λ N ) . . .c N (1) (λ N λ1 ) c N (2) (λ N λ2 ) c N (3) (λ N λ3 ) · · ·0(25)Since the right side of Equation (24) is known, and because we assumed that theeigenvalues are distinct, we can solve for the off-diagonal coefficientscl(m) 1T AV Uλl λm ai j lmfor l m.(26)The next task is to find the values of the diagonal coefficients. Once again, wemake use of the fact that the eigenvectors form a basis for C N . To solve for thescalar diagonal coefficients ck (k) in (21), we first transform this vector equation to ascalar* equationby normalizing the right eigenvectors. That is, we force the condi tion uk , uk 1. Next, we fix the indexes i, j and differentiate this normalizationcondition to getukT uk ukT k u 0. ai j ai jBecause ukT k uku ukT, ai j ai j
208L. Arriola and J.M. Hymanit follows that uk and uk / ai j are orthogonal, in which case we obtain the Nequations( k) ufor k 1, . . . N .(27), uk 0, ai jNext premultiply, the summed version of the derivative of the eigenvector (21), byu(k) to getc1 (k) u(1) , u(k) · · · ck (k) u(k) , u(k) · · · c N (k) u(N ) , u(k) 0.Since the individual eigenvectors have been normalized, we can solve for thediagonal coefficients in terms of the known off diagonal coefficients:Nck (k) ci (k) u(i) , u(k) .(28)i 1i k4 Dimensionality ReductionWhen considering a mathematical model where some of the variables may be redundant, one would like to be able to identify, with confidence, those variables that canbe safely eliminated without affecting the validity of the model. To not inadvertentlyeliminate significant variables, one must identify groups of variables that are highlycorrelated. In essence, one is trying to identify those aspects of the model that arecomprised of strongly interacting mechanisms. A problem arises when one usesdata, which contain errors or noise, to estimate the correlation between these variables and use these estimates to determine which variables can be safely eliminated.Thus, uncertainty in the data can create uncertainty in the correlation estimates andultimately in the reduced model.For example, consider an imaginary disease for which a specific blood test can,with certainty, identify whether the patient has or does not have this disease. Nowsuppose that there exists a medication whose sole purpose is to treat this particulardisease. When constructing a model of this scenario, the number of prescriptionsfor this medication and the positive blood test results are highly correlated. Assuming that the examining physician always prescribes this medication the correlationwould in fact be 1.0. The information contained in these two data sets are redundant. Either the number of positive blood test results or the number of prescriptionsprovides sufficient information about the number of positively diagnosed infections.Taking a geometric perspective of this scenario, since the two data sets are so highlycorrelated, a projection from a 2-dimensional parameter space to a 1-dimensionalspace would be appropriate.Now consider the more realistic scenario where public health officials are monitoring a seasonal outbreak of a disease. Syndromic surveillance or biosurveillance data of clinical symptoms such as fever, number of hospital admissions,over-the-counter medication consumption, respiratory complaints, school or work
Sensitivity Analysis for Uncertainty Quantification in Mathematical Models209absences, etc., while readily available, does not directly provide accurate numerical quantification of the size of the outbreak. Furthermore, “noise” in the datacauses inaccuracy of any specific numerical assessments or predictions. Additionally, symptoms such as fever and respiratory complaints have different levels ofcorrelation for different diseases, and therefore difficulties arise in determiningwhich factors are redundant and which factors are essential to the model. In otherwords, it would be desirable to identify the highly correlated variables, in whichcase we could reduce the dimension of the data, without significantly degrading thevalidity of the model, and minimize the effects of noise.4.1 Principal Component AnalysisPrincipal component analysis (PCA) is a powerful method of modern data analysisthat provides a systematic way to reduce the dimension of a complex data set toa lower dimension, and oftentimes reveals hidden simplified structures that wouldotherwise go unnoticed.Consider an M N matrix of data measurements A with M data types and Nobservations of each data type. Each M 1 column of A represents the measurementof the data types at some time t for which there are N time samples. Since any M 1vector lies in an M-dimensional vector space, then there exists an M-dimensionalorthonormal basis that spans the vector space. The goal of PCA is to transform thenoisy, and possibly redundant data, set to a lower dimensional orthonormal basis.The desired result is that this new basis will effectively and successively filter outthe noisy data and reveal hidden structures among the data types.The way this is accomplished is based on the idea of noise, rotation, and covariance. When performing measurements, the problem of quantifying the effect ofnoise has on the data set is often defined by the signal-to-noise ratio
1.1 Sensitivity Analysis: Forward and Adjoint Sensitivity Consider a mathematical model consisting of user specified inputs, which are sub-sequently utilized by the model to create output solutions. Variations in the input parameters create variations in the output. The primary objective of SA is to L. Arriola (B)