Transcription
Sensitivity AnalysisUsing SensIt44.1 SENSIT OVERVIEWSensIt is a sensitivity analysis add-in for Microsoft Excel 2007 & 2010 & 2013 & 2016(Windows) and Microsoft Excel 2011 & 2016 (Macintosh).SensIt performs sensitivity analysis on your worksheet what-if model and creates simple plots,spider charts, and tornado charts. Sensitivity analysis can help you determine which of your inputassumptions are critical.Before using the SensIt options, you must have a spreadsheet model with one or more inputs andan output. With SensIt it is easy to see how sensitive the output is to changes in the inputs.In Windows Excel 2007 & 2010 & 2013 & 2016, SensIt adds two items to the Add-Ins ribbon:SensIt One-Input Plot (Control Shift P) and SensIt Tornado-Spider (Control Shift S).In Mac Excel 2011, SensIt adds the same two items to the Tools menu: SensIt One-Input Plot(Option Command p) and SensIt Tornado-Spider (Option Command s).In Mac Excel 2016, run SensIt using the shortcut keys: SensIt One-Input Plot(Option Command p) and SensIt Tornado-Spider (Option Command s).Use SensIt’s One-Input Plot feature to see how your model’s output depends on changes in asingle input variable. This feature creates an XY Scatter chart type.Use SensIt’s Tornado-Spider feature to see how your model’s output depends on ranges youspecify for each of the model’s input variables. This feature creates tornado charts (an Excel Barchart type) and a spider chart (an XY Scatter chart type). The spider chart is useful for detecting anonlinear relationship between the input variables and the output variable of your model. The twofactor tornado chart can help you determine how your model output is affected by each pair ofyour input assumptions.All of SensIt’s functionality, including its built-in help, is a part of the SensIt XLAM file. There isno separate setup file or help file. When you use SensIt on a Windows computer, it does not createany Windows Registry entries (although Excel may use such entries to keep track of its add-ins).4.2 EXAMPLE PROBLEMThis example is a simple economic model of a prospective new product taken from theEschenbach (1992) article. The model assumes that the FirstCost investment occurs at the start ofthe first year and all subsequent cash flows are end-of-year. The product life is N years with the
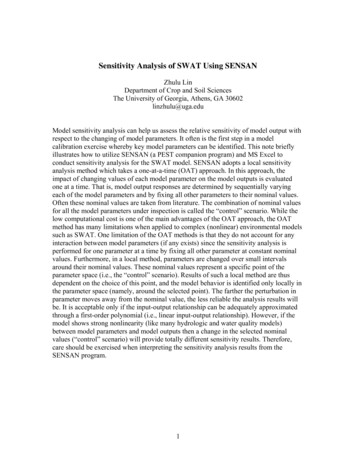
40Chapter 4 Sensitivity Analysis Using SensItSalvage value at the end of year N. At the start of the project there is no revenue for the firstNNoRev years with subsequent annual Revenue during years NNoRev 1 through N. FracComp isthe fraction of Revenue lost to competition. Annual operations and maintenance cost O&Mapplies for all N years of product life. The discount rate i is used to determine PresentWorth.Eschenbach uses the notation P/A,i,N and P/F,i,N, respectively, for the uniform periodic and thesingle payment present worth factors. The spreadsheet model includes some intermediate variablesfor determining various discount factors.Figure 4.1 Model Display123456789101112131415161718ABInput VariablesInput CellsFirstCost 120,000Salvage 20,000N12i10%O&M 6,000Revenue 55,000NNoRev1FracComp0.2Intermediate VariablesP/F,i,N 0.32P/A,i,N 6.81N-NNoRev11P/A,i,N-NNoRev 6.50P/F,i,NNoRev 0.91Revenue Discount 5.90Output VariablePresent Worth 105,293Figure 4.2 Model Formulas101112131415161718AIntermediate ,NNoRevRevenue DiscountOutput VariablePresent WorthB 1/(1 B5) B4 PV(B5,B4,-1) B4-B8 PV(B5,B13,-1) 1/(1 B5) B8 B14*B15 -B2 B3*B11-B6*B12 B7*(1-B9)*B164.3 ONE INPUT, ONE OUTPUTUse SensIt’s One-Input Plot feature to see how your model’s output depends on changes in asingle input variable. In Windows Excel 2007 & 2010 & 2013 & 2016, choose Add-ins SensItOne-Input Plot (Control Shift P). In Mac Excel 2011, choose Tools SensIt One-Input Plot(Option Command p). In Mac Excel 2016, use the shortcut key (Option Command p).
4.3 One Input, One Output41Figure 4.3 SenssIt One Input,, One Output Dialog BoxCellsCfor Inpput VariableInn the Label refeerence edit boxx, type a cell reeference, or poiint to the cell ccontaining a texxt label andcllick. In the Vallue reference eddit box, type a cell reference,, or point to thee cell containinng anuumeric value thhat is an input cell of your moodel.CellsCfor Ouutput VariaableInn the Label refeerence edit boxx, type a cell reeference, or poiint to the cell ccontaining a texxt label andcllick. In the Vallue reference eddit box, type a cell reference,, or point to thee cell containinng afoormula that is the output of yoour model.Innput ValueesTyype numbers inn the Start, Steep, and Stop eddit boxes to speecify values to be used in the inputvaariable’s cell. CellC referencess are not alloweed.Click OK: SensIIt uses the Starrt, Step, and Stoop values to prrepare a table oof values. Eachh value iscoopied to the inpput variable Vaalue cell, the worksheetwis reccalculated, andd the value of thhe outputvaariable Value cellc is copied too the table. (Yoou could do thiis manually in Excel using thhe Edit Fiill Series andd Data Table commands.) SensItSuses the paired input annd output valuues toprrepare an XY (Scatter)(chart. The text in thee label cells yoou identified arre used as the cchart’s axislaabels. (You couuld do this mannually using thee ChartWizardd.)
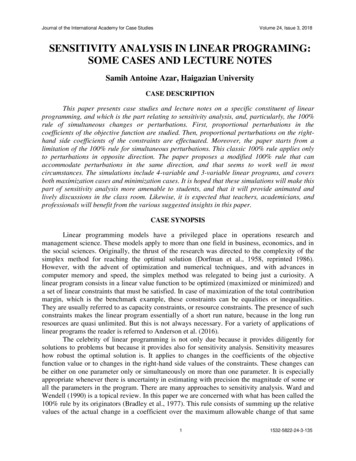
42Chapter 4 Sensitivity Analysis Using SensItFigure 4.4 SensIt Numerical and Chart OutputSensItOne Input, One OutputSensItDate(current date)Time(current time)Workbook(file name)Input CellOneInput! B 4Output Cell OneInput! B 18Present Worth 16,789 35,263 52,057 67,325 81,204 93,822 105,293 115,721 125,201 133,819 141,654 148,776 155,251 161,137 166,488 171,353 175,775 179,796 183,451 180,000 160,000 140,000Present WorthN6789101112131415161718192021222324 200,000 120,000 100,000 80,000 60,000 40,000 20,000 0681012141618202224NInsight From the table and chart, we observe a nonlinear relationship between Present Worth andproduct life N. That is, the change in Present Worth between years 6 and 7 is much greater thanthe change between years 23 and 24.4.4 MANY INPUTS, ONE OUTPUT TORNADOUse SensIt’s Tornado-Spider feature to see how your model’s output depends on ranges youspecify for each of the model’s input variables. Before using this option, arrange your model inputcells in adjacent cells in a single column, arrange corresponding labels in adjacent cells in a singlecolumn, and arrange Low, Base, and High input values for each input variable in three separatecolumns. Alternatively, the three columns containing input values can be worst case, likely case,and best case. An appropriate arrangement is shown below.
4.4 Many Inputts, One Output TTornado43Figure 4.5 Moddel Display with Lower and DEFGHIAe BaseCase OthherExtremepperLimit%Input CellsOneExtremeLowerLimit% UpInput Variables 180,000150% 120,000 108,0000 120,00090%FirstCost 30,000150% 20,000 0 20,0000%Salvage24200%1261250%N20%200%6%%10%10%60%i 4,8000 6,000 7,500125% 6,00080%O&M 33,0000 55,000 68,750125% acCompV(Inpput Values for SensIt)(Eschenbach''s InputsIntermediate VariablesP/F,i,NRelative To Baase Case) 0.32P/A,i,N 6.81N-NNoRev11ev 6.50P/A,i,N-NNoReP/F,i,NNoRev 0.91ount 5.90Revenue DiscoOutput VariabblePresent Worth 105,293pressed the rangges as lower annd upper limit ppercentages off the base case. To useEschenbach expSeensIt, those perrcentages havee been multiplied by the base case so that thhe OneExtremee andOtherExtremeOvaluesvare in thee same measurrement units ass the BaseCase values. For mmoreinnformation aboout choosing inpput values, reffer to the “Tips for Many Inpuuts, One Outpuut” section.Inn Windows Exccel 2007 & 2010 & 2013 & 2016,2choose AAdd-Ins SenssIt Tornado-Spider(CControl Shift S). In Mac Excel 2011, chooose Tools Torrnado-Spider ((Option Commmand s). InMacM Excel 20166, use the shorttcut key (Optioon Command s).Figure 4.6 SenssIt Many Inputss, One Output Dialog BoxRangesRfor Input VariablesTyype a range refference, or poinnt to the range (click and draag) containing ttext labels and the rangecoontaining numeeric values thatt are inputs to yourymodel. Iff the range is noot contiguous, select the
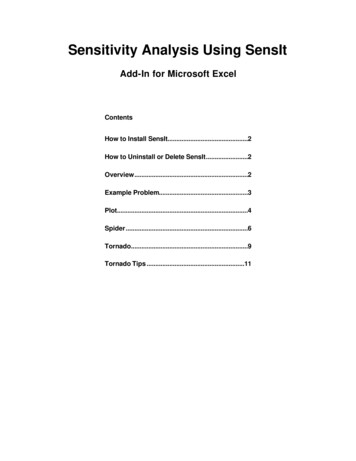
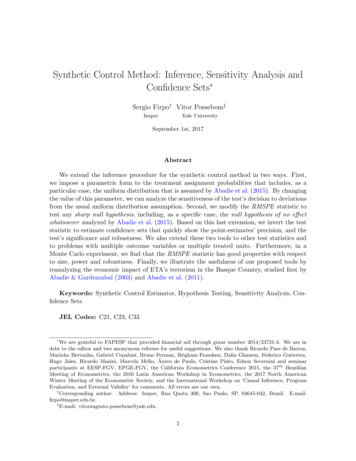
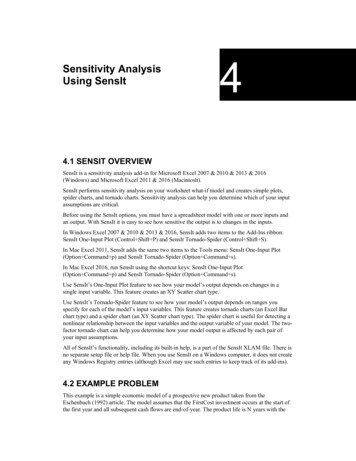
44Chapter 4 Sensitivity Analysis Using SensItfirst portion and then hold down the Control key while making the remaining selections.Alternatively, type a comma between each portion.Cells for Output VariableType a cell reference, or point to the cell containing a text label and the cell containing a formulathat’s the output of your model.Ranges for Input ValuesType a range reference, or point to the range (click and drag) containing numeric values for eachof your model’s inputs. You can make non-contiguous selections similar to the ranges for inputvariables. Be sure that all five range selections have the appropriate cells in the same order.Figure 4.7 SensIt Tornado Numerical and Chart 72829303132333435363738394041ABSensItMany Inputs, One OutputSingle-Factor Sensitivity AnalysisCDDate (current date)Time (current time)Input EFGHIWorkbook (file name)Output Cell ManyInputs! B 18Corresponding Input ValueLow Output Base Case High Output 33,000 55,000 68,7506122420%10%6%0.40.20310 180,000 120,000 108,000 7,500 6,000 4,800 0 20,000 30,000Present WorthOutput ValueLowBaseHigh 1,372 105,293 170,244 16,789 105,293 183,451 14,267 105,293 167,016 40,342 105,293 170,244 35,871 105,293 145,293 45,293 105,293 117,293 95,072 105,293 113,469 98,920 105,293 108,479PercentSwing Swing 2 168,872 25.0% 166,661 24.3% 152,749 20.5% 129,901 14.8% 109,421 10.5% 72,0004.5% 18,3970.3% 9,5590.1%SensItRevenue 68,750 33,000Ni2466%20%FracComp00.4NNoRev3FirstCost 180,000O&M0 108,000 7,500Salvage‐ 40,000 0 0 40,000 80,000 4,800 30,000 120,000 160,000 200,000Present WorthFor each input variable, SensIt sets all other input values at their Base case values, copies the OneExtreme input value to the input variable cell, recalculates the worksheet, and copies the value of
4.5 Customizing SensIt Charts45the output variable cell to the table. The same steps are repeated using each Other Extreme inputvalue. For each input variable, SensIt computes the range of the output variable values (the swing),sorts the table from largest swing down to smallest swing, and prepares a bar chart.For each Low output value in column E, the corresponding input value is shown in column B. Foreach High output value in column G, the corresponding input value is shown in column D. Thetornado chart shows single-factor sensitivity analysis, i.e., for each output value, only one inputvalue is changed from its base case value. The tornado chart summarizes eight separate singlefactor sensitivity analyses.Insight The uncertainty about annual Revenue (the topmost bar in the tornado chart) is associatedwith the widest swing in Present Worth. O&M and Salvage have little effect on Present Worth.4.5 CUSTOMIZING SENSIT CHARTSIf the labels on the horizontal axis are numbers with many digits, some of the labels may wraparound so that some of the digits display below the others. There are many ways to remedy thisanomaly.(1) One way is to widen the chart. Click just inside the outer border of the chart so that eight charthandles are shown and then drag the middle chart handle on the left or right to widen the chart.(2) Another way is to select the horizontal axis (click between the labels on the horizontal axis sothat "Value (X) axis" appears in the name box in the upper left of Excel) and change to a smallerfont size using the Font Size drop-down edit box on the Formatting tool bar. Select the axis, andchange the font size in the Font area of the Home ribbon.(3) Yet another way is to select the horizontal axis, select the Chart Tools Layout or Formatribbon, click Format Selection in the Current Selection area of the ribbon, click Axis Options inthe Format Axis dialog box, and change the Minimum, Maximum, and Major unit.(4) Finally, you can obtain more spacing on the horizontal axis by using a custom format. If youwant to show values in thousands instead of the original units, select the axis, select the ChartTools Layout or Format ribbon, click Format Selection in the Current Selection area of the ribbon,click Number in the Format Axis dialog box, enter a comma at the end of the current formatshown in the Format Code edit box, and click the Add button. For example, you might change theformat from " #,##0" to " #,##0," and then modify the horizontal axis title to indicate that the axisvalues are in thousands.4.6 TORNADO SORTED BY DOWNSIDE RISKThe tornado chart is originally sorted by Swing. To sort by downside risk, select the single row oflabels and all data rows, on the Home ribbon in the Editing area choose Sort & Filter CustomSort, check that "My data has headers" is selected, select Column Sort by “Low,” select Sort OnValues, select Order Smallest to Largest, and click OK. If necessary, press F9 to refresh the chart.The results are shown below.
46Chapter 4 Sensitivity Analysis Using SensItFigure 4.8 SensIt Tornado Sorted by Downside 132333435363738394041BInput CDECorresponding Input ValueLow Output Base Case High Output 33,000 55,000 68,75020%10%6%612243100.40.20 180,000 120,000 108,000 7,500 6,000 4,800 0 20,000 30,000FGPresent WorthOutput ValueLowBaseHigh 1,372 105,293 170,244 14,267 105,293 167,016 16,789 105,293 183,451 35,871 105,293 145,293 40,342 105,293 170,244 45,293 105,293 117,293 95,072 105,293 113,469 98,920 105,293 108,479HIPercentSwing Swing 2 168,872 25.0% 152,749 20.5% 166,661 24.3% 109,421 10.5% 129,901 14.8% 72,0004.5% 18,3970.3% 9,5590.1%SensItRevenue 33,000i 68,75020%N6%6NNoRev243FracComp00.4FirstCost0 180,000O&M 108,000 7,500Salvage‐ 40,000 0 0 40,000 80,000 4,800 30,000 120,000 160,000 200,000Present Worth4.7 TORNADO SORTED BY UPSIDE POTENTIALTo sort by upside potential, select the single row of labels and all data rows, on the Home ribbonin the Editing area choose Sort & Filter Custom Sort, check that "My data has headers" isselected, select Column Sort by “High,” select Sort On Values, select Order Largest to Smallest,and click OK. If necessary, press F9 (Windows) or Command (Mac) to refresh the chart.The results are shown below.
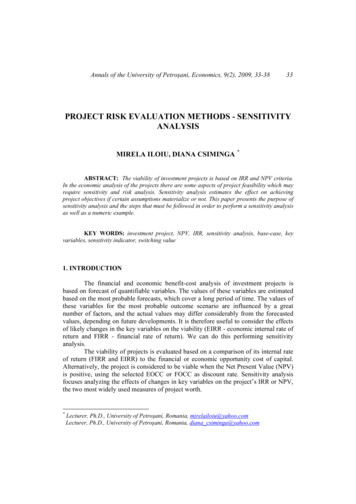
4.8 Tornado Showing Major Uncertainties47Figure 4.9 SensIt Tornado Sorted by Upside 29303132333435363738394041BInput CDECorresponding Input ValueLow Output Base Case High Output61224 33,000 55,000 68,7500.40.2020%10%6%310 180,000 120,000 108,000 7,500 6,000 4,800 0 20,000 30,000FGPresent WorthOutput ValueLowBaseHigh 16,789 105,293 183,451 1,372 105,293 170,244 40,342 105,293 170,244 14,267 105,293 167,016 35,871 105,293 145,293 45,293 105,293 117,293 95,072 105,293 113,469 98,920 105,293 108,479HIPercentSwing Swing 2 166,661 24.3% 168,872 25.0% 129,901 14.8% 152,749 20.5% 109,421 10.5% 72,0004.5% 18,3970.3% 9,5590.1%SensItNRevenue246 68,750 33,000FracComp00.4i6%20%NNoRev3FirstCost 180,000O&M0 108,000 7,500Salvage‐ 40,000 0 0 40,000 80,000 4,800 30,000 120,000 160,000 200,000Present Worth4.8 TORNADO SHOWING MAJOR UNCERTAINTIESIn some situations you may have twenty or more input variables and you wish to show thevariation of only the top five or ten. To illustrate this modification, note that in this example thevariation in Present Worth due to O&M and Salvage is minimal, so consider showing only the topsix input variables, here sorted by swing. Click one of the bars on the left side of the vertical basecase line to select Series 1 (shown at the right end of the SERIES function in the formula bar), andthen click and drag the fill handle from A18 up to A16 and the fill handle from F18 up to F16.Click one of the bars on the right side of the vertical base case line to select Series 2, and thenclick and drag the fill handle from H18 up to H16. To resize the chart, click just inside its outerborder and drag the bottom center fill handle upward. The resulting chart is shown below.
48Chapter 4 Sensitivity Analysis Using SensItFigure 4.10 SensIt Tornado Showing Only Major UncertaintiesSensItRevenue 68,750 33,000Ni2466%20%FracCompNNoRev3FirstCost 180,000‐ 40,00000.4 0 40,0000 108,000 80,000 120,000 160,000 200,000Present Worth4.9 TORNADO WITH VERTICAL LINEA tornado chart shows ranges for a single alternative. To compare with a second alternative, it isuseful to show a vertical line representing the value of the performance measure for the secondalternative. For example, the second alternative might be "Pursue a fixed cost contract," withpresent worth of 30,000.In Windows Excel 2010 & 2013 & 2016, select the chart, on the Insert ribbon in the Illustrationsarea click Shapes, and in the Lines area click the Line icon. On the tornado chart, click at the 30,000 value on the horizontal axis and drag upward to above the top horizontal bar. Beforereleasing the mouse button, position the top end of the line so that it is vertical. The result isshown below.
4.10 Many Inputs, One Output Spider49Figure 4.11 Tornado Chart with Vertical LineSensItRevenue 68,750 33,000Ni2466%20%FracCompNNoRev3FirstCost 180,000O&M0 108,000 7,500Salvage‐ 40,00000.4 0 0 40,000 80,000 4,800 30,000 120,000 160,000 200,000Present WorthTo format the vertical line, select it, and on the Drawing Tools Format ribbon choose ShapeOutline Weight 1 pt.Insight In this example, we note that Revenue, N, and i are critical input assumptions. These arethe three input variables that could result in Present Worth less than the " Pursue a fixed costcontract" alternative. However, three other input assumptions are nearly as critical. We shouldfocus on these six inputs, either by trying to control the value, by gathering more information toreduce the uncertainty (the width of the bars), or by treating the uncertainty explicitly usingprobability assessments and subsequent Monte Carlo simulation. We should not be as concernedabout the O&M and Salvage values.4.10 MANY INPUTS, ONE OUTPUT SPIDERIn addition to the tornado chart, SensIt’s Tornado-Spider feature also creates a spider chart toshow how your model’s output depends on the percentage changes for each of the model’s inputvariables.SensIt Spider uses the same base case and extreme input values as the single-factor sensitivityanalysis for the tornado chart, but you can specify a Step Percent for evaluating the model atintermediate values. The results are shown with each input value expressed as a percentage of thebase case input value. If the base case value for an input variable is zero, that variable is notincluded in the Spider analysis (because it would not be possible to express an extreme orintermediate input value as a percentage of the zero base case value). SensIt prepares an XY(Scatter) chart where the horizontal axis is each input value as a percentage of the base case inputvalue and the vertical axis is the associated model output value.
50Chapter 4 Sensitivity Analysis Using SensItFigure 4.12 SensIt Spider Numerical and Chart OutputInput Corresponding Input ValueLow Output Base Case High Output 33,000 55,000 68,7506122420%10%6%0.40.20310 180,000 120,000 108,000 7,500 6,000 4,800 0 20,000 30,000Input Value as % of BaseLow % Base % High %60.0% 100.0% 125.0%50.0% 100.0% 200.0%200.0% 100.0% 60.0%200.0% 100.0%0.0%300.0% 100.0%0.0%150.0% 100.0% 90.0%125.0% 100.0% 80.0%0.0% 100.0% 150.0%Present WorthOutput ValueLowBaseHigh 1,372 105,293 170,244 16,789 105,293 183,451 14,267 105,293 167,016 40,342 105,293 170,244 35,871 105,293 145,293 45,293 105,293 117,293 95,072 105,293 113,469 98,920 105,293 108,479Swing 168,872 166,661 152,749 129,901 109,421 72,000 18,397 9,559SensIt 220,000 200,000 180,000 160,000 140,000Present WorthRevenue 120,000Ni 100,000FracComp 80,000NNoRevFirstCost 60,000O&M 40,000Salvage 20,000 0‐ .0%350.0%Input Value as % of Base CaseInsight On a spider chart, lines that are nearly horizontal generally indicate an input variablewhere small percentage changes do not have much effect on the output value. Lines that are morevertical indicate an input variable where small percentage changes have a greater effect on theoutput value. Unlike the tornado chart, the spider chart makes it easy to identify nonlinearrelationships.4.11 TWO-FACTOR TORNADO CHARTSensIt can also produce a two-factor tornado chart, where SensIt considers each pair of inputvariables. If N is the number of input variables, there are N*(N-1)/2 pairs to evaluate. For eachpair, SensIt considers all nine combinations of the One Extreme, Base Case, and Other Extremeinput values for the two variables. For the calculation of output for each combination, the otherinput variables are kept at their Base Case values. For each pair, SensIt summarizes thecalculations by showing the combinations of input values that produce the lowest and highestoutput value. Finally, the pairs are sorted by swing, and a tornado chart is created.The example has N 8 input variables, so there are N*(N-1)/2 8*(8-1)/2 28 pairs to evaluate.SensIt’s output shows data rows and chart bars for all 28 pairs. To save space, the figure showsnumerical results for only the top ten (by hiding rows for the other 18 pairs and resizing the chart).
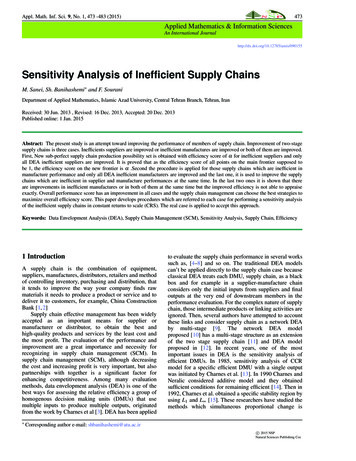
4.12 Two-Factor Downside Risk51Figure 4.13 SensIt Two-Factor Tornado Partial OutputInput VariablesN&iN & Revenuei & RevenueN & FracCompRevenue & FracCompN & NNoRevi & FracCompRevenue & NNoRevi & NNoRevFirstCost & RevenuePresent WorthOutput ValueLowBaseHigh- 23,599 105,293 320,344- 43,863 105,293 272,283- 49,197 105,293 248,861- 21,118 105,293 272,283- 37,598 105,293 251,432- 52,632 105,293 223,451- 25,398 105,293 248,861- 40,281 105,293 220,244- 41,752 105,293 208,525- 58,628 105,293 182,244Corresponding Input ValuesLow OutputBase CaseHigh Output6 & 20%12 & 10%24 & 6%6 & 33,00012 & 55,00024 & 68,75020% & 33,00010% & 55,0006% & 68,7506 & 0.412 & 0.224 & 0 33,000 & 0.4 55,000 & 0.2 68,750 & 06&312 & 124 & 020% & 0.410% & 0.26% & 0 33,000 & 3 55,000 & 1 68,750 & 020% & 310% & 16% & 0 180,000 & 33,000 120,000 & 55,000 108,000 & 68,750Swing 343,943 316,146 298,058 293,401 289,030 276,083 274,259 260,524 250,277 240,872SensItN&iN & Revenuei & Revenue6 & 20% 68,750 & 06&324 & 020% & 0.46% & 0 33,000 & 3i & NNoRev‐ 200,00024 & 0 33,000 & 0.4N & NNoRevFirstCost & Revenue6% & 68,7506 & 0.4i & FracCompRevenue & NNoRev24 & 68,75020% & 33,000N & FracCompRevenue & FracComp24 & 6%6 & 33,000 68,750 & 020% & 36% & 0 180,000 & 33,000‐ 100,000 108,000 & 68,750 0 100,000 200,000 300,000 400,000Present WorthInsight The single-factor analysis produces Present Worth values between 1,372 and 170,244.The two-factor analysis produces Present Worth values between - 58,628 and 320,344. If weused Monte Carlo simulation, we would observe even more variation in the output, equivalent toan eight-factor sensitivity analysis.The single-factor downside-risk tornado chart shows that the lowest Present Worth is for theRevenue input assumption, followed by i, N, NNoRev, FracComp, and FirstCost. The two-factoranalysis shows that the FirstCost and Revenue pair could produce the lowest Present Worth. So itis particularly important to find a way to avoid the high FirstCost and low Revenue combination,even though the single-factor analysis indicates that FirstCost by itself is not so important.4.12 TWO-FACTOR DOWNSIDE RISKIn the following chart the two-factor results are sorted by the "Low" output value to showdownside risk. Instead of showing all 28 results, the figure shows only the top twelve (by hidingrows for the other 16 pairs of inputs and resizing the chart).The results are shown below.
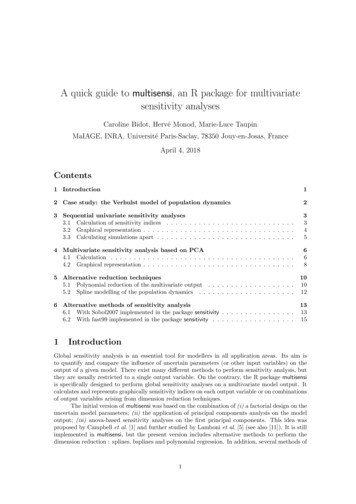
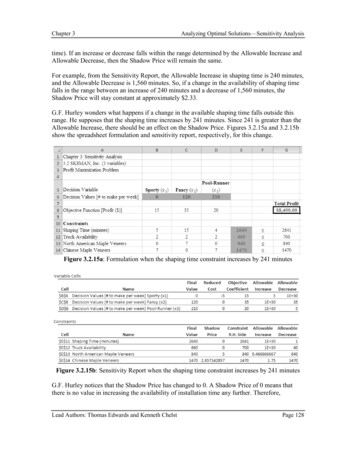
52Chapter 4 Sensitivity Analysis Using SensItFigure 4.14 SensIt Two-Factor Tornado Sorted by Downside RiskSensItFirstCost & RevenueN & NNoRev6&3i & Revenue20% & 33,000FirstCost & i 180,000 & 20%N & Revenue6 & 33,000FirstCost & N 180,000 & 6i & NNoRev20% & 3Revenue & NNoRev 33,000 & 3Revenue & FracComp 33,000 & 0.4i & FracComp20% & 0.4FirstCost & NNoRev 180,000 & 3N&i6 & 20%‐ 200,000 108,000 & 68,750 180,000 & 33,000‐ 100,00024 & 06% & 68,750 108,000 & 6%24 & 68,750 108,000 & 246% & 0 68,750 & 0 68,750 & 06% & 0 108,000 & 024 & 6% 0 100,000 200,000 300,000 400,000Present WorthInsight From the one-factor analyses, we note that the inputs associated with maximum swing areRevenue, N, and i, in that order. When sorted by downside risk, the ordered inputs are Revenue, i,and N. Although those three inputs are included in the top ten pairs of the two-factor analysisshown above, the top two pairs indicate that FirstCost is an important input when combined withRevenue, and NNoRev is an important input when combined with N.4.13 COMPARISON WITH OVERALL VARIATIONUsing swing as the criterion for measuring variation of the output value, the single most importantinput variable is Revenue with output variation from 1,372 to 170,244, a swing of 168,872.With two-factor sensitivity analysis, the two most important input variables are N and i withoutput variation from - 23,599 to 320,344, a swing of 343,943.When all input assumptions are varied (computations are not shown here), the output variesfrom - 180,805 to 702,005, a swing of 882,810. The figure shows the output variation for thesethree situations. For example, if you use triangular density functions for each input variable andperform Monte Carlo simulation with a very large number of trials, the results will show similarvariation.
4.14 Tips for Many Inputs, One Output53Figure 4.15 Comparison of Variation of Output ValuesComparison of Variation of Output ValuesEight-FactorTw o-FactorOne-Factor- 200,000 0 200,000 400,000 600,000 800,000Present Worth4.14 TIPS FOR MANY INPUTS, ONE OUTPUTWhen defining the high and low cases for each variable, it is important to be consistent so that the"high" cases are all equally high and the "low" cases are all equally low. This will ensure that theoutput results can be meaningfully compared.For example, if you are thinking about uncertainty using probability and very extreme values arepossible but with low probability of occurrence, you might take all of the base case values to beestimates of the mean of the input variable, take low cases to be values such there is a 1-in-10chance of the variable being below this amount, and take the high cases to be values such thatthere is a 1-in-10 chance of the variable being above this amount. Or, you might use the 5th and95th percentiles for each of the input variables.Alternatively, in some situations the values for each input variable may have lower and upperbounds, so you may specify low and high values that are the absolute lowest and highest possiblevalues.When you click OK, SensIt sets all of the input variables to their base-case values and records theoutput value. Then SensIt goes through each of the input variables one at a time, plugs the lowcase value into the input cell, and records the value in the output cell. It then repeats the processfor the high case. For each substitution, all input values are kept at their base-case values exceptfor the single input value that is set at its low or high value. SensIt then produces a spreadsheetthat lists the numerical results as shown in columns E, F, and G of the worksheet with the tornadochart.In the worksheet, the variables are sorted by their "swing" -- the absolute value of the differencebetween the output values in the low and high cases. "Swing" serves as a rough measure of theimpact of each input variable. The rows of numerical output are sorted from highest swing at thetop down to lowest swing at the bottom. Then SensIt creates a bar chart of the sorted data.In general, you should focus your modeling efforts on those variables with the greatest impact onthe value measure.If your model has input variables that are discrete or categorical, you should create multipletornado charts using different base case values of that input variable. For example, if your modelhas an input variable "Government Regulation" that has possible values 0 (zero) or 1, the low andhigh values will be 0 and 1, but you should run one tornado chart with base case 0 and anothertornado chart with base case 1.
54Chapter 4 Sensitivity Analysis Using SensIt4.15 INTERPRETATION OF PERCENT SWING 2A tornado chart displays the results of single-factor sensitivity analysis for an alternative. For arisk averse decision maker, the certain equivalent of an alternative is less than the expected value(i.e., probability-weighted average) of the payoff distribution. Each Percent Swing 2 valueindicates how the difference between the expected value and the certain equivalent is affected bythe uncertainty of a specific input variable. These approximations are based on the followingassumptions:1.Exponential Utility. The decision maker's attitude toward risk is described by anexponential utility function, with a Risk Tolerance parameter indicating the degree of riskaversion. In this case the certain equivalent of a payoff distribution can be approximatedbyCertain Equivalent Expected Value – Variance/(2*Risk Tolerance)The variance of each input variable contributes to the variance of the payoff distribution,which determines how much the certain equivalent is less than the expected value.2.Independence. The input variables should be probabilistically independent, in which casethe variance of the payoff distribution is the sum of the variances of the input variables(for small variations and perhaps a weighted sum, depending on the payoff model). Th
Sensitivity Analysis Using SensIt 4 4.1 SENSIT OVERVIEW SensIt is a sensitivity analysis add-in for Microsoft Excel 2007 & 2010 & 2013 & 2016 (Windows) and Microsoft Excel 2011 & 2016 (Macintosh). SensIt performs sensitivity analysis on your worksheet what-if model and creates simple plots, spider charts, and tornado charts.