Transcription
Visualizing uncertainty in spatio-temporal dataAyush ShresthaYing ZhuBen MillerDepartment of ComputerScienceGeorgia State UniversityAtlanta, GADepartment of ComputerScienceGeorgia State UniversityAtlanta, GADepartment of CommunicationGeorgia State UniversityAtlanta, GAashrestha2@cs.gsu.eduyzhu@cs.gsu.eduABSTRACTTo address these issues, we developed a new version of Storygraph visualize uncertainty. In our revision, we begin bycategorizing uncertainty into two categories: (1) event uncertainty and (2) between-event uncertainty. We designedour method to distinguish and visualize these two types ofuncertainty. Event uncertainty is the spatio-temporal uncertainty about the event itself, including events with poorlyspecified spatial and/or temporal attributes. Between-eventuncertainty is the uncertainty between two precisely recordedevents, which we call them key events. This concept is inpart influenced by Hagerstrand’s Time Geography [3][4][5].After specifying the key events, the between-event uncertainties are visualized as space-time prisms between the keyevents. Through this process, our visualization techniquecan be used to study the interactions between people (orcharacters) in both space and time.The rest of the paper is organized as follows: Section 2discusses related work in spatio-temporal and uncertaintyvisualization. Section 3 presents the mathematical model ofStorygraph. Section 4, describes the classification of uncertainty. Section 5 discusses how uncertain events are visualized in Storygraph. Section 6 discusses how between-eventuncertainty is visualized. Section 7 presents a case studyfeaturing fire fighter interviews from WTC corpus. Section8 concludes by summarizing our work and discussing futureworks.Analyzing the relationship between location and time in aspatio-temporal data is not trivial. It is even more challenging if the data contains uncertainty. In this paper, wepresent a new method that visualizes spatio-temporal datawith uncertainty. This method is an extension of our 2D visualization technique called Storygraph, and it handles twotypes of data uncertainty: (1) the spatial and temporal uncertainty about an event; (2) the spatial and temporal uncertainty between two events. We applied this method toa case study that involves data extracted from witness testimonies and field reports containing uncertainties inherentto natural language.Categories and Subject DescriptorsH.5.2 [Information Interfaces and Presentation]: u.eduINTRODUCTIONThe introduction of geo-location sensors in mobile devicesand other commodity hardware has greatly aided in spatiotemporal data collection. As a result, novel and effectivemethods are needed to help analyze these great amounts ofspatio-temporal data. Traditional methods like maps fail toshow the temporal sequence of the events. An event in thispaper refers to a row in the dataset having distinct time andlocation. If two events occur at the same location at differenttimes, the markers will overlap, resulting in a single marker.Time series charts are helpful for presenting temporal information but difficult for analyzing spatial information. Othermethods such as small multiples, animations, and 3D mapshave significant drawbacks.In our previous work, we introduced a technique calledStorygraph [1] to address these issues. Storygraph is a 2Dtechnique that visualizes both spatial and temporal components in an integrated graph. Our case studies demonstrated the benefits of this method on datasets containingprecise geolocations and time such as military war logs [1]and software commit histories [2]. However, when applyingour method to spatio-temporal data extracted from witnesstestimonies and field reports, we encountered problems ofuncertainty in space and time. For example, our study of511 interviews with first responders during the attack onWorld Trade Center (WTC) on September 11, 2001 showedthat the narratives of these interviewees, who were trainedto report incidences, still contained a fair amount of uncertainty in their descriptions of locations and times.2. RELATED WORKMaps and time series charts are the most common visualization techniques to present spatial and temporal data sets.Other techniques include [6] [7] [8] [9] [10] [11] [12] [13] [14][15] [16] [17] [18] [19]. These techniques, however, do notdeal with uncertainties in spatial or temporal dimensionseven though data collected from real world often containsvarious levels of uncertainty because of unreliable memory,unreliable source, or the inherent ambiguity of natural language.Much work has been done in visualizing uncertainty [20].Here, we focus on closely related work in spatial temporaldata visualization. The most common method is to overlay uncertainty information on top of a map. For example, Love et al. [21] used color coding, displacement mapping, and bar glyph on a 3D map to visualize uncertainty.Some authors also used color to visualize probabilities on a2D map [22][23]. Zuk et al. [24] used transparency, wireframe, or location shift to present uncertainties on 3D models. Some scientific visualization methods deal with locationuncertainty by plotting multiple versions of the simulationsShrestha, Ayush, Ying Zhu, and Ben Miller. "Visualizing uncertainty in spatio-temporal data." In Proceedings of the ACM SIGKDDWorkshop on Interactive Data Exploration and Analytics, pp. 117-126. ACM, 2014.117
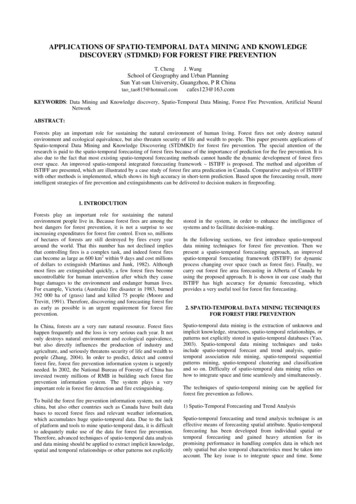
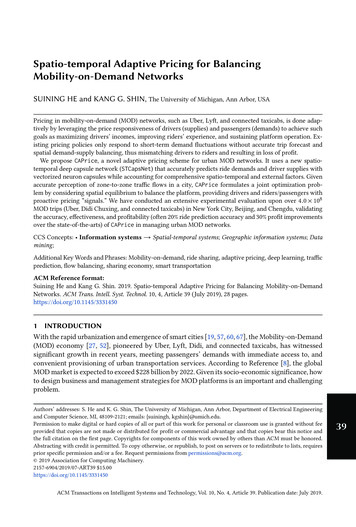
or observations, which creates a spaghetti-like drawing ofdata points. Other methods use contour lines or sound toindicate uncertainty. However, most of the previous worksare about visualizing uncertainty data associated with location and time rather than uncertainty in location and timethemselves. For example, color coding, displacement mapping, and bar glyph on a map cannot show the area of possible (but uncertain) locations. Wire frame and transparencyindicate the existence of uncertainty but not the possiblerange of uncertain locations or times. Pebesma et al. [23]used animation to show variability in time; but, with animation, users only see one image at a time, and it’s difficultto conduct data analysis on a timeline [25][26]. Most importantly, previous methods have shown difficulty integratingspatial and temporal uncertainty in one view.The main difference between our method and previousworks is that, in our method, uncertainty information is notdisplayed on a map but on the more abstract Storygraph.The benefit is that it can visualize both spatial and temporal uncertainty in a single 2D view. Our method canclearly differentiate between uncertainty in location (spatial uncertainty), time (temporal uncertainty) as well as acombination of the two (spatio-temporal uncertainty). Inother methods, such differences are not clearly distinguishable. Our method also visualizes between-event uncertainty,which is mostly ignored by other methods. Our betweenevent uncertainty visualization is influenced in part by Hagerstrand’s Time Geography [3][4][5], a 3D map based visualization.3.A(33.74, -84.35)July 4, Dec 24B(33.79, -84.39)July 4, July 28C(33.82, -84.38)July 4, July 15, Aug 9JunJulAugSepOctNovDecFigure 1: Example of Storygraph constructed fromhypothetical accidents. Top: Outline map showingthe major highways in Atlanta and hypothetical accident taking place at the junctions A, B, and C onthe dates shown. Bottom: Same information plotted on Storygraph (not drawn to scale for illustrative purposes). Each location is represented as aline joining the latitude and longitude in the vertical axes. An event occurring at that location isrepresented by a point on the line. This representation allows users to see the temporal context ofthe events together with spatial context (i.e. whendid most accidents take place? July-August in thefigure above.)STORYGRAPHStorygraph is a visualization technique that presents anintegrated 2D view for spatio-temporal data [1]. It is a threeaxis coordinate system with two parallel vertical axes forlatitude and longitude and an orthogonal horizontal axis fortime. Figure 1 illustrates the basic ideas of Storygraph.The top sub-figure in Figure 1 shows 6 accidents markedon a map. Two accidents have been reported at each location at different times of the year. However, as shown in thisfigure, plotting these data points on a map results in overlapping markers. For the remaining non-overlapping markers, maps fail to show the temporal distance between theseevents. The sub-figure at the bottom shows the same eventspresented in Storygraph. Here, events are plotted on thelocation lines with no overlapping. In addition, Storygraphpresents the temporal distance between the events. Figure 2shows a Storygraph generated from the World Trade Center (WTC) corpus generated by our program. Few patternsthat can be observed in this Storygraph are: (1) The pointsare clustered around location (40.70, 74.00), (2) At timest1 - t4 and later on around 15 : 12, there are events simultaneously taking place at many different locations.Interpreting spatial information on Storygraph is not asintuitive as that on a map; however, analyzing temporal information on Storygraph is quite intuitive. The followinganalysis discusses the process of interpreting the spatial information on Storygraph.Based on [1], let αmax and αmin be the maximum andminimum latitude, and βmax and βmin be the maximumand minimum longitude. Likewise, let Tmax and Tmin bethe maximum and the minimum timestamps.The mapping function f (α, β, t) (xstorygrah, ystorygraph)of event E(lα , lβ , t) is given by:ystorygraph (β α)(x Tmin ) αTmax Tminxstorygraph t(1)(2)Assuming Tmin 0 and Tmax T without loss of generality, Equation 1 simplifies to(β α)x α(3)TEquation 3 is also the equation of the location line (Equation 1 rewritten in slope-intercept form).In earlier sections, we discussed that a point on the Storygraph in the absence of location line can be mapped torange of locations in geographical space. Thus, the functionf ceases to be one-to-one.y Lemma 3.1. A point on a location line in Storygraph at118
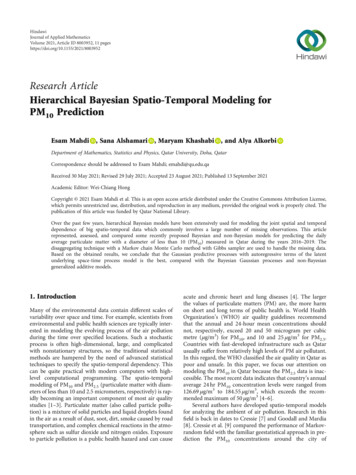
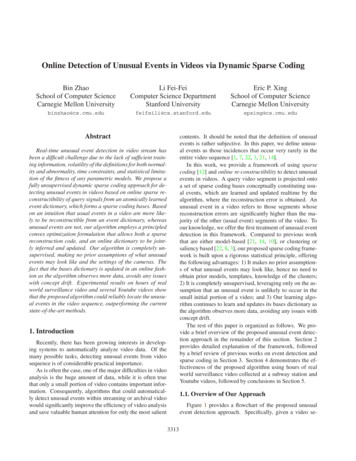
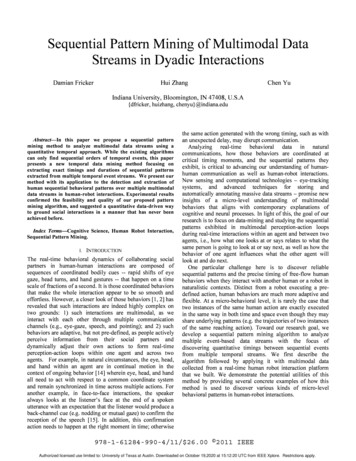
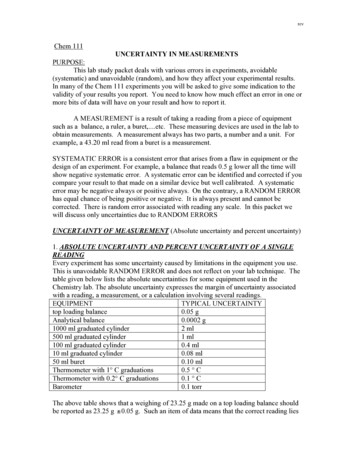
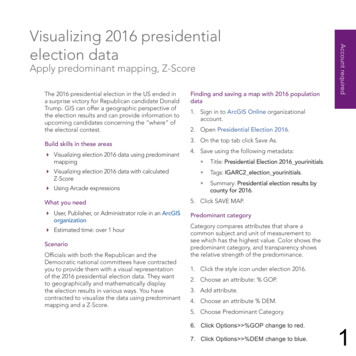
Figure 2: Left: Storygraph showing approximately 7000 events within 12 hours during 9/11 attack on WTC.Annotations t1 t4 mark the key events: t1(8 : 46), first plane crashes into the North Tower; t2(9 : 03), secondplane crashes into South Tower; t3(9 : 59), South Tower collapses; t4(10 : 28), North Tower collapses. At eachof these times, events occurred simultaneously at multiple locations (marked by vertically aligned events). Inaddition, it can also be observed that the events clustered around the location (40.70, 74.00). Right: Sameset of events plotted on the map. Maps supplement Storygraphs as identifying locations on maps is relativelymore intuitive.time t corresponds to a precise point (geo-coordinate) on amap.β (1 αmax αminαmin ymaxβmax βmin βmin ymax(4)β ylng(5)Lemma 3.4. Without location lines, a vertical line segment at t on the Storygraph corresponds to a projected area,AStorygraph Aactual in geographical space at t.Lemma 3.2. Without location lines, a point on a Storygraph at time t corresponds to a line segment on a map.Proof. If the area on the plane is bounded by right rectangle, since α : α1 α α2 and β : β1 β β2,AStorygraph Aactual. For any other shape, the vertical linesegment in the Storygraph represents a rectangular bounding box (from 3.3). Thus, α : α AStorygraph Aactual.Hence, AStorygraph AactualProof. We can rewrite equation (3) asTyT)α (6)xxThus, a fixed point (x, y) on the Storygraph corresponds tomany points (α, β) on the Cartesian map at time t x:those αmin α αmax and βmin β βmax satisfying(6). Plotting these values of (α, β) results in a line segmentwith non-positive slope since x T as illustrated in Figure 3.β (1 Corollary 3.5. Real-world area at time t maps to a vertical line segment in storygraph at time t.Proof. Inverse of Lemma 3.4, when the exact coordinates of all the four corners are knownwe can state that an area Aactual in the geographical spacegets mapped to a line segment in the Storygraph orthogonalto the time axis. The area formed by this line segment lbounded by coordinates (α1 , β1 , t) and (α2 , β2 , t) is given byAStorygraph (α2 α1 )2 (β2 β1 )2 . Thus, AStorygraph Aactual.Lemma 3.3. Without location lines, a vertical line segment at time t on a Storygraph corresponds to an area on amap.Proof. Consider a vertical line segment, with end coordinates (x, y1 ) and (x, y2 ), y1 y2 . Using 3.2, these extremesof the line segment in (6) we get two straight line equationsTy1 Tβ (1 )α xx(8)Hence the vertical line segment between (x, y1 ) and (x, y2 )on the Storygraph corresponds to an area between two parallel lines (7) to (8) in the geographical space. As in Lemma 3.2,this area is also bounded by the maximum and minimum values of α and β – this results in a polygon as illustrated inFigure 4.Proof. Setting T 0 and T t Equation 3, we getthe ylat and ylng of the Storygraph. Thus, geo-coordinates(α, β) can be obtained asα ylat Ty2 T)α xxLemma 3.6. Storygraph preserves spatial proximity for location lines but does not preserve spatio-temporal proximityfor events.(7)119
min!min"1"min!min!max"minTimeAt time t"maxAt time tLatitudeLongitude!1Latitude!2!maxFigure 3: Top: A point in the Storygraph at time tand the corresponding location lines the point canbelong to shaded. Bottom: The line segment generated in the Cartesian coordinate by mapping thepoint.Figure 4: Top: A vertical line in Storygraph at timet and the corresponding location lines the line segment can belong to shaded. Bottom: The boundedregion generated in the geographical space by mapping the line segment.Proof. Two events close to each other in Storygraphmay not be close to each other in geographical space. Consider two locations (α1 , β1 ) and (α2 , β2 ) in geographical spacewhere α1 α2 . Since both of the axes are ordered in Storygraph, α1 α2 holds true as well.station in the all day,” the phrase “all day” without anymodifier can refer to a wide range of time introducinguncertainty.4. Spatio-temporal uncertainty. This category includesevents that have uncertainty in both time and location. For example, in “It was in the afternoon, I washeading south.” The words ‘afternoon’ and ‘south’ areuncertain.CLASSIFICATION OF UNCERTAINTYDifferent classifications of uncertainty have been proposed[27][28]; however, most of these classifications are about uncertainties introduced in scientific experiments or probabilistic models. In our case, uncertainties are introduced in narratives. Thus, we classify this kind of uncertainty into threecategories:Uncertainty about time and/or location of the event. Thistype of uncertainty is characterized by the presence of phrasesdenoting uncertainty before temporal or spatial description.An example is “I got there maybe around 11 am.” Thephrase ‘maybe around’ adds uncertainty to ‘11 am’ in thisexample. Such uncertainties may also arise from ambiguityin language. For example, in “I was in Brooklyn when theplane hit the building,” the word ‘Brooklyn’ does not givea precise location. We call these types of uncertainties asevent uncertainty which can be further divided into threesub-categories:Uncertainty between two events. In “It was 8 in the morning I was at home. As soon as I heard about it, I reachedthe site at 10.”, the first event (“at home”) and the secondevent (“reached the site”) are both certain. However, whathappened between the two events is unknown. We call thistype of uncertainty between-even uncertaintyUncertainty about the even taking place. In the WTC corpus, we often encounter sentences like “I think Chief pulledme back”. The word ‘think’ indicates an uncertainty aboutwhether the event has ever happened. Detecting this type ofuncertainty is difficult and beyond the scope of this paper.Instead, we focus only on visualizing event uncertainty andbetween-event uncertainty.5. EVENT UNCERTAINTY Spatial uncertainty. This category includes events thathave precise time stamps but uncertain location.In this section, we discuss the extraction and visualization of event uncertainty. To extract event uncertainty, wecompiled a list of English words that may indicate locationuncertainty, such as “around,” “near,” “close to,” “maybe,”“perhaps,” etc. We then gave each word an uncertainty Temporal uncertainty. In addition to uncertain phrases(e.g. maybe, about), temporal uncertainty may comefrom the language itself. For example, in “I was at the120
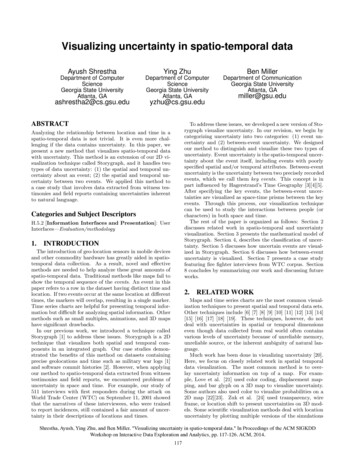
elng dlng dlnglat dlnglng-dlatlnglat dlatlng-dlatlat-dlat-dTimetTimeT-t TT tTimeT-t TT tFigure 5: Three kinds of glyphs used to represent spatial, temporal and spatio-temporal uncertainty. Left:Dashed I-beam is used to represent spatial uncertainty. The slope of the top and bottom of the beamdisambiguates the range of locations in the geographical space. Middle: parallel lines are used to denote thetemporal uncertainty. Right: Box showing spatio-temporal uncertainty. The slope of the edges of the boxmaps to a fixed geographical area within a certain time.score in the range of 1 100 [29][30][31]. The same process was repeated for temporal information. We extractedthe named entities from WTC corpus using Stanford NER[32] and time using SuTime [33]. TARSQI [34] was used toextract the temporal sequence of the events, and locationswere geocoded using Google Maps API. The results werethen verified and corrected.In the WTC corpus, we observed all three types of eventuncertainties: spatial, temporal, and spatio-temporal. Somekey events with precise spatio-temporal information wereused as anchor events. These include the first and secondplane hitting the tower, and the plane crashing into the pentagon. These events were chosen as key events because allof the interviews described more local events in reference tothese global events. Examples include “When the secondplane hit the tower, I was running towards Vesey,” and “Iwas at the station when the news about the first explosionwas on TV.” When considering these key events in the context of the first example, the time is certain but the locationis uncertain. Additionally, in a sentence that references nokey events like “When the EMS arrived at the scene, I beganheading south”, both location and time would be considereduncertain.For each event, latitude, longitude, date/time, color, spatial uncertainty, and temporal uncertainty were fed to thevisualization program, which then visualized the uncertaintyinformation along with other information.Spatial Uncertainty. Spatial uncertainty is visualized as avertical dashed I-beam. From Corollary 3.5, we know thatan area on a map corresponds to a line in Storygraph. Thelength of the I-beam is proportional to the area of possiblelocations. More importantly, the top and the bottom of thebeam disambiguate the range of locations in geographicalspace. This is shown by the left sub-figure in Figure 5.Temporal Uncertainty. We use sloped double lines to represent temporal uncertainty. Each double line is drawn alongthe location line for the corresponding event, which can beseen in the middle sub-figure in Figure 5. A double lineindicates that the event happens at a particular locationwithin a certain time frame. In contrast, a single solid linealong the location line means that the character stayed atthe specified location for a period of time. Through theserepresentations, the two cases are visually distinct.Spatio-temporal Uncertainty. We use a semi-transparentbox to visualize spatio-temporal uncertainty, which meansboth location and time are uncertain. The sloped top andbottom sides of the box indicate the range of locations whilethe vertical sides of the boxes shows the temporal bound.The box is drawn as semi-transparent to prevent glyph occlusion. This is shown by the right sub-figure in Figure 5.Figure 6 shows this concept applied to the events extracted from WTC corpus.6. BETWEEN-EVENT UNCERTAINTYThe purpose of visualizing between-event uncertainty is todisplay the space-time constraints between two key events.Any activity takes place within a certain span of time anda certain geographical region. Individuals participating inthese activities have to trade time for space or vice versa.For example, during a workday lunch hour a person couldwalk to a nearby restaurant for a longer meal or drive todistant restaurant for a shorter meal. Visualizing betweenevent uncertainty can assist planning, scheduling, analyzingpossible overlapping in people’s activities.Our between-event visualization technique is partially basedon Hagerstrand’s Time Geography, a conceptual frameworkwhich focuses on constraints and trade-offs in the allocationof time among activities in space [5]. However, Time Geography is a map based 3D visualization. Therefore it suffersfrom the typical problems associated with 3D visualizations,such as 3D occlusion and difficulty of navigation. Besides,space and time are not well integrated in Time Geography.Our work is an attempt to address these issues.6.1 Space-time paths and space-time prismsWe adapted two important concepts from Time Geography: space-time paths and space-time prisms. Space-timepath traces the movement of a character in space and time.Figure 7 shows an example of a space time path adaptedfrom [5]. The base plane is the geographical space and theorthogonal axis is time. In this example, an individual travels from location 1 to 2, spends some time at 2 and thenmoves on to 3. The time and location of the starting or endpoint are known as control points or key events. The straightline segments connecting two control points are known aspath segments. Path segments are represented by straightline segments for simplicity [35][36]. In our earlier work, we121
Figure 6: Storylines of four firefighters before the second tower collapsed along with event uncertainty. Thedashed vertical I-beam shows the spatial uncertainty. The slope of the top and bottom portion of the beamshows the possible range of locations. The parallel lines show temporal uncertainty. The boxes representspatio-temporal uncertainty and the circles show certain events.destination, d, at td , the time budget is T td to . Thepath space from the origin under the time budget is shownby the red inverted dotted cone. This space shows all thepossible paths and all the possible locations that can bereached within the time budget with maximum velocity v.Let this region be denoted by Ro (T ). Similarly, the bluedotted cone shows the path space towards d under the timebudget. This 3D space gives all the locations from whered can be reached under time T . Let this region be Rd (T ).The intersection of these cones give the potential path spacefor individual traveling from o to d [37]. Hence,Rod (T ) Ro (T ) Rd (T )Figure 7: An example of space time path adaptedfrom [5]. Space time paths trace the movementof an individual moving from one location to another. Space-time paths also show the amount oftime spent at a location by the individual beforemoving to the next location.(9)The projection of the space time prism on the geographicalspace, as shown by a gray circle in the figure, shows all thepossible locations that the user can reach. This area is calledthe potential path area.Given all the control points within a specific time window,τ , the construction of space-time prism requires the destination d to lie within the Ro (T ) and vice versa. Stating itformally,adapted the concept of space-time paths in Storygraph using storylines[1]. Here, Storylines become space-time paths,connecting two consecutive key events via dotted line segment.Space-time prisms extend space time paths to create a 3Dspace consisting of all the possible routes an individual cantake while moving from one point to another. This space isknown as the potential path space. The prism between t1 andt2 in Figure 8 demonstrates this concept. The slope of theedges of this prism is determined by the inverse of maximumvelocity. That is, the possible paths are constrained by themaximum velocity of the individual, a fixed time frame, andfixed destinations. In our implementation, the maximumvelocity is set by the user.If an individual is at origin, o, at to and needs to reach o, d φτ : (o Rd (T ) ) (d Ro (T ) )(10)In Time Geography, space-time paths and space-time prismsare generally drawn inside a 3D space-time cube [38] (Figure 8). In our work, space-time paths and space-time prismsare drawn on Storygraph in a 2D view.6.2 Visualizing between-event uncertaintyStorygraph draws space-time prisms based on Equations 9and 10. From Corollary 3.5, we know that an area in thegeographical space is mapped to a line in Storygraph. Thusstarting from a location, o(α, β), at t0 and taking a snapshots of the potential path area at each time step we get aset of areas sequentially increasing at the rate of the velocity.122
TimeLongitudet2Timedt1Tt2"1/vt3t4t5PotentialPath SpaceLatitude!t1LatitudeLongitudeoPotentialPath Area!Geographical spaceFigure 8: Space-time prism. In this figure, the individual is at location o at t1 needs to be at the samelocation d at t2 (o origin of travel ). (S)he has thetime budget of T . The red dotted cone shows thepossible path space starting from o with the maximum velocity, v. Similarly the blue dotted coneshows the path space towards d. The intersection ofthese two cones gives the potential path space underthe given time budget T . The potential path area isshown by the gray area on the geographic space.t0t1t2t3t4t5TimeFigure 9: Above: Starting from the origin of travel,α, β, at t0, the potential path areas in each time stept1 t5 (assuming a certain velocity and regular timeintervals). Below: The same data plotted in Storygraph. Each potential path area is mapped to a linesegments in Storygraph. For continuous time, thiswould result in an area enveloped by two gray lines.The slope of the gray lines is equal to the maximumvelocity.The top sub-figure in Figure 9 shows an individual at point(α, β) at t0 and his/her possible path area after each timestep t1 t5. The figure simplifies the drawing of the potential path areas by representing them with squares ratherthan circles. The bounding of the actual potential path bysquares introduces some uncertainty itself [20] but greatlysimplifies the drawing and the calculations.Hence, if the time step, t 0, then conical region Ro (T )would be reduced to a triangular region in Storygraph. Thisregion is shown by the area enveloped by two gray lines inthe bottom sub-figure in Figure 9.Figure 10 shows the result of mapping the space-timeprism in Figure 8 in Storygraph. The mapping processresembles the drawing of the space-time prism inside thespace-time cube. Given two control points, maximum velocity and a time budget, these parameters are plugged intoEquation 10 to check whether the control points satisfy thiscriteria. If the criteria is satisfied, we compute the extents(latmax , lngmax ) and (latmin , lngmin ) of the Ro (T ) with thefollowing sets of equations,!latmax maxlatr [ (latr lato )2 (lngr lngo )2!lngmax maxlngr [ (latr lato )2 (lngr lngo )2!latmin minlatr [ (latr lato )2 (lngr lngo )2!lngmin minlngr [ (latr lato )2 (lngr lngo )2"the space-time prisms will overlap. However, since Storygraph does not preserve event proximity (Lemma 3.6), it isimportant to note that these overlaps may not necessarilymean that these prisms intersect in geographical space.Hence, given a point p and a prism Ra (T ) in the Storygraph, we first establish the conditions for a valid pointprism intersection. Building on this, we then present thevalidity of intersection between two prisms.Let Ra (T ) : Ra (T ) Ro (T ) Rd (T ), be all the possiblelocations that the individual can travel within the time budget T with a maximum velocity v. Then following cases forpoint-prism intersection could arise: vT ] (11) vT ] (12) vT ] (13) vT ] (14)Similarly, the extents for the Rd (T ) is calculated. Finally,Rod (T ) is obtained from the intersection of these regions.1. The point is not inside the prism but the location lineis inside Ra (T ). This case implies that the event occurred within the geographical bounds but the individual may not have been involved in the event due tothe travel constraints.2. The point is inside the prism but the location line isnot inside Ra (T ). This implies that the event occurredwithin the time span, T , but at some other location̸ Ra (T ).3. The point is inside the prism and location line is insideRa (T ). This is the only case where the individual couldhave been involved in the event.6.3 Intersections of prisms in StorygraphSpace-time paths and prims are both based on the movement data of characters. Given a dataset containing themovement data of two or more individuals, it is likely thatTheorem 6.1. For a valid point-prism intersection, thepoint should be inside the prism and the location line shouldlie inside Ra (T ).123
Figure 11: Storylines of WTC victims Chief Ganci and Father Judge. Father Judge was officially identifiedto be the first victim of the incident. Only a few key points have prisms between them. For other key points,the distance between them cannot be travelled within the given time at a velocity set by the user. This couldeither mean missing data points, change in velocity, or data reporting error.LatitudeLongitudeIn the immediate aftermath of the attacks in New York onSeptember 11, 2001, the NYC Fire Department convened atask force to interview first responders to the affected areas.These 511 interviews, conducted in the two months following the attacks, were later released by the New York Times.Each
data points. Other methods use contour lines or sound to indicate uncertainty. However, most of the previous works are about visualizing uncertainty data associated with loca-tion and time rather than uncertainty in location and time themselves. For example, color coding, displacement map-ping, and bar glyph on a map cannot show the area of possi-