Transcription
Research Data Analysisusing SPSSByDr.Anura KarunarathneSenior Lecturer,Department of AccountancyUniversity of Kelaniya
MBA 61013Business Statistics andResearch MethodologyLearning outcomesAt the end of the course unit, the student should beable to use statistics as a tool to collect, analyze and interpretdata related to business, use statistical technique for business decisions, solve problems in the field of business with the use ofstatistical software packages
Why a Person/Manager Needsto Know about Statistics ? To know how to properly presentinformation To know how to draw conclusions aboutpopulations based on sample information To know how to improve processes To know how to obtain reliable forecasts
Types of StatisticsDescriptive Statistics: Methods of organizing,summarizing, and presenting data in aninformative way. This type of statistics allowsresearchers to summarize large quantities ofdata using measures that are easily understoodby an observer. EXAMPLE1: According to Consumer Reports, GeneralElectric washing machine owners reported 9 problems per100 machines during 2010. The statistic 9 describes thenumber of problems out of every 100 machines.4
Types of Statistics .Inferential StatisticsInferential Statistics is body of methods usedto draw conclusions or inferences aboutcharacteristics of populations based oninformation obtained from a sample takenfrom the same population.5
Types of StatisticsInferential Statistics: A decision, estimate,prediction, or generalization about a population,based on a sample.A population is a collection of all possibleindividuals, objects, or measurements ofinterest.A sample is a portion, or part, of thepopulation of interest6
SPSS Lecture ProgrammePart-01Introduction about the basics of SPSS and How tomanage SPSS database Designing a SPSS data file based on questionnaire and data feeding. Data PresentationResearch Data Analysis using SPSS Measuring Basic Descriptive Statistical Measures Regression and Correlation AnalysisPart-02Statistical Tests Parametric Test Non-parametric Tests
Introduction: What is SPSS orPASW? One of the most popular user friendly statisticalpackage which can perform highly complex datamanipulation and analysis with simpleinstructions Originally it is an acronym of Statistical Packagefor the Social Science (SPSS) Then, it standsfor Statistical Product and Service Solutions(SPSS) Now Predictive Analytics Software (PASW)
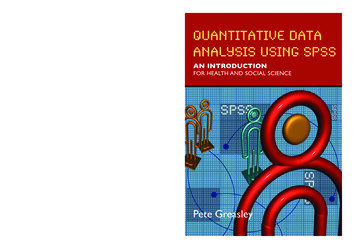
Understanding the Difference betweenExcel and SPSS worksheet .
The Four Windows: DataEditor Data EditorSpreadsheet-like system for defining, entering, editing,and displaying data. Extension of the saved file will be“sav.”
Object of the Course About the four-windows in SPSS The basics of managing data files The basic analysis in SPSS
The Basics ofManaging Data Files
The Four WindowsData editorChart editorOutput viewerSyntax editor
The Four Windows: DataEditor Data EditorSpreadsheet-like system for defining, entering, editing,and displaying data. Extension of the saved file will be“sav.”
The Four Windows: OutputViewer Output ViewerDisplays output and errors. Extension of the saved file willbe “spv.”
The Four Windows: Syntaxeditor Syntax EditorText editor for syntax composition. Extension of thesaved file will be “sps.”
Script Window Script WindowProvides the opportunity to write full-blown programs,in a BASIC-like language. Text editor for syntaxcomposition. Extension of the saved file will be “sbs.”
The Basics ofManaging Data Files
SPSS Data Entry SPSS data can be entered manually.– The format is ready for analysis. SAS, Excel, txt, etc. data can be easilyimported to SPSS. SPSS data files are saved as “SPSS datadocument (.sav)”. SPSS output files are saved as “SPSSviewer document (.spv)”.19
Opening SPSS Start All Programs SPSS Inc SPSS 16.0 SPSS 16.0
Opening SPSS The default window will have the data editor There are two sheets in the window:1. Data view2. Variable view
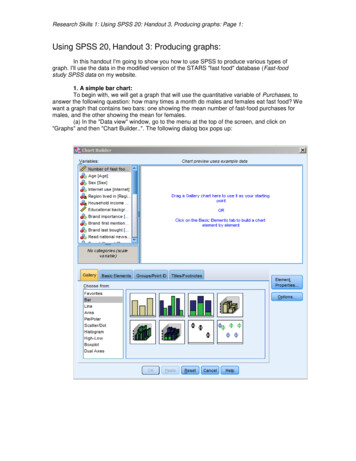
Data View window The Data View windowThis sheet is visible when you first open the Data Editorand this sheet contains the data Click on the tab labeled Variable ViewClick
Variable View window This sheet contains information about the data set that is storedwith the dataset Name– The first character of the variable name must be alphabetic– Variable names must be unique, and have to be less than 64characters.– Spaces are NOT allowed.
Variable View window:Type Type– Click on the „type‟ box. The two basic types of variablesthat you will use are numeric and string. This columnenables you to specify the type of variable.
Variable View window:Width Width– Width allows you to determine the number ofcharacters SPSS will allow to be entered for thevariable
Variable View window:Decimals Decimals– Number of decimals– It has to be less than or equal to 163.14159265
Variable View window:Label Label– You can specify the details of the variable– You can write characters with spaces up to 256characters
Variable View window:Values Values– This is used and to suggest whichnumbers represent which categories whenthe variable represents a category
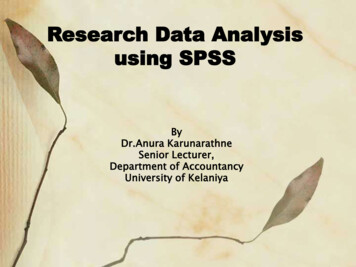
Defining the value labels Click the cell in the values column as shown below For the value, and the label, you can put up to 60characters. After defining the values click add and then click OK.Click
Data rical)Examples: Marital StatusPolitical PartyEye Color(Defined categories)DiscreteExamples: Number ofChildrenDefects per hour(Counted items)ContinuousExamples: WeightVoltage(Measuredcharacteristics)
Format of variables You can also select format ofvariableCategoricalContinuousBinary VariableIntervalVariableNominalVariableRatio VariableOrdinalVariable
Types of Scales Nominal- objects or people are categorizedaccording to some criterion (gender, job category) Ordinal- Categories which are ranked according tocharacteristics (income- low, moderate, high) Interval- contain equal distance between units ofmeasure- but no zero (calendar years, temperature) Ratio- has an absolute zero and consistent intervals(distance, weight)32
Categorical (Nominal) A categorical variable is one that has twoor more categories, but there is nointrinsic ordering to the categories.eg.GenderDepartment/Division
Ordinal Variable An ordinal variable is similar to a categoricalnominalvariable. The difference between the two is that ordinalvariable has a clear rank/order.– SES (Socio Economic Status)– Education Even though we can order these from lowest tohighest, the spacing between the values maynot be the same across the levels of thevariables.
Levels of MeasurementThere are four levels of data.Nominal level: Data that is classified intocategories and cannot be arranged in anyparticular order. EXAMPLES:eye color, gender, religious affiliation.35
Levels of MeasurementOrdinal level: involves data arranged insome order, but the differences between datavalues cannot be determined or aremeaningless. EXAMPLE:During a taste test of 4 soft drinks, Mellow Yellow wasranked number 1, Sprite number 2, Seven-up number 3, andOrange Crush number 4.36
Levels of MeasurementInterval level: similar to the ordinal level, withthe additional property that meaningful amountsof differences between data values can bedetermined. There is no natural zero point. EXAMPLE:Temperature on the Fahrenheit scale.37
Levels of MeasurementRatio level: the interval level with an inherentzero starting point. Differences and ratios aremeaningful for this level of measurement.EXAMPLES:Monthly income of surgeons, or distance traveled by manufacturer’srepresentatives per month.38
Data Measurement LevelsMeasurementsRankingsOrdered CategoriesCategorical CodesID NumbersCategory NamesRatio/IntervalDataOrdinal DataNominal DataHighest LevelComplete AnalysisHigher LevelMid-level AnalysisLowest LevelBasic Analysis
The Relation Between Data Leveland Statistical MethodsData LevelMeaningful s,tamilsClassifying & CountingNPOrdinal;Taste test ranking ofthree brand of soft drinkClassifying, Counting& RankingNPInterval;Calander time,MonetoryUnit,Ferenhighgt,Temperature of three brand ofSoft acting, Multiplication,& DivisionRatio;Heihgt, Weight,Revenue&Expenditure,P/Eratio,Stock Turn Over ng,Multiplication,40& Division
A population is a collection of all possible individuals, objects, or measurements of interest. A sample is a portion, or part, of the population of interest. SPSS Lecture Programme Part-01 Introduction about the basics of SPSS and How to manage SPSS database Designing a SPSS data file based on questionnaire and data feeding. Data Presentation Research Data Analysis using SPSS .