Transcription
VAL U A T I ONUSE OF MONTE CARLOSIMULATIONS IN VALUATIONNEIL BEATON and JOHN SAWYERAlvarez & Marsal Valuation Services LLCIntroductionValuation professionals are constantly presented withchallenging client needs, such as valuing new, andoften exotic, securities with a variety of features thatdefy commonly-used valuation techniques. MonteCarlo simulations, however, can help bridge thegap between ordinary and extraordinary valuationassignments. The Monte Carlo analysis arose out ofcomputer simulations created to address equilibriumproperties for specific experiments. Prior to the adventof computers, the outcome of an experiment could bepredicted in only one way: by making use of a theorythat provided an approximate description of the systemunder consideration. An approximate theory was usedbecause very few model systems could compute exactequilibrium properties. As a result, most propertiesof real materials were predicted on the basis ofapproximate theories. However, approximate theoriesrequired one to execute an experiment and thencompare the results with the thesis. This was suboptimalbecause such experimentation was often expensive, andfeedback took so much time to gather. With the adventof computer simulation, researchers were able to obtainvery accurate results for a given model system withouthaving to rely on approximate theories. It is from thisoriginal work that Monte Carlo has found its way intothe world of valuation.Pulling Back the CurtainOften Monte Carlo is seen as a more sophisticatedmethod for valuing an asset or liability with a level ofcomplexity that traditional valuation approaches ormethods seemingly are unable to capture. However, thefirst step in implementing Monte Carlo is to understandthat it is NOT a distinct valuation approach or methodand does not provide a solution to valuing any asset orliability unless the underlying economics are understood16Vol. 32 No. 2 - 2019and input correctly. Rather than being a valuationapproach or method, Monte Carlo is a technique forperforming a set of calculations for the general purposeof understanding/measuring the impact of one or more,often uncertain, variables on the outcome of thosecalculations, which may represent either a final outputor an input into further calculations.In the implementation of a Monte Carlo simulation,certain distribution and/or correlation assumptionsare applied to one or more variables of a calculation.Then, hundreds or thousands of trials are conductedin which a different combination of input variables isselected based on the distribution and/or correlationassumptions. The outcomes are recorded for eachtrial, enabling a statistical analysis of all the trials of thesimulation.For example, a company’s potential future cash flowcould be analyzed by applying certain distribution andcorrelation assumptions to the variables impacting itsfinancial performance, such as product price, quantitysold, fixed and variable costs, etc. Taken a stepfurther, an appraiser could introduce discounted cashflow calculations into the simulation to measure theuncertainty of the cash flows and/or derive a value ofthe subject company.While a Monte Carlo simulation is an extremelypowerful tool for measuring and obtaining insight intouncertainty, the above example can also be illustrativeof the limitations of this technique.First, the statistics (outputs) produced by the simulationare meaningless if the distributions and correlations ofthe variables (inputs) are not well supported. Garbagein, garbage out, as the proverb goes.Second, the Monte Carlo simulation and the resultingstatistics may provide a false sense of accuracy orAIRA Journal
ability to capture risk and potentially not be any moreinsightful than a simple data table or scenario-basedanalysis (both easily accomplished with tools availablein a standard spreadsheet application).Finally, the mean statistics (typically utilized for estimatingthe value of an asset or liability) produced for any givenoutcome/result may not be meaningfully different thanwould be produced by using static calculations basedon the mean of the underlying inputs/variables. This isparticularly true when the outcome/result varies linearlywithout any upper or lower bounds. Thus, a MonteCarlo simulation may not be as beneficial for certaincalculations, particularly when considering the relativelycomplex and time-intensive nature of implementation.The situations in which Monte Carlo is most useful –and often required – are when attempting to analyze/value an asset or liability with outcomes that are pathdependent, contingent, conditional, and/or non-linear(e.g., fixed outcomes conditional on a variable underlyingmetric, outcomes with minimums or maximums, etc.). Abrief description of each condition follows.Path-dependent outcomes are dependent on themeasurement of certain results or performance overtime. For example, a restricted stock award may vestonly when the underlying stock price reaches a definedthreshold during a defined period; thus, the stock pricesthrough time and not just at maturity dictate the valueof the award.Contingent and/or conditional outcomes are dependenton the occurrence of certain circumstances or results.For example, an acquiring company may offer a fixedearn-out payment to a target company based on thefuture achievement of a minimum earnings target.Non-linear outcomes are those in which the outcomeis not proportional to the underlying asset/liability. Forexample, a typical stock option only provides a positivepayoff if the underlying stock price exceeds the exerciseprice at maturity and results in zero value in all otherscenarios – the payoff is non-linear with respect to theunderlying stock price.the outcome or payoff has any path-dependent,contingent, conditional, or non-linear outcomes thatcannot be properly measured using closed-form orother mathematical solutions. Once these questionshave been answered, it may then be appropriate toconsider a Monte Carlo simulation to address theproblem at hand.Understanding Key Statistics and ConductingDiagnosticsAfter understanding when and how to apply Monte Carlosimulations for valuation purposes, it is important to beable to interpret the resulting statistics of the simulationand conduct diagnostics using those statistics to ensurethe simulation is performing as expected.During the preparation of the analysis/model to be usedin the Monte Carlo simulation, the user should havesome expectations of the performance of the simulationand results, and then identify and design diagnosticsthat will facilitate a statistical analysis of the results.In understanding statistics for any Monte Carlosimulation, it should be reiterated that within thesimulation, each trial is of equal weight (if a certainoutcome is more probable than others, then thatoutcome will occur in more trials than others). Thus, thestatistical analysis is performed on the entire dataset ofthe outcomes from all trials within the simulation witheach outcome given equal weight.The following is a description and summary of how tointerpret some key statistics that may be relevant whenperforming a Monte Carlo simulation:Mean – The mean of the results, in most cases, is theconclusion to derive the input into another calculation(i.e., discrete cash flow when simulating financialstatements) or the estimate of value; therefore, themean is the most critical statistic for valuation purposes(but not the only).These conditions are most often encountered in thevaluation of equity or debt derivatives (such as restrictedstock, options, and warrants with anti-dilution provisions)and other complex financial instruments in which theoutcomes or payoffs generally meet one or more ofthese criteria. Occasionally, a Monte Carlo simulation isemployed even in the absence of these conditions, whenimplementation into a standard closed-form solution,such as a binomial lattice model, may be too complexand difficult with standard spreadsheet software.Median – In certain instances, the median may beconsidered a more meaningful indication of the“average” of a distribution than the mean, given that it isless skewed by outliers. In the context of a Monte Carlosimulation, the median can be helpful in understandingthe distribution of the results. As an example, in aunimodal distribution if the mean is less than the median,this indicates that the mean is not in the middle of thedistribution, but instead the distribution is skewed tothe left. Additionally, certain accounting guidance, suchas determining the average time to vesting for marketbased stock awards, may require the use of the medianfor a particular outcome.In short, Monte Carlo should not be considered amagical solution to valuing an asset or liability. Thevariables determining the outcome or payoffs need tobe understood; then it should be determined whetherMinimum/Maximum – The minimum and maximum arehelpful to understand the potential range of outcomesas well as to ensure the simulation is not producingillogical results (e.g., the value of a restricted stockAIRA JournalVol. 32 No. 2 - 2019 17
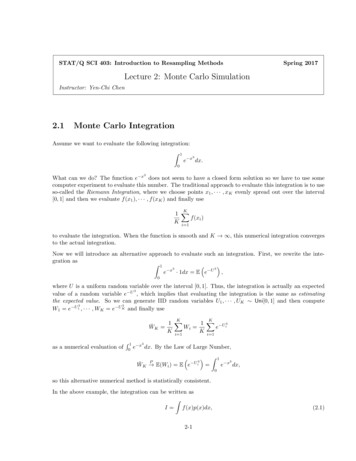
C onti nu e d fr o mp.17award or option should never result in a negative valueor a security with a fixed payoff should not have resultsexceeding the fixed amount).Standard Deviation – The standard deviation is helpfulto understanding the general distribution of the results;a larger standard deviation indicates a wider distributionof results. The expectation regarding the standarddeviation of any outcome should be consistent with theunderlying assumptions (e.g., higher expected volatilityof stock price should correspond with a higher standarddeviation of outcomes) and complexity of payoffstructure, vesting, etc.Kurtosis – The kurtosis is the measure of the extentthe distribution of the results is peaked or flat. Thenotable value is 3.0, which indicates a standard normaldistribution. A kurtosis higher than 3.0 indicates theresults are peaked and concentrated at the mean andless than 3.0 indicates the results are relatively flat at themean.Skewness – The skewness statistic provides a numericalrepresentation of what any observer of a distributionchart would be able to note. A skewness of 0 indicates asymmetrical distribution of results, while a positive valueindicates a log-normal or skewed to the left distribution.While it may be tempting to prepare the Monte Carlosimulation and just pull the mean from the results toderive the estimate of value without further analysis, ithas been our experience that a more detailed review ofthe statistics and advanced consideration of potentialdiagnostics can provide assurances that the simulationis performing as expected and allow an analyst toprovide insightful explanations of the results that maybe invaluable when discussing with stakeholders.An Example of ApplicationAs is the case with most new concepts, an example isoften helpful to fully understand and apply the concept certainly Monte Carlo simulations are no different. Thus,we are using the valuation of a relative total shareholderreturn restricted stock award (commonly referred to asan “rTSR”) to illustrate how to implement and interpretthe results of a Monte Carlo simulation.In our example, the rTSR award’s vesting will be basedon the subject company’s stock price relative to a groupof four peer companies. The vesting percentage isbased on rank of return (calculated using the 20-tradingday average prior to the grant date and preceding thematurity date) over the measurement period (two years),as follows:Rank 1st – 200 percent of sharesRank 2nd – 150 percent of sharesRank 3rd – 100 percent of sharesRank 4th –50 percent of sharesRank 5th –0 percent of shares18Vol. 32 No. 2 - 2019The above vesting conditions contain both conditional(rank of return) and non-linear (shares vesting dependenton rank and the value of the award is not linear withstock price) outcomes; thus, as detailed previously, thevaluation of the rTSR award requires a Monte Carlosimulation.In order to value the rTSR award, simulating the stockprice of the subject company and the four peer companiesis required. The most common and widely acceptedmethod for doing so is the geometric Brownian Motion(GBM). GBM utilizes a beginning stock price (S0), riskfree rate (µ), expected volatility of underlying stock (σ),and simulated variable (ε, a random number that has anormal distribution with a mean of zero and standarddeviation of one) as inputs to the following formula tosimulate each company’s stock price:The simulation can either be done using daily timesteps or, more efficiently, using a one-time jump to thebeginning of the 20-day period at the maturity thenusing daily time-steps (t is the time interval of the timestep).One additional element to consider is the correlationbetween the subject company’s and each peercompany’s stock price as these types of awards oftenuse companies within the same industry and some levelof positive correlation would be expected. Based on ourexperience, correlation can have a meaningful impact onthe results of an rTSR award and thus we incorporatethe correlation in our analysis. The correlation of thesimulated stock prices for each company are addressedby applying a correlation matrix to the simulated variable(ε) for each company for each time-step. This is typicallycalculated based on the historical correlation of dailystock price returns between the subject company andeach of the peer companies, and between each peercompany and all the other peer companies.A Monte Carlo simulation consists of a large number(hundreds of thousands are typically necessary tocapture the potential variability of the outcomes) of“trials” in which a new set of simulated variables (ε in ourexample) are selected based on defined distributions (anormal distribution is a frequently utilized distribution;however, there are many available distributions, such aslog-normal, bi-modal, triangular, uniform, etc., that maybe more appropriate for any specific simulated variable).In our example, one trial would consist of a stock pricepath between the valuation date and the maturity (twoyears) for the subject company and each peer company,representing one potential outcome or scenario. In eachtrial, the return – based on the 20-trading day averagepreceding issuance and the simulated 20-trading dayaverage preceding the maturity – and rank for eachcompany would be calculated and used to determinethe number of shares of the rTSR award vesting, andthen the future value (shares vested multiplied by theAIRA Journal
future stock price) and present value (future value ofrTSR award discounted at the risk-free rate) of the awardwould be determined.At least one metric should be identified then trackedand recorded for each trial, enabling a review andinterpretation of the results of the Monte Carlosimulation using statistical analysis. Often, we will trackseveral metrics within the analysis to allow us to evaluatewhether the simulation is performing as expected andfurther understand how various assumptions/factorsmight be impacting the results. For example, we mighttrack the number of shares of the subject rTSR awardvesting in each trial to ensure the minimum is not lessthan zero and maximum is not greater than 200 percentof the total award and understand the frequency/probability of reaching each vesting threshold (trackingthe rank for each company would provide some insighthere as well).In addition to analyzing the results of a key outcome(s)to derive the intended value estimate, the statisticalanalysis can be leveraged for other outcomes within thesimulation to interpret the performance of calculationsand understand the results. Leveraging the exampleof the application of a Monte Carlo simulation for thevaluation of an rTSR award, we can provide severalexamples of diagnostics that could be conducted forsuch an analysis.One outcome of the rTSR simulation that would be ofinterest to analyze is the number of shares vesting and/or the rank of the subject company’s stock price return.A simple solution would be to track the rank and/ornumber of shares vesting in each trial; however, thestatistical analysis of the rank or number of shares vestingwould not necessarily provide a clear understanding ofthe frequency of the various vesting thresholds (i.e., rankof return) being achieved. Alternatively, a secondarycalculation could be performed which would result ina value of 1 when a certain rank is achieved and 0 ifnot; the resulting mean of all trials would provide theprobability of that rank being achieved.Another diagnostic that is often helpful to perform whenpreparing a valuation of an equity security or derivativeusing a risk-neutral framework (i.e., geometric BrownianMotion) is to calculate the present value (discounted atthe risk-free rate) of the payoff of a standard Europeanstock option (maximum of 0 and future stock price lessexercise price) then compare the mean of the results tothe value indicated by a standard Black-Scholes-Mertonoption pricing model with the same assumptions, whichwould provide some reassurances that the simulation ofthe stock price is behaving as expected and/or a sufficientnumber of trials has been selected. Alternatively, thebehavior of the stock price simulation can be assessedby comparing the mean of the results of the presentvalue of the future stock price at maturity in each trialAIRA Journalto the beginning stock price; the theoretical differenceshould be zero.In the subject example, the key metric to track wouldbe the resulting present value of the rTSR award foreach trial as the mean of all the trials would representthe conclusion of the fair value or fair market value ofthe rTSR award (each trial is equally likely and, therefore,given equal weight). Additionally, it might be necessaryto track the time to vesting for awards with variablematurities to capture the median term for certainaccounting disclosures under financial reporting.In conclusion, Monte Carlo simulations can be useful andpowerful tools for the valuation analyst tackling complexproblems that don’t lend themselves to commonly-usedvaluation techniques. Once the Monte Carlo frameworkis understood, relevant inputs can be identified andsimulated to provide statistically valid results that canenhance most valuation assignments.ABOUT THE AUTHORSNeil BeatonNeil is a Managing Director with Alvarez& Marsal Valuation Services, LLC.Previously, he was the Global Lead ofComplex Valuation with Grant ThorntonLLP. He has over 25 years of experienceanalyzing both closely and publicly heldcompanies. Neil has appeared as anexpert witness across the country, is afrequent lecturer at local universities,an instructor for the AICPA’s businessvaluation courses, and speaks nationally on business valuationwith a special emphasis on early stage and high technologycompanies. He has served on a number of AICPA Committeesand Task Forces. Neil has a Bachelor of Arts Degree in Economicsfrom Stanford University and a Master of Business Administrationin Finance from National University. In addition to his formaleducation, Neil is a Certified Public Accountant, Accredited inBusiness Valuation, Certified in Financial Forensics, a CharteredFinancial Analyst and an Accredited Senior Appraiser in businessvaluation from the American Society of Appraisers.John SawyerJohn Sawyer is a Senior Director withAlvarez & Marsal Valuation Services, LLC.Prior to joining A&M, John worked inGrant Thornton LLP’s valuation servicepractice and Ernst & Young’s complexsecurities group, where he focusedon quantitative analysis of financialinstruments and early stage companyvaluation. He specializes in the valuationof public and closely-held business andbusiness segments, complex financial instruments, and relatedmatters for financial statement reporting, tax reporting, corporateplanning, litigation support, and other purposes. John has beeninvolved with research and valuing companies in a variety ofindustries, including energy, green-tech, aerospace, blockchain,battery-technology, electronic vehicles, biotechnology andpharmaceutical, cryptocurrency mining, Internet, software, and avariety of other technology segments. John earned a Bachelorof Arts Degree in Business Administration, with a FinanceConcentration, from Washington State University.Vol. 32 No. 2 - 2019 19
AIRAAssociation ofInsolvency &Restructuring Advisors221 W. Stewart Avenue, Suite 207Medford, OR 97501Phone: 541-858-1665Fax: 541-858-9187aira@aira.orgwww.aira.org
certainly Monte Carlo simulations are no different. Thus, we are using the valuation of a relative total shareholder return restricted stock award (commonly referred to as an "rTSR") to illustrate how to implement and interpret the results of a Monte Carlo simulation. In our example, the rTSR award's vesting will be based