Transcription
LabVIEW BasicsPeter Avitabile,Jeffrey HodgkinsMechanical Engineering DepartmentUniversity of Massachusetts LowellLabVIEW Notes – Getting Started1Dr. Peter AvitabileModal Analysis & Controls Laboratory
LabVIEWLabVIEW is a data acquisition software packagecommonly used with hardware acquisition boardsLabVIEW has many features for data acquisitionand processing of either measured data orsimulated signals.LabVIEW Notes – Getting Started2Dr. Peter AvitabileModal Analysis & Controls Laboratory
LabVIEW – Start UpLabVIEW will be explored using some simple signalsLabVIEW Notes – Getting Started3Dr. Peter AvitabileModal Analysis & Controls Laboratory
LabVIEW – Start UpLabVIEW will be explored using some simple signalsNEW – template selectoror click on arrow for eitherNEW,blank vi,orrecently accessedLabVIEW Notes – Getting Started4Dr. Peter AvitabileModal Analysis & Controls Laboratory
LabVIEW – Blank viTwo windows appear –‘Block Diagram’ & ‘Front Panel’LabVIEW Notes – Getting Started5Dr. Peter AvitabileModal Analysis & Controls Laboratory
LabVIEW – Front PanelRight mouse click to open important ‘Controls’ paletteThese include graphical controls, knobs, sliders, text boxes,LEDs,switches, and other specialty itemsNOTE: Sub-categories may be available for each layerLabVIEW Notes – Getting Started6Dr. Peter AvitabileModal Analysis & Controls Laboratory
LabVIEW– Block DiagramRight mouse click to open important ‘Functions’ paletteThese include acquisition tools, signal analysis, output devices,programming tools, arithmetic operators, and other processing toolsNOTE: Sub-categories may be available for each layerLabVIEW Notes – Getting Started7Dr. Peter AvitabileModal Analysis & Controls Laboratory
LabVIEW – HELP - Exists in several formsHELP - Show Context HELPWindow reports general use characteristics foreach icon the mouse passes overLabVIEW Notes – Getting Started8Dr. Peter AvitabileModal Analysis & Controls Laboratory
LabVIEW – HELP - Exists in several formsWINDOWS - Show Tools PaletteExtremely useful panel for assigning a specific toolfunction to the mouse.LabVIEW Notes – Getting Started9Dr. Peter AvitabileModal Analysis & Controls Laboratory
LabVIEW – HELP - Exists in several formsHELP - VI,function& how toFindexamplesLabVIEW Notes – Getting Started10Dr. Peter AvitabileModal Analysis & Controls Laboratory
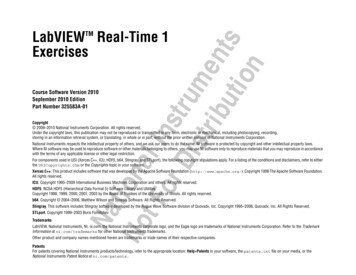
LabVIEW – Tutorial (Getting Started)Tutorial Name: ‘Generate, Analyze, and Display’LabVIEW Notes – Getting Started11Dr. Peter AvitabileModal Analysis & Controls Laboratory
LabVIEW – Starting Front PanelFront Panel has a display for outputLabVIEW Notes – Getting Started12Dr. Peter AvitabileModal Analysis & Controls Laboratory
LabVIEW – Starting Block DiagramBlock Diagram illustrates how system is assembled.LabVIEW Notes – Getting Started13Dr. Peter AvitabileModal Analysis & Controls Laboratory
LabVIEW – Tutorial (Getting Started)Relationship between Block Diagram and Front PanelLabVIEW Notes – Getting Started14Dr. Peter AvitabileModal Analysis & Controls Laboratory
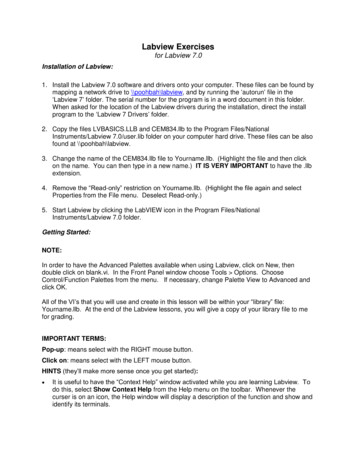
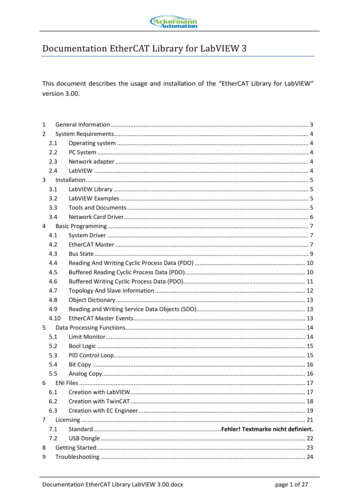
LabVIEW – Simulate SignalA sine signalis generatedusingSimulateSignalDouble clickfor propertiesSine at 10 Hz with 1 volt peak and offset at 0.25Sampling 1024 samples per second and 512 samplesLabVIEW Notes – Getting Started15Dr. Peter AvitabileModal Analysis & Controls Laboratory
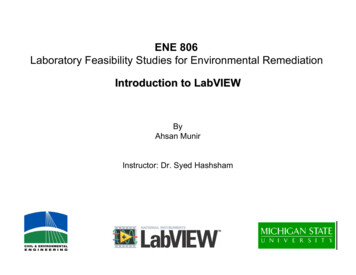
LabVIEW – Amplitude and Level MeasurementsSignals can beinterrogatedAmplitudeLevel MeasurementDouble clickfor propertiesMeasurements of DC, RMS, peak, etc can be obtainedLabVIEW Notes – Getting Started16Dr. Peter AvitabileModal Analysis & Controls Laboratory
LabVIEW – Amplitude and Level MeasurementsOperatorsIndicatorsThese haveselectableelementsbased ondesiredparametersof interestAre used toexportoutput to thefront panelMany tools availableLabVIEW Notes – Getting Started17Dr. Peter AvitabileModal Analysis & Controls Laboratory
LabVIEW – Amplitude and Level MeasurementsAs items are added to each of the Functions,Indicators and Controls, these selected items willappear in the Front Panel and/or Block Diagram.These need to be wired into the diagram andinitial parameters identified.LabVIEW Notes – Getting Started18Dr. Peter AvitabileModal Analysis & Controls Laboratory
LabVIEW – Amplitude and Level MeasurementsControlsOperatorsThese haveselectableelementsused forchangingparametersof interestThese haveselectableelementsbased ondesiredparametersof interestYou can change the data range of the control byright-clicking on control and selecting ‘Properties’.Adjust ‘Data Range’ and ‘Scale’ tabs.Many tools availableLabVIEW Notes – Getting Started19Dr. Peter AvitabileModal Analysis & Controls Laboratory
LabVIEW – Amplitude and Level MeasurementsAdd several features such asInput Box for DC offset of sine waveDial for Frequency ControlsSlider for AmplitudeLabVIEW Notes – Getting Started20Dr. Peter AvitabileModal Analysis & Controls Laboratory
LabVIEW – Amplitude and Level MeasurementsSelect another output parameter such as DCNotice RMS is already hooked up but DC needs tobe attached to some output deviceLabVIEW Notes – Getting Started21Dr. Peter AvitabileModal Analysis & Controls Laboratory
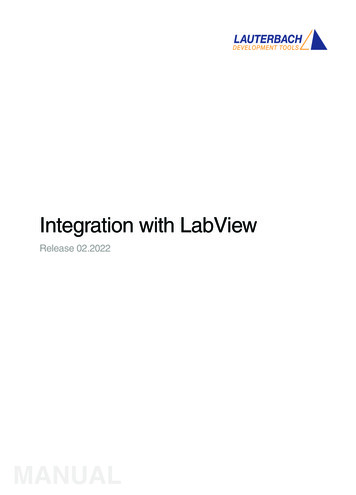
LabVIEW – Amplitude and Level MeasurementsCreate a dial to change frequency.Expand the simulate signal VI by clicking anddragging the gray arrow on the bottom of the icon.Create controlLabVIEW Notes – Getting Started22Dr. Peter AvitabileModal Analysis & Controls Laboratory
LabVIEW – Amplitude and Level MeasurementsCreate a dial to change frequency.To change to a dial, right-click on control and:Can changerange, scale,precision,etc. byright-clickingon dial, andselectingpropertiesLabVIEW Notes – Getting Started23Dr. Peter AvitabileModal Analysis & Controls Laboratory
LabVIEW – Amplitude and Level MeasurementsCreate a slider to change amplitude.Follow the previous steps for creating a dial, onlythis time do it for the amplitude property of thesimulate signal VI.Also select ‘Pointer Slide’ instead of ‘Dial’Can changerange, scale,precision, etc. byright-clicking onslider, andselectingpropertiesLabVIEW Notes – Getting Started24Dr. Peter AvitabileModal Analysis & Controls Laboratory
LabVIEW – FFT Express VINow the time signal can be converted to thefrequency domain using the ‘Spectral MeasurementsBlock’It can by found in:LabVIEW Notes – Getting Started25Dr. Peter AvitabileModal Analysis & Controls Laboratory
LabVIEW – FFT Express VIA parameter window will appear once VI is placedon wire diagram. Here you can set desired outputformats, windows, averages, etc.LabVIEW Notes – Getting Started26Dr. Peter AvitabileModal Analysis & Controls Laboratory
LabVIEW – FFT Express VIWire in the signal to be analyzed, and wire outgraph indicators to display amplitude and phase.From Simulate SignalLabVIEW Notes – Getting Started27Dr. Peter AvitabileModal Analysis & Controls Laboratory
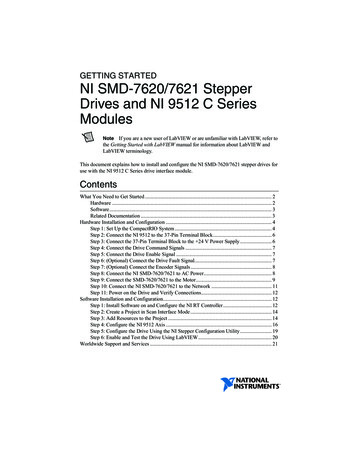
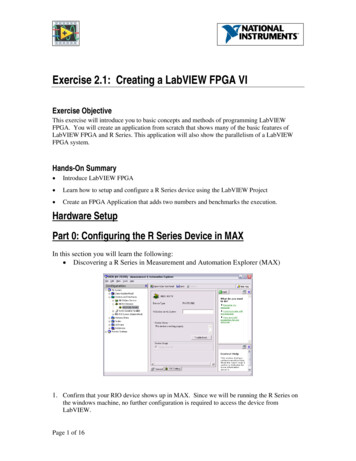
LabVIEW – FFT Express VIThe resulting front panel display is:LabVIEW Notes – Getting Started28Dr. Peter AvitabileModal Analysis & Controls Laboratory
LabVIEW – Task to be performedStart a new VI and generate a sine wave withboth amplitude and frequency input controls – takethe FFT of the sine wave (select the sine wave tosatisfy the periodicity requirements of the FourierTransform)Generate harmonics of that sine wave to ultimatelyform a representation of a square wave in boththe time and frequency domainCreate a square wave that represents the truetime and frequency of the signal for comparison(Here are a few extra things you’ll need to know)LabVIEW Notes – Getting Started29Dr. Peter AvitabileModal Analysis & Controls Laboratory
LabVIEW – Extras – While LoopIn order to have a program that will continuerunning and stop when a ‘stop button’ is pressed, awhile loop can be used.Note: Unless in emergency situations, never use the ‘abort button’.Always program in a ‘stop button’.LabVIEW Notes – Getting Started30Dr. Peter AvitabileModal Analysis & Controls Laboratory
LabVIEW – Extras – Summing SignalsIn order to sum signals together:-Make sure each signal has the samenumber of samples-Limited to only adding to signalstogether at a time‘Add Block’LabVIEW Notes – Getting Started31Dr. Peter AvitabileModal Analysis & Controls Laboratory
LabVIEW – Extras – Manipulating Multiple SignalsIn order to run multiple signals through a VI (FFT,Waveform Graph ) signals must be run through amerge block.‘Merge Block’The block can be resized to allow for more thantwo signalsLabVIEW Notes – Getting Started32Dr. Peter AvitabileModal Analysis & Controls Laboratory
LabVIEW – Task to be performedGenerate a low pass filter (1st order Butterworth)and apply it to your square wave approximation.You may want to investigate higher order filters aswell.Select a cutoff frequency (that is variable via acontrol) to filter the higher frequencies of thesummed Fourier series of sine waves.Modify the low pass filter to make it a band passfilter for viewing tight bands around each sinewave that makes up the terms of the Fourierseries. Note the effects of the filter on both thetime and frequency signals.(Here are a few extra things you’ll need to know)LabVIEW Notes – Getting Started33Dr. Peter AvitabileModal Analysis & Controls Laboratory
LabVIEW – Extras – Filter blockFiltering of input signals can be done by using the‘Filter Block’ found in:LabVIEW Notes – Getting Started34Dr. Peter AvitabileModal Analysis & Controls Laboratory
LabVIEW – Extras – Filter blockA parameter window will appear once VI is placedon wire diagram. Here you can set desired filtertype, cutoff frequencies, topologies, etc.LabVIEW Notes – Getting Started35Dr. Peter AvitabileModal Analysis & Controls Laboratory
LabVIEW -Tutorial (Getting Started) Tutorial Name: 'Generate, Analyze, and Display' 12 Dr. Peter Avitabile Modal Analysis & Controls Laboratory LabVIEW Notes -Getting Started LabVIEW -Starting Front Panel. Front Panel has a display for output . 13 Dr. Peter Avitabile