Transcription
Munich Personal RePEc ArchiveA visualization review analysis of the lasttwo decades for Environmental KuznetsCurve “EKC” based on co-citationanalysis theory and pathfinder networkscaling algorithmsKoondhar, Mansoor Ahmed and Shahbaz, Muhammad andMemon, Kamran Ali and Ozturk, Ilhan and Rong, KongNorthwest AF University, Yangling, 712100 China, Beijing InstituteTechnology, Beijing 100081, China, Science Technology,Nawabshah, Pakistan, Cag University, Mersin-Turkey, Northwest AFUniversity, Yangling, 712100 China7 December 2020Online at https://mpra.ub.uni-muenchen.de/104949/MPRA Paper No. 104949, posted 30 Dec 2020 16:09 UTC
A visualization review analysis of the last two decades for Environmental Kuznets Curve“EKC” based on co-citation analysis theory and pathfinder network scaling algorithmsMansoor Ahmed KoondharCollege of Economics and Management,Northwest A&F University, Yangling, 712100 China.Email: socialist.mansoor@yahoo.comMuhammad ShahbazEconomics Center for energy and Environmental Policy of Research,Beijing Institute Technology, Beijing 100081, China.Email: muhdshahbaz775@gmail.comKamran Ali MemonDepartment of Electronics EngineeringQuaid-e-Awam University of Engineering, Science & Technology, Nawabshah, PakistanEmail: ali.kamran77@gmail.comIlhan OzturkFaculty of Economics and Administrative Sciences, Cag University, Mersin-TurkeyEmail: ilhanozturk@cag.edu.trKong Rong*College of Economics and Management,Northwest A&F University, Yangling, 712100 China.Corresponding Email: 3115059778@qq.comAbstract: Environmental Kuznets curve (EKC) is a statistical tool to examine the cointegrationand causality nexus between economic growth and carbon emissions. The EKC is widely used inenergy and environmental economics studies. Although, a large number of researchers haveanalyzed the EKC by applying different statistical models, and some review work has beensummarized to draw a pictorial view of extending studies in this research field. However, still,the macroscopic overview needs to be considered. Therefore, this study aims to contribute to theliterature for finding a new pathway for further research employing, and to facilitate this researchScientometric analysis is carried out by feature in CiteSpace. The dataset of screened 2384records out of a total of 59225 Web of Science (WoS) references for the timespan 1999-2019was used to visualize the knowledge map and outcome of the scientific enterprise. Thevisualization results reveal the most influencing studies, institutions, authors, countries,keywords, and category cloud, in the research field of EKC. This paper reveals that the researchon EKC in alignment with green and sustainable technology science requires more attention.Further, this paper would help authors and publishers make their decisions for the research ofEKC and planning for future perspectives to contribute to academic development and appliedmethodology.Keywords: Environmental Kuznets Curve (EKC), Bibliometric, Scientometric AnalysisAlgorithm, Co-citation, Visualization, CiteSpace1
1. IntroductionEnvironmental Kuznets Curve (EKC) so-called hypothesis is running from economicdevelopment to environmental degradation. In other words, EKC is a commonly used tool toidentify the nexus between economic growth and the environment. First time in (1991)Grossman and Krueger used this tool to identify the environmental influence on free tradeagreements for North America. Their results revealed that sulfur dioxide and smoke graduallyrise in parallel with economic growth but at the low level of the national economy. These resultswere confirmed by World Bank in 1992 and published in a report in 1997 (Programme 1997).The dominant environmental degradations increase in parallel with income until the turning pointhitting becomes steady and moves downward. In 1955, inverted-U shaped relationship was foundby Simon Kuznets who presented a comparable nexus between income disparity and growth ineconomics (Kuznets 1955). Once an economy starts running towards development, it heavilyputs footprints on the environment at the first step of economic growth. This can be observed inthe form of air population, decreased soil fertility and increase in water contamination, etc.Previously, economic growth decreases and pollution increases, but beyond per capita incomethat rises and falls due to some factors and time trends. Therefore, it was a concept that highincome ultimately leads to growth in pollution (Stern 2004). Possibly inexorably, the increasingstrand of this literature review has been critical, claiming that the hypothesis of theEnvironmental Kuznets curve is brittle. Therefore, it needs a very cautious concentration forclear understanding (Fang, Huang et al. 2020) The hypothesis of EKC suggests that the early legof economic growth is considered due to the overuse of natural resources which ultimatelyreduce the availability of natural resources and causes to increase pollutant in an ecologicalenvironment (Balsalobre-Lorente, Shahbaz et al. 2018; Sarkodie and Strezov 2019).In earlier research, many research papers were formulated based on the EKC hypothesis in orderto find the relationship between environmental quality and economic growth (Panayotou 2016;Tiba and Omri 2017). The hypothesis of EKC reveals that there is indeed a unidirectionalcausality extending from economic growth to deterioration of the environment or declaresinverted-U shaped nexus among income and environmental quality (Orubu and Omotor 2011;Ahmed and Zeshan 2014; Conrad and Cassar 2014; Shahbaz, Nasreen et al. 2015). Thus, it canbe said that economic development will finally untie environmental influence at the initial stageof economic development (Blind 2012). From the dearth of literature, many researchers use theEKC hypothesis for investigating the nexus between CO2 emissions, energy consumption, andeconomic growth (Ozturk and Acaravci 2010; Al-Mulali 2011; Xue, Geng et al. 2014; Haseeband Azam 2015; Ozturk, Al-Mulali et al. 2016). Early research confirms the EKC for Algeria byBouznit and Pablo-Romero (2016) and for Eastern and North African countries Arouri, Youssefet al., (2012), for subsehrah Africa Ozturk and Bilgili., (2015), EKC confirmed by DemissewBeyene and Kotosz (2020). For India EKC confirmed by Sinha and Shahbaz (2018), Sinha andbhattacharya (2017), for Qatar by Mrabet and Alsamara (2017), for BRI countries by Rauf et al.(2018), for south Asian countries Nasreen et al., (2017), and Ahmed et al., (2017), for Nigeriaby Nnaji et al. (2013), Joo et al. (2015), Mesagan (2015), for Portugal Shahbaz et al (2015), forPakistan by Haseeb and Azam (2015)Mirza and Kanwal(2017), Sharif et al. (2017), Aziz et al.(2020), for China by Solarin et al. (2017), Yuan et al. (2015), Riti et al. (2017), Koondhar et al.(Koondhar, Qiu et al. 2018), (2020).2
The EKC is the statistical concept, however, most of the studies based on the EKC analyzed, arenot statistically reliable (Akbostancı, Türüt-Aşık et al. 2009). From the literature, it is clear thatespecially in developed countries concentration of pollution contribution in the environmentdecreases, but still, there is a relatively lower clearance of pollutant emissions (Smith 2013; Stern2014). Apart from national economic growth conducted studies on running nexus from per capitaincome to the pollution that effort evades too many statistical drawbacks in order to investigateper capita pollution increase in parallel with per capita income. The developed countries'economic growth is relatively lower, and pollution decreases with parallel in the speed of growtheffect. It seems, there is a significant and positive sign of existence of EKC effect. These resultsreveal that, although pollution problems are highlighted in developing countries, still there is noevidence to vicissitudes in pollutions.Nowadays, Bibliometrics is the widely used statistical method to analyze scientific publicationsand understand the past, present, and future trends in certain fields of research. Bibliometricsuses citation analysis technique as opposed to the existing review/survey papers and constructsthe citation graph, a network or graph representation of the citations between documents tomeasure the impact of their field, the influence of a group of researchers/countries/institutes, andthe intensity of specific research, journal or author. The furthermost usual research was done onco-citation nexus, keywords linkages, and an association between co-authors. Considering theassociation of co-citation, if there are two studied and the third paper published and cited earlierpublished both papers so-called co-citation (Saini, Dutta et al. 2020; Sheikhnejad and Yigitcanlar2020). This technique is more reliable and easy for aspirant researchers to understand a certainresearch field with heavy literature data. Bibliometric mapping technique not only provides apictorial description of the state of the sculpture in the world of research but also deliverdirection for scientists in emerging their area of research interest on a specific topic,hypothetically signifying stimulus for future theoretical and practical approaches to enlarge aspecific field of existing literature.Bibliometrics analysis previously has been used in several studies for different researchdirections. A recent study published by Sun et al. (2020) used a bibliometric approach in theresearch field of air pollution and child health. For a sustainable landscape in an urban and ruralarea, Sheikhnejad and Yigitcanlar (2020) used the same technique. The energy consumptionparadigm in the agricultural industry for China is analyzed by Wei et al. (2020). Li et al. (2019)used visualization analysis for the impact of nanomaterials in the environment. Research on theresource recycling industry is done by Wang et al. (2019). Knowledge mapping for the researcharea of business and management is investigated by Jia et al. (Jia, Wei et al. 2019). In previousresearch, different researchers used different econometric models to identify the correlationbetween solitary variables. However, we use bibliometric analysis to find the research gap fromthe previous literature. Although numerous authors have already used bibliometric analysis indifferent research areas, no one scholar has visualized EKC using bibliometrics. In this study, weuse the retrieved data from the web of science (WoS) on the research field of EKC for the lasttwo decades and analyze the network mapping visualization, with objectives to find the pathwayof research gaps in the research field of EKC. This research will contribute to literature for thefuture trend of research. I will also help researchers to do the research which is not previouslydone. In addition, this research will also help the young scholar to find potential institutes,professors, and countries for further studies or collaboration. May this study will also be valuable3
for the journals to bring their pathway and authors to choose the journal for their research.Bibliometric is not only focusing on specific methods and research area, researchers can use thisstudy as model to visualize another research field in order to efficiently find missing researchlinks, journals, institutions, active researchers, and future trend of the research.2. Methodology2.1. Data CollectionIn order to have relevant research papers in the dataset, the selection of literature was donecarefully and only papers from trusted core collections of WoS were selected. Science CitationIndex Expanded (SCIE), Social Sciences Citation Index (SSCI), Conference Proceeding CitationIndex Science (CPCI-S) and Conference Proceedings Citation Index-Social Science andHumanities (CPCI-SSH) indexes and time period of last two decades “1999-2019” were set forthe data set retrieval. In this time period of two decades, climate changes and CO2 emissionshave signified footprints, population and urbanization are increasing with timespan owing toreducing limited available resources. The topic selection word was the Environmental KuznetsCurve “EKC”. The total 2360 articles direct and indirectly linked with EKC were retrieved andthen imported into the Bibliometric tool CiteSpace for the visualization analysis of differentcategories supported by the tool. This study didn’t collect the papers by traditional searchingsurvey on google scholar. Firstly, the main reason was traditional survey is the time consumingmethod. Secondly it can’t gives accurate information may we also miss some importantliterature. Third, the selected paper from WoS present a broader view of the EKC research field,and give a pictorial picture of both relevant and irrelevant articles. Fourth, available review andsurvey papers in the field are not based on the citations. The number of times a paper is citedreflects its research worth, and papers with similarities are commonly cited together. Thus, cocitation based analysis of research articles, authors, journals, countries, and institutions is moreintuitive in revealing research structure, analyzing the developments and predicting the futuredirections in specific research area {Memon, 2020 #1001}. The detail of data collection issummarized in Table 1.Table 1: Data SetIndicatorsDescriptionAcquired Data from DatabaseWoSData indicesSCIE, SSCI, CPCI-S, CPCI-SSHLanguage and Document typeEnglish, all documents or articles onlyTopic selection wordsEnvironmental Kuznets Curve EKCTimespan1999- 2019Records for EKC2384Note: The data retrieved from WoS accessed from NWAFU library2.2. Visualization ToolThe standard Citespace tools analyze the theoretical and pathway network map of co-citationreferences with scaling algorithms. Intellectual turning points play a key role in the developmentand construction of scientific fields. Through classifying these turning points, Citespace helps theauthor to find a missing research link in a certain research field and grasp a clear understandingof the field. Chaomei Chen in 2004 developed Citespace software, which is updated in time totime by Chen’s research team of Chen (2004),(2006). The latest updated version is available at4
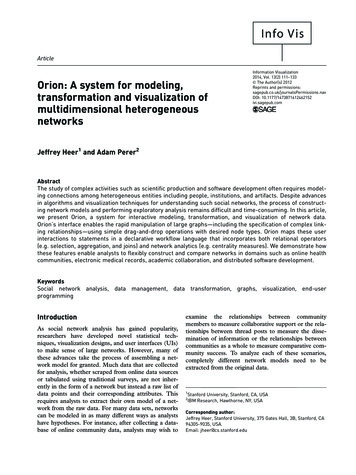
atest/download. Author co-citation analysis“ACA”, one of the key features of CiteSpace, was introduced by White and Griffith (1981).ACA is used to classify and visualize the intellectual formation of a particular research area(Jeong, Song et al. 2014). Citation frequency is the foremost foundation of present ACA tool.Considering the co-citation analysis between related studies for a certain research field, theknowledgeable bases, research facades, and expansion trends in the field can be visualized.Therefore with the help of visualization analysis author efficiently can conduct in-depth researchon a certain research area.2.3. Visualization Results and AnalysisThis paper presents 11 different visualization analyses related to the research field of EKC forthe two decades using Citespace. These visualizations include co-citation visualization,cooperation visualization, and co-occurrence visualization by analyzing cited references, citedjournal, country, institution, author, keyword, category, and overlay of visualization.2.4. Visualization of Cited ReferencesCited reference visualization is a graphic reference map, which identifies the most significantstudies in a particular research area. For the research area of EKC, time-slicing was selectedfrom 1999-2019 with 1 slice per year, node type selected was set as “Cited reference” andstrength of correlation was measured based on the Cosine metric (Equation-1):Co sin e (a, b) C aC bCa Cb(1)where Ca Cb denotes the co-citation reference of paper (a) and paper (b), while Ca , Cb sign forcitation time of paper a and b respectively. The filtering strategy of Top N (N 100) strategywas used which implies that only Top number of records in terms of citation frequency duringthe year/slice would be selected for the visualization of 2384 references as shown in Figure 1.Based on the ACA, among the top 10 authors in citation count by Stern (2004) ranks the first. Heargued that the EKC causes to increase in the environmental degradation curve and fallen by theincrease in per capita income. Halicioglu (2009) ranked second with a citation count of 1268. Hisstudies present the conclusion in two forms, considering the long-run nexus of first form carbonemissions resolute by consumption of energy, foreign trade, and income as well. While in thelong-run association of 2nd form income determining causes to foreign trade, carbon emissions,and energy consumption (Halicioglu 2009). The third top-ranked work with a citation count of892 is published by Jalil and Mahmud (2009). The results conclude that the quadratic associationvaries from income to carbon emissions, and the long-run and short-run nexus was confirmed bythe test of the stability of the model. Another cited author analyzed the nexus between energyconsumption, economic growth, and CO2 emissions for countries in the middle east and NorthAfrica countries, using panel data from 1981-2005. Authors concluded that long-run energyconsumption significantly causes carbon emissions, and may in future carbon emissionsreductions by reducing per capita income (Arouri, Youssef et al. 2012). In previous literature, thestudy concluded that carbon emission tends to increase by per capita income (Cederborg andSnöbohm 2016; Yeh and Liao 2017). Kasman and Duman (2015) also used panel data for EUmember and candidate countries in order to find causality carbon emissions, energy use, trade,growth in economics, and urbanization. The results found that short-run unidirectional5
cointegration is varying from the use of energy towards the international exchange and carbonemissions to urbanization (Table 2).Figure 1: Reference Co-citation Map VisualizationAn earlier study conducted by one of the most cited reference author, this study attempt toanalyze the correlation between economic growth and CO2 emissions for Malaysia (Saboori,Sulaiman et al. 2012). The results of this study reveal that long-run association from carbonemissions towards per capita GDP also confirms the inverted-U shaped curve running from CO2emissions to GDP both in the long-run and short-run axis. The results of this study are contraryto previous research (To, Ha et al. 2019). Another study also found an inverted-U shaped curvebetween carbon emissions and per capita income (Apergis and Ozturk 2015). Nasir andRehmand (2011) estimated the environmental Kuznets curve for carbon emissions in Pakistan.However, the results of their short-run association denied having EKC between selectedvariables. Furthermore, one of the studies was estimated EKC for Vietnam results reveals thatEKC does not exist due to both long-run and short-run nexus GDP and pollution declarespositive and significant relationship (Al-Mulali, Saboori et al. 2015). Moreover, the existence ofEKC was confirmed by VECM and IAA technique for Tunisia (Shahbaz, Khraief et al. 2014).Among the top 10 most cited authors, most of the papers were published in energy policy.CitationCounts29471268892Table-2: Top 10 Co-cited Authors based on Citation CountsAuthorsJournal NameDOIStern (2004)WorldDevelopmentEnergy PolicyHalicioglu(2009)Jaliland Energy ://doi.org/10.1016/j.enpol.2009.07.0446
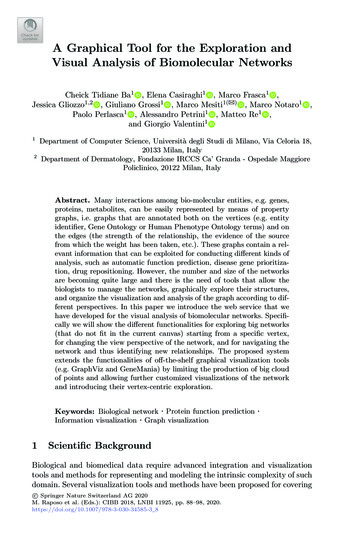
593470451350334202186Mahmud(2009)Arouri et al.(2012)Kasman andDuman(2015)Saboori et al.(2012)Apergis andOzturk (2015)NasirandRehman(2011)Al-Mulali etal. (2015)Shahbaz andLean, (2012)Energy conomic Energy cologicalIndicatorsEnergy 6https://doi.org/10.1016/j.enpol.2011.01.025Energy enewable and bleEnergyNote: Author visualized this in Citespace v.5.6.R2Citespace also presents the clustering visualization of all the papers in the dataset. Clusteringvisualization uses a log-likelihood ratio (LLR) algorithm to combine the papers with a commontheme/area/problem addressed in one cluster/group. The LLR is a statistical test used forcomparing the goodness of fit of two statistical models, and also shows the trends of a null modelagainst an alternative model. The test is based on the likelihood ratio, which expresses how manytimes more likely the data are under one model than the other. This likelihood ratio, orequivalently its logarithm, can then be used to compute a p-value, or compared to a critical valueto decide whether or not to reject the null model As a result, papers in one cluster present thesame research domain and different clusters present the overall research domains of the field.These clusters are characterized by silhouette values, which indicate the relativeness of thepapers in the same cluster. The first largest cluster in our analysis has 217 members and asilhouette value of 0.809. It is labeled as an Environmental Kuznets Curve by both the LLRalgorithm. The most active citer to the cluster is Dinda, (2004), Environmental Kuznets Curvehypothesis, and this paper was published in the Ecological Economics journal. In this paper, theauthor argued that EKC has an inverted-U shaped curve along with non-identical emissions andincome per capita. He acquires that environmental coercion of specific reasons leads to anincrease in income. Considering the 2nd largest cluster has 199 members and a silhouette value of0.688, and labeled with energy consumption reading ability by LLR algorithm.Considering energy consumption paper was published in Natural Hazards, published by AlMulali et al. (2015) entitled the impact of emissions in Europe by growth in economics,international trade, urbanization, financial development, and renewable energy, and argued thatcarbon emissions, economic growth, increasing urbanization pressure, and production ofrenewable energy has cointegration at the level. Furthermore, they concluded that generatingrenewable energy shows a negative long-run association with carbon emissions. The third-largest7
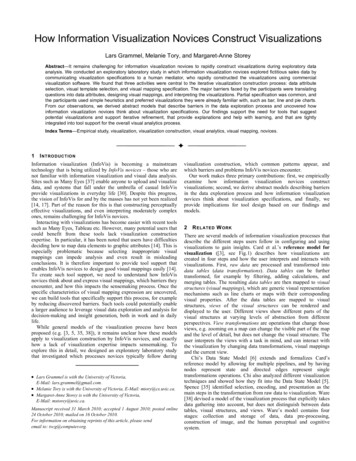
cluster with 152 members and a silhouette value of 0.759 is labeled as developing countries. Inthis era, the most active cited paper discussed developing countries with health security,infrastructure, and livelihood. In the 1st part of the results the author discussed the healthcorrelation with a pathway of production and utility and in 2nd part he mentioned the stockapproach, increasing income, and welfare change the policies for taxation in income along withpublic consumption (Agénor 2008). Also, the 4th largest cluster is labeled as a cross-nationalstudy with 134 members and a silhouette value of 0.895. Considering the most active citationpaper with the clustering of 13671, we discussed the human dimension of greenhouse gas andglobal warming due to deforestation in many developing countries, the leading causes ofdeforestation considering the increasing rate of urbanization. The 5th largest cluster has 133members and a silhouette value of 0.812, and LLR is labeled as an ecology footprint. This is arecently published study, this study was investigated for Malaysia in 2019 using time series datafor 1971-2014. The major findings of this study reveal that globalization does not confirm thepositive association with an ecological footprint, increasing population causes to reduceecological and carbon footprint (Ahmed, Wang et al. 2019). Cao, Chai et al (2020) concludedthat the increase in population significantly reduces the biodiversity and ecosystem. Further seeFigure 2 in order to understand the time trend of reference citations.Figure-2: Reference Cluster Co-citation Visualization Map2.5. Visualization Map of Research JournalsJournal citation is another feature of the citespace to analyze the visualization of researchjournals based on the co-citation by setting node type: cited Journal. For the journal mapVisualization for 2384 records was performed and the top 10 most cited journals were selectedfor easy understanding, shown in Table-3 and Figure-3.8
Figure 3: Journal’s Visualization MapTable 3: Selected the Top-10 Journals by Citation and Cluster FrequencyFrequency Full journal nameAbbreviation PublisherI.F 2018191973 Ecological EconomicsEcol EconElsevier4.2811517 Energy PolicyEnergy Policy Elsevier4.8801177 Energy EconomicsEnergy EconElsevier4.1511174 World DevelopmentWorld DevElsevier3.9051107 Journal of EconomicsJ Environ Econ Elsevier4.175environmental managementManagElsevier10.5561019 Renewable, sustainable energy Renew SustEnerg Revreview1015 The Quarterly Journal ofQ J EconOxford11.77EconomicsAcademic984 The American EconomicAm Econ Rev American11.889ReviewEconomicAssociation923 EnergyEnergyElsevier5.537861 Environment and Development Environ DevCambridge Core1.217EconomicsEconNote: Author visualized this in Citespace v.5.6.R29
Considering the journals’ visualization network from which publishers may identify thecontribution of the journal in the research field of the environmental Kuznets Curve. Table-3declares the most-cited journal in the scientific research of EKC are Ecological Economics,Energy Policy, Energy Economics, World Development, Journal of Economics Environmentaland Management, Renewable and Sustainable Energy Review, Quarterly Journal of Economics,American Economic Review, Energy, and Environmental & Development Economics. Amongthe top 10 journals, 7 journals are published by Elsevier. Ecological Economics has top rankingby citation counts 1973, this journal concerned with increasing and assimilating the acknowledgeof the lines and interplay between ecosystem and economy. Ecological Economics is aninterdisciplinary discipline defined by a series of specific issues or difficulties associated withregulating economic operations in a manner that facilitates human excellently-being, prosperity,and equality. The 2nd one journal ranked in the top 10 listed journals is Energy Policy with acitation counts of 1517. Energy Policy is a peer review international journal, who covers thepaper related to addressing policy implications use in energy consumption, economics, social andenvironmental aspects. Energy Economics journal is known as the third-ranked journal with thecitation counts 1177. This journal is the best journal for energy economics and energy financerelated papers. But it also accepts the papers related to environment and climate, energyconsumption, energy commodities etc. The 4th is a world development journal in cluster 16, withcitation counts of 1174. This journal aims to discover a pathway of improving standards of livingand the human by investigating the problem such as poverty alleviation, finance, andenvironment influence so on. Considering the top 5th and 6th Journal of EnvironmentalEconomics and Management, and Renewable and Sustainable Energy Review, generally in lightview both journal aim is the same to improve economics with a healthy environment. TheJournal of Environmental Economics and Management focuses on natural resources and theenvironment, and, Renewable Sustainable and Energy Review-journal tied together and bringtogether the consumption of energy and the environment. The conclusion results in Figure-3 andTable-3 based on visualization analysis of the last two decades would support both researchersand publishers to make their decisions for the research of EKC and contribute to academicdevelopment and applied methodology in their future perspectives. It is most important toprovide your research best home, therefore it is essential to select the journal very carefully, firstof all, check the journal’s impact factor and citations score, 2nd check the journals abstracting andindexing services, 3rd publisher’s prestige is also important to be considered while selecting thejournal, and online submission with tracking facility (Wijewickrema and Petras 2017; Suiter andSarli 2019).2.6. Country and Institutional Map of VisualizationCountry Visualization is one of the compulsory visualizations to know the most active researchcountry focusing on environment. Selecting node type as a country with a citation threshold of50, we retrieved the visualization for 2384 published studies on the EKC algorithm, shown inFigure-4.10
Figure 4: Countries’ Visualization MapConsidering the citation map of countries, China, the USA, Turkey, Australia, Pakistan, Spain,France, England, Malaysia, and Italy are the most activated countries which are focusing onclimate change research. As China is listed at the top of the country and 2nd listed as the USA.What are the different colors acquires for China and the USA that, China is one track towards thedevelopment, and leads to pollution at the same speed of development. Therefore, China is doingmuch research related to climate change. The USA is an already developed country, seems theUSA has already adopted green technology with economic growth. Considering the researchoutput China is closing the gap with the united states on research spending (Viglione 2020).Australia, Italy, Germany, France, Spain, Japan, Canada, and England focus on the algorithm ofEKC in the earlier stage. Therefore the hot period of each country seems to have different.Furthermore, the research interest related to climate change extended to more countries i.e.Greece, India, Pakistan, and Malaysia. Apart from county visualization, it is also important todiscover which institutes research and publication had the most effect on the EnvironmentalKuznets Curve. We also conducted institution visualization by choosing an institute note type,we got the institutional visualization 2384 reference after 1408 iterations.Table 4: Selected Top 10 Institutions Focusing on EKC by
and Azam 2015; Ozturk, Al-Mulali et al. 2016). Early research confirms the EKC for Algeria by Bouznit and Pablo-Romero (2016) and for Eastern and North African countries Arouri, Youssef et al., (2012), for subsehrah Africa Ozturk and Bilgili., (2015), EKC confirmed by Demissew Beyene and Kotosz (2020).