Transcription
Principles of Data Visualizationfor Exploratory Data AnalysisRenee M. P. TeateUVA SYS 6023Cognitive Systems EngineeringSpring 2015
What is Data Visualization? Quantitative data presented in visual form1– Supports exploration, examination, andcommunication of information1– Common characteristics: computer-supported,interactive, visual representation, abstract,amplifies cognition1 2 objectives:1. Analysis2. Communication2
Why Visualize Data? Humans generally poor at gaining insight from data innumerical form3 Close relationship between vision & cognition1 Allows you to explore and make sense of data, andcommunicate information5 Make patterns, trends, exceptions visible andunderstandable1 Extend capacity of memory – puts in front of eyes what wecouldn’t otherwise hold in mind1 Especially useful when little known about data and analysisgoals are vague6 Can help with hypothesis generation6
Anscombe's quartet"Anscombe's quartet 3" by Schutz via Wikimedia Commons
“One great virtue of good graphical representation is that it canserve to display clearly and effectively a message carried byquantities whose calculation or observation is far from simple.”– John W. Tukey1Is this a“good”datavisualization?(more on this later)"Scatter plot" by UCRL via Wikimedia Commons
Illustration vs VisualizationData Illustration: To impress, inspire awe, make people wonder7– Memorable & engaging vs comprehensible8Data Visualization: To inform7“Wizards Shooting Stars” Washington Post via FlowingData– Explore, Make sense of, and Communicate5– Optimal for: Seeing big pictureRapidly comparing valuesSeeing patterns among valuesComparing patterns acrossmultiple sets5“Buckets” by Peter Beshai via FlowingData
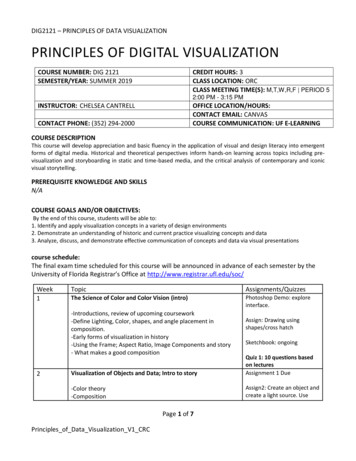
“wind map” - http://hint.fm/wind
WolframAlpha results for“wind 22801”
What is Exploratory Data Analysis (EDA)?“Seeing what the data can tell us” Initial examination of a dataset:–––––Determine data types, summary statisticsAssess your assumptions about the dataStart forming hypothesis about phenomenon you observe9Question everything; Ask “why” oftenExplore outliers10 Supports selection of tools & techniques9 Can provide basis for additional data collection9 Verify what you know, expose what you don’t10
Combining the concepts:Visual Exploratory Data Analysis For this study, I searched for information related tovisuals that:– Are most helpful to analysts during this exploratory stage– Can be generated quickly– Are for analysis, not necessarily communication (i.e. don’thave to follow all “best practices” for accessibility, informationsharing, or publication at this point)– Take advantage of human visual perceptual strengths“Information Seeking Mantra”Overview first, zoom and filter, then details-on-demand11
A look at two BasicData Visualization Types for EDA:Bar Graphs & Line Graphs
Bar GraphsLine Graphs Imply individual values12 Accurately show fixed intervals13Used to plot categorical vs quantitativedata Can be horizontal or vertical– Should always use vertical whencategories represent time periods– Horizontal when long categoricallabels needed Can be used to show distribution asHistogram where categories are bucketsof the same interval sizeDESIGN PRINCIPLES Axis must start at 0 to supportcomparing values, otherwise misleading Distance between bars, width of barshave no quantitative meaning Consider how bars are grouped Use light colors if needed[All unmarked bullets on slide are from reference 4] Imply transitions12Looks continuous13Avoid for nominal comparisons orrankings Can connect points in time series ifintervals consistent Show values, changes, deviations,distributions Can be overlaid on other graph types toshow trends or reference valuesDESIGN PRINCIPLES Aspect Ratio is important Ensure multiple lines are visuallydistinct, can use medium colors Only include points when viewer needsto compare instances across lines Typically linear scale, but Log scaleallows comparison of rates of change Label lines directly if possible instead ofusing legend
Bar GraphsLine Graphs Imply individual values 12 Accurately show fixed intervals13Used to plot categorical vs quantitativedata Can be horizontal or vertical– Should always use vertical whencategories represent time periods– Horizontal when long categoricallabels needed Can be used to show distribution asHistogram where categories are bucketsof the same interval sizeDESIGN PRINCIPLES Axis must start at 0 to supportcomparing values, otherwise misleading Distance between bars, width of barshave no quantitative meaning Consider how bars are grouped Use light colors if needed[All unmarked bullets on slide are from reference 4] Imply transitions 12Looks continuous13Avoid for nominal comparisons orrankings Can connect points in time series ifintervals consistent Show values, changes, deviations,distributions Can be overlaid on other graph types toshow trends or reference valuesDESIGN PRINCIPLES Aspect Ratio is important Ensure multiple lines are visuallydistinct, can use medium colors Only include points when viewer needsto compare instances across lines Typically linear scale, but Log scaleallows comparison of rates of change Label lines directly if possible instead ofusing legend
Example Perception-Based Design PrincipleThe axis on a bar graph must start at 0, because we perceive thedifferences between the bar heights as proportional.(i.e. a bar twice as tall represents a value twice as large) 4
Can you gain much insight from this set of datawithout a visual?ProductProduct 1Product 2Product 3Store A Store B Store C Store D9210174662890527515217-10Let’s create some graphs.
Design principles from“Show Me the Numbers”by Stephen Few4
Another option: Small Multiples(makes a bigger difference with more series)Design principles from “Show Me the Numbers” by Stephen Few4
Design principles from“Show Me the Numbers”by Stephen Few4
Perception ofMultidimensional DataVisualizationsWhat happens when we need to encodemore than 3 attributes on a visual?Like month, sales in dollars, sales person, office location
Bertin’s Image Theory3We can only perceive 3 variables (2 planar and 1 retinal) “efficiently”.Efficient preattentive, without additional eye motion or attention required.PLANARSpatial dimension 1Spatial dimension This means that humans can not effectively visualize 4 dimensions using agraphical representation on a 2-dimensional display (screen or paper).
Bertin’s Image TheorySkipping definitions of the columns in interest of time, but as an example :Shape is neither ordered nor quantitative because it can’t be scaled for magnitude.(Does a triangle represent a larger value than a square?)Bertin says that failure to match the component and the visual “level” (type of scale)is the single major source of error in design of visualizations. 3
2 Correspondences – X location, Y location2 Spatial, 0 Retinal
3 Correspondences – X location, Y location, Shape2 Spatial, 1 Retinal
3 Correspondences – X location, Y location, Color2 Spatial, 1 Retinal
4 Correspondences – X location, Y location, Color and Shape2 Spatial, 2 Retinal (working as 1, encoding same dimension)
Human vision appears to only be able to differentiate 3 dimensions “efficiently”.Perceptually, seemsto be no differencebetween 5D and50D, similarlyincomprehensible144 Correspondences – X location, Y location, Color, Shape2 Spatial, 2 Retinal (encoding different dimensions)
A few notes on color perception Colorblindness an issue in graphs forcommunication, but not as much for analysis(unless you’re building a tool for others) Rainbow scales are not good perceptually– We can visually order small ranges of hue, but notacross entire spectrum Brightness can be used for ordering values– Each “level” must be perceptibly different– Doesn’t linearly map to quantity3 Colors suggested for heatmaps:– Blue to gray to Red1
Note that ROYGBIV Rainbow is notQuantitative or OrderedBrewer palette slides fromPrinciples of InformationVisualization Tutorial –Jessie Kennedy2
Brewer palette slides from Principles of Information Visualization Tutorial – Jessie Kennedy2
� red through “neutral” gray through “low” blue heatmap
Why think about all of this?As an analyst, you should followas many perception-based design principlesas possible when making graphs duringExploratory Data Analysis.Good visualizations can help youmake sense of the data,and spot patterns, trends, and exceptionswith the least effort.You can ensure you will spot thingsthat would otherwise be hiddenor difficult to perceive.
Other Techniques to Consider These are not necessarily “quick and easy” to createusing common software, but there are tools availableto take advantage of other strengths of humanperception during EDA– Scatterplot Matrix or GPLOM A form of “small multiples” Allow many comparisons in one view– Animation We’re good at spotting motion Can help understand changes in multiple dimensionsover time
Scatterplot MatrixAllows comparison ofevery data dimensionvs every other datadimensionSome of thesecomparisons are notideally displayed asscatterplotsImages from GPLOM paper – Im, McGuffin, Leung15
Can split those out intodimensionally-aligned bar chartsImages from GPLOM paper – Im, McGuffin, Leung15
New design: Generalized Plot Matrix (GPLOM)The other charts now show aggregateddata for easier comparison(plot types automatically selected andgrouped together in the display)Scatterplots still showindividual tuples(pairs of data points)Images from GPLOM paper – Im, McGuffin, Leung15
On a larger scaleImages from GPLOM paper – Im, McGuffin, Leung15
GPLOM Tool allows for associative highlightingand filtering for additional explorationThe GPLOM tool was shown to reduce analysis time and was ranked asmore fluid and easier to learn than dimensional stacking in Tableau by test subjects. 15
Animation16 Study showed that animation of 2D dataset whichadded a time dimension through animation:– Was liked by users for data viewing data and helped withchunking, interpreting, expectations, comparisons, andfocusing/filtering– However, not favored for grasping the whole or statisticallyanalyzing the data values– All subjects said it helped them focus on changes in thedata, and they used the viewer controls to changed thespeed of the animation and to go back and forth andrepeatedly view specific segments– Subjects wanted ability to bookmark interesting sectionsfor review
Additional Reading Didn’t have time to get into these, but also see– Article about making visualizations better with GestaltLaws: n-gestalt-laws– The DataViz Catalogue:http://www.datavizcatalogue.com– Scagnostics – scatterplot clustering for highdimensional data:http://www.cs.uic.edu/ tdang/file/ScagExplorer.pdf
References1. Few, S. (2009). Now you see it: Simple visualization techniques for quantitative analysis. Oakland, CA.2. Kennedy, J. (2012). Principles of Information Visualization Tutorial – Part 1 Design Principles. Retrieved April 20, 2015.3. Green, M. (1998). Toward a Perceptual Science of Multidimensional Data Visualization: Bertin and Beyond. RetrievedApril 20, 2015.4. Few, S. (2012). Show me the numbers: Designing tables and graphs to enlighten. Burlingame, CA: Analytics Press.5. Few, S. (2014, May 1). Why Do We Visualize Quantitative Data? Retrieved April 25, 2015.6. Keim, D. (2002). Information visualization and visual data mining. IEEE Transactions on Visualization and ComputerGraphics, 8(1).7. Kosara, R. (2015, March 8). The Value of Illustrating Numbers. Retrieved April 12, 2015, llustrating-numbers8. Perry, C. (2013, October 12). What makes a data visualization memorable? Retrieved April 12, 2015, makes-data-visualization-memorable9. Exploratory data analysis. (n.d.). Retrieved April 26, 2015, from http://en.wikipedia.org/wiki/Exploratory data analysis10.Ros, I., & Hyland, A. (2013, April 9). When Creating Visualizations, Question Everything. Retrieved April 21, 2015, ations-question-everything11.Craft, B., & Cairns, P. (2005). Beyond Guidelines: What Can We Learn from the Visual Information Seeking Mantra?Retrieved April 19, 201512.Kosara, R. (2013, April 11). The Science of What We Do (and Don't) Know About Data Visualization. Retrieved April 21,2015, from and-dont-know-about-data-visualization/13.Wildbur, P. (1989). Information graphics: A survey of typographic, diagrammatic, and cartographic communication. NewYork: Van Nostrand Reinhold.14.De Oliveira, M., & Levkowitz, H. (2003). From visual data exploration to visual data mining: A survey. IEEE Transactions onVisualization and Computer Graphics, 9(3), 378-394. Retrieved April 26, 2015.15.Im, J., Mcguffin, M., & Leung, R. (2013). GPLOM: The Generalized Plot Matrix for Visualizing MultidimensionalMultivariate Data. IEEE Transactions on Visualization and Computer Graphics, 19(12). Retrieved April 25, 2015.16.Nakakoji, K., Takashima, A., & Yamamoto, Y. (2001). Cognitive Effects of Animated Visualization in Exploratory Visual DataAnalysis. Information Visualization.
Questions?
Now you see it: Simple visualization techniques for quantitative analysis. Oakland, CA. 2. Kennedy, J. (2012). Principles of Information Visualization Tutorial - Part 1 Design Principles. Retrieved April 20, 2015. 3. Green, M. (1998). Toward a Perceptual Science of Multidimensional Data Visualization: Bertin and Beyond. Retrieved April 20 .