Transcription
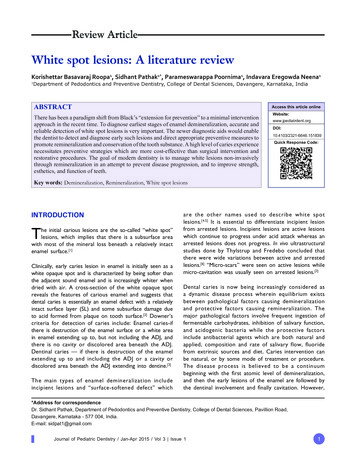
Zhao et al. BMC Cancer(2019) SEARCH ARTICLEOpen AccessWhole lesion histogram analysis ofapparent diffusion coefficients on MRIpredicts disease-free survival in locallyadvanced squamous cell cervical cancerafter radical chemo-radiotherapyBo Zhao, Kun Cao*†, Xiao-Ting Li, Hai-Tao Zhu and Ying-Shi Sun*†AbstractBackground: The aim was to investigate the prognostic value of MR apparent diffusion coefficients (ADC) usinghistogram analysis (HA) in predicting disease-free survival (DFS) of cervical cancer after chemo-radiation therapy.Methods: We retrospectively analyzed 103 women with pathologically proven squamous cell uterine cancer whoreceived chemo-radiation therapy between 2009 and 2013. All patients were followed up for more than 2 years.Pre-treatment MR images were retrieved and imported for HA using an in-house developed software programbased on 3D Slicer. Regions of interest of whole tumors were drawn manually on DWI with reference to T2WI. HAfeatures (mean, max, min, 50, 10, 90%, kurtosis, and skewness) were extracted from apparent diffusion coefficient(ADC) maps and compared between the recurrence and non-recurrence groups after the 2-year follow-up.Univariate and multivariate Cox regression analysis was used to correlate ADC HA features and relevant clinicalvariables (age, grade, maximal diameter of tumor, FIGO stage, SCC-Ag) with DFS.Results: One hundred three patients with stage IB-IV cervical cancers were followed up for 2.0–94.6 months(median 48.9 months). Twenty patients developed recurrence within 2 years. In the recurrence group, the min(P 0.001) and 10% (P 0.048) ADC values were significantly lower than those of the non-recurrence group.Univariate and multivariate Cox regression analysis revealed that ADCmin (P 0.006, HR 0.110) was significantlycorrelated with DFS.Conclusion: Pre-treatment volumetric ADCmin in histogram analysis is an independent factor that is correlated withDFS in cervical cancer patients treated with chemo-radiation therapy.Keywords: Uterine cervical neoplasm, Diffusion-weighted MRI, SurvivalBackgroundUterine cervical cancer is one of the most commonmalignancies in the female gynecologic system. Due toextremely unbalanced economical and healthcare levelsacross the world, the incidence and prognosis of cervicalcancer vary dramatically among different countries and* Correspondence: kun-cao@hotmail.com; sys27@163.com†Kun Cao and Ying-Shi Sun contributed equally to this work.Department of Radiology, Key Laboratory of Carcinogenesis and TranslationalResearch, Ministry of Education, Peking University Cancer Hospital andInstitute, No. 52 Fucheng Rd, Haidian District, Beijing 100142, Chinaareas. Most cervical cancer patients in China are at advanced stages when diagnosed. According to the FIGOstage system and NCCN guidelines, locally advancedcervical carcinoma (LACC) usually refers to stage IB2 toIVA cancers, and concurrent chemoradiotherapy (CCRT)is suggested as the standard treatment strategy for suchpatients [1]. The current concept of cancer treatment callsfor personalized treatment in order for the patient tobenefit the most and to maximally increase survival time.Among the factors that are related to the survival rateof cervical cancer, tumor size is the most well-accepted The Author(s). 2019 Open Access This article is distributed under the terms of the Creative Commons Attribution 4.0International License (http://creativecommons.org/licenses/by/4.0/), which permits unrestricted use, distribution, andreproduction in any medium, provided you give appropriate credit to the original author(s) and the source, provide a link tothe Creative Commons license, and indicate if changes were made. The Creative Commons Public Domain Dedication o/1.0/) applies to the data made available in this article, unless otherwise stated.
Zhao et al. BMC Cancer(2019) 19:1115one; it has already been included as a key factor in theFIGO staging system. Other risk factors include positivelymph nodes, parametrial extension, positive surgicalmargins, lymph vascular space invasion, and depth ofinvasion [2], but most of this information can only beacquired by operational pathology, which is impossiblefor LACC patients subjected to radical radiation. Imaging has the ability to provide more information in vivobefore treatment, so much research has been carried outon the selection of imaging parameters, such as enhancing patterns, to predict the survival rate of cervicalcancer. Comparing with dynamic contrast enhanced parameters, DWI has obvious advantages, such as nonuseof contrast radium, relatively stable image quality, and auniversally accepted quantitative index, the apparent diffusion coefficient (ADC).The results regarding ADC values in predicting treatment effects vary greatly. Some studies showed lowADC values are related with recurrence and a poor survival rate [3, 4], while some found low ADC values inpatients with good treatment responses [5, 6]. Otherstudies concluded that the available evidence is insufficient to use pre-treatment ADC values to predict treatment efficacy [7–9]. One of the main disadvantages ofADC measurements is that the location and the sizes ofregions of interests (ROIs) may affect the values, whichis a common practical problem in almost all parametermeasurements. Therefore, the application of histogramanalysis (HA) is validated, which generates more indicesto describe the distribution of each voxel within ROIs,instead of a single mean value. Studies on HA did achieveinspiring results in predicting cervical cancer survivalrates, but large differences exist between studies. One ofthe possible reasons may still be the choice of ROIs, assome studies used maximum single slices instead of wholetumor slices. We suspected that whole lesion ROIs areable to reflect lesion characteristics to the greatest extent,while small ROIs or single slice ROIs all have the possibility of selection bias. Therefore, in this study, we use wholelesion ROIs and HA to assess the possibility to use ADCvalues to predict disease-free survival (DFS) of cervicalcancer for a follow-up period of 5 years.MethodsPatientsInformed consents were waived by the institutionalEthics Committee for this retrospective study. All patients with pathologically diagnosed squamous cell uterine cervical cancer in our institute from 2009 to 2013were reviewed, and 152 consecutive patients were foundto meet the following inclusion criteria: (a) the tumorwas in stage IB to IVA, (b) the patient received concurrent chemoradiation in our radiation department, (c)pre-treatment pelvic MR was performed in our hospitalPage 2 of 7and was within 30 days before treatment started, and (d)valid follow-up information could be acquired from themedical records. After retrieving MR images and clinicalmedical records, 49 patients were excluded, including 32with sagittal instead of axial DWI, 8 with poor qualityDWI images, 5 with a tumor with a long diameter of lessthan 1 cm, 1 with small cell lung cancer, and 3 with afollow-up time of less than 2 years. We recorded therelevant clinical information, including age, grade, FIGOstage, and serum levels of squamous cell carcinoma antigen (SCC-Ag). In total, 103 subjects were enrolled in thestudy. The follow-up time was defined as from the dateof first radiation to either the recurrence date or the lastvisit date with no events. The median follow-up time forthe whole cohort was 48.9 months (range 2.0–94.6months). Among them, 55 patients free of recurrence ormetastasis at the end of the follow-up period (medianfollow-up time 59.7 months).Treatment and outcome evaluationAll patients underwent standard radiotherapy in combination with concurrent cisplatin-containing chemotherapy.Radiotherapy consisted of external beam radiation (40–50.4Gy in 1.8-2Gy daily fractions using 10-MV photons)and intracavitary brachytherapy (30–35 Gy to point A by5 Gy fractions in 3 weeks). Six courses of cisplatin-basedchemotherapy (40 mg/m2 dosage) were delivered weeklyat the same time with radiotherapy.The primary outcome was DFS, defined as the periodof time from the first radiation treatment to the date ofdeveloping any recurrence (local or distant relapse, metastasis). Patients with persistent disease were consideredto have relapsed on the first day of completing radiationtherapy. Recurrence data were taken from the medicalrecords, with evidence based on the diagnosis by thetreating physician and imaging (18F-fluorodeoxyglucose[18F-FDG] positron emission tomography/computedtomography [PET/CT], MRI, CT) or biopsy results. Recurrence group and non-recurrence group were dividedbased on DFS 2 year and DFS 2 years.MR imagingAll examinations were performed on 1.5-T MR scanners(GE optima 1.5 T MR360 and GE signa 1.5 T EchoSpeedPlus) with four-channel or eight-channel torso phasedarray body coil. The scanning range was set to cover theentire pelvis from the level of the anterior superior iliacspine to the inferior level of the symphysis pubis. All patients were required to fast at least 2 h before the examination. After excluding the contradictions, patients wereasked to inject 5 ml of anisodamine about 20–30 min before the examination to reduce bowel motion artifacts.MR sequences included T1WI, T2WI, and DWI. Thestandard MR scan protocol was kept identical each time
Zhao et al. BMC Cancer(2019) 19:1115and was as follows: (a) axial T1WI: fast spin-echo (FSE)sequence, repetition time (TR) 726 ms, echo time(TE) 12 ms, matrix size 288 256, field of view(FOV) 26–36 cm, slice thickness/intersection gap 8/1mm, number of excitations (NEX) 1; (b) axial T2WI:FSE-XL, TR 5182 ms, TE 80 ms, matrix size 352 320, FOV 26–30 cm, slice thickness/intersection gap 8/1 mm, NEX 2; (c) sagittal T2WI: FSE-XL, TR 4138ms, TE 102 ms, matrix size 320 288, FOV 24–36cm, slice thickness/intersection gap 5/1 mm, NEX 4;(d) axial DWI: single-shot echo-planar imaging sequence, TR 3500 ms, TE minimum time, matrixsize 128 128, FOV 36 cm, slice thickness/intersection gap 8/1 mm, NEX 4, b-value 0 and 1000 s/mm2. All slice lines of DWI were copied from the axialT2WI to make sure the images were all at the same tableposition.Page 3 of 7Axial DWI images were loaded into a post-processingworkstation (GE AW 4.6) and parametric ADC mapswere generated automatically in the FUNCTOOL program. Parametric maps along with DWI and ROIs wereall transferred to house-made radiomics software basedon the 3D Slicer platform. ROIs were registered to theparametric maps. Histograms and corresponding ADCparameters values were automatically generated by thesoftware. Excel software was used to sum up the parameters values of ROI at all slices of the tumor respectivelyand then calculate the average value. The HA programin the software was generated the following 8 parametersfor ADC values: mean, median, maximum, minimum,10th percentile, 90th percentile, kurtosis, and skewness.The maximal diameter of tumor (MDT) was calculatedon two-dimensional axial ADC metrics.Statistical analysesImage analysisAll images were retrieved from local PACS (Huahai,China). By putting axial T2WI and DWI images side byside and also referring to the sagittal T2WI, ROIs weredrawn manually slice by slice on DWI images along theedge of the lesions in order to cover as much tumor areaas possible without excluding cystic, hemorrhagic ornecrotic areas (Fig. 1). ROIs were initially drawn by ajunior radiology resident (Z.B.) with 3 years’ experiencein MR reading and then reviewed and corrected by asenior attending radiologist (C.K.) with more than 10years’ experience in gynecologic imaging. Both radiologists were blinded to patients’ outcomes during the datacollection period. Whole lesion ROIs were thus achievedto acquire volumetric data of tumors.Continuous variables are presented as mean SD.Categorical variables are presented as counts and percentages. The clinical variables and ADC parametervalues were compared between the recurrence and nonrecurrence groups using the Wilcoxon rank-sum test orthe chi-square test. Univariate and multivariate Cox regression analyses were used to evaluate the potentialprognostic value of ADC parameters and relevant clinical variables (i.e., age, MDT, grade, FIGO stage, SCCAg) for DFS. For the multivariate analysis, parameterswere selected by using stepwise selection and by considering the following covariates with a P-value less than0.3 in the univariate analysis. The receiver operatingcharacteristic (ROC) curve was drawn to determine thecutoff value of the parameters using the maximumFig. 1 Manual segmentation of ROIs in cervical lesion and schematic diagram of parameters. a–c Referring to T2WI and DWI, ROIs were drawnmanually slice by slice on DWI images along the edge of the lesions in order to cover as much tumor area as possible without excluding cysticor necrotic areas. d The same ROIs were registered to ADC maps
Zhao et al. BMC Cancer(2019) 19:1115Page 4 of 7Youden index. The Kaplan–Meier survival curve wasdrawn and log-rank estimates were obtained. All statistical analyses were performed using SPSS 22.0. All reported values are two-tailed, and P-values 0.05 wereconsidered statistically significant.ResultsClinical characteristics are listed in Table 1. All patientswere followed up for more than 2 years, the medianfollow-up period was 59.7 months (range, 25.5–94.6months) for surviving patients. Patient characteristicsare listed in Table 1. Of the 103 women analyzed, tumorrecurrence was observed in 29 cases (28.2%) at the endof the follow-up period; 11 in the first year, 9 in the second year, and 9 patients suffered from recurrence aftermore than 2 years of follow-up. Of the 29 patients withtumor recurrence, 3 had persistent cervical cancer, 15patients showed distant metastasis, and 11 patientsshowed local relapse in the pelvic cavity. The 1-year and2-year DFS rates were 89.3 and 80.5%, respectively.Patients characteristics in the recurrence and nonrecurrence groups are presented in Table 2. Pretreatment ADCmin and ADC10% were 0.588 (0.163–5.351)( 10 3 mm2/s) and 0.776 (0.543–8.134) ( 10 3 mm2/s)in the recurrence and non-recurrence groups, respectively.The values of ADCmin (P 0.001) and ADC10% (P 0.048) were significantly lower in the recurrence groupthan in the non-recurrence group. In the univariate analysis, age, ADCmin, ADC10%, and ADCskewness were associated with DFS (Table 3). In the multivariate Coxanalysis, ADCmin of the tumor was the most significantTable 1 Patient and Tumor characteristicsCharacteristicValuePatient number103aAge (years)51 (27–78)HistologySquamous cell carcinomaTable 2 Characteristics of patients and values of ADC histogramparameters in recurrence (DFS 2 years) and non-recurrence(DFS 2 years) groupsParameterNon-recurrencen 83 (80.6%)Recurrencen 20 (19.4%)P-valueAge (years)50.4 9.251.3 11.40.9730.075GradeWell/moderate48 (46.6%)11(10.7%)Poor35 (34.0%)9(8.7%)MTD42.9 16.048.4 13.1FIGO stage0.1150.996IB/IIA29(28.2%)7(6.8%)IIB/III/IV54 (52.4%)13(12.6%)SCC-Ag9.7 14.411.3 15.20.957Median ( 10 3 mm2/s)1.094 1.1170.912 0.5370.443Max ( 10 3 mm2/s)2.202 1.6642.144 0.3280.352Mean ( 10 3 mm2/s)1.056 0.1561.013 0.1190.372Min ( 10 3 mm2/s)0.648 0.5700.356 0.3830.001*10% ( 10 3 mm2/s)0.900 0.8170.757 0.1730.048*90% ( 10 3 mm2/s)1.437 1.4701.305 0.2190.900Kurtosis5.575 .2544.910 2.5410.286Skewness1.184 0.6020.912 0.5370.067Note: Data are presented as mean SD, with Wilcoxon rank-sum test. Data arepresented number (percentages), with chi-square test. *P-value 0.05predictor for patient DFS (P 0.006, HR 0.110), wherea higher ADCmin was significantly associated with poorDFS (Table 3).ROC analysis of tumor recurrence within 2 yearsshowed that the area under the curve for ADCmin was0.738 (95% CI, 0.608–0.868; P 0.001) (Fig. 2). The cutoff value of ADCmin was 0.482 10 3 mm2/sec, with asensitivity of 84.3% and a specificity of 60%. The DFS forpatients with ADCmin 0.482 mm2/sec was significantlyhigher than that of patients with ADCmin 0.482 mm2/sec (P 0.002, long-rank test) (Fig. 3).FIGO stageIB18 (17.5%)IIA/B16/48 (15.5%/46.6%)IIIA/B6/13 (5.9%/12.6%)IV2 (1.9%)Grade of differentiationWell/moderate59 (57.3%)Poor44 (42.7%)MDT (mm)45.1 (14.8–90.6)SCC-Ag (ng/ml)4.0 (0.4–81.9)Follow-up time (months)48.9 (2.0–94.6)Note: Data are number and data in parentheses are percentages; aData aremedian and data in parentheses are rang; FIGO International Federation ofGynecology and Obstetrics, MDT Maximal diameter of the tumor, SCC-AgSquamous cell carcinoma antigenDiscussionAlthough CCRT is an optimal therapy for LACC withappreciable outcome, treatment for relapse of tumorafterwards remains tough. Thus we assumed it will be ofclinical significance to find high-risk patients who subject to recurrence within short time, and who mightbenefit from additional or novel therapies, such as targeted agents with chemotherapy [10], or adjuvant orconsolidation chemotherapy after CCRT [11]. Therefore,functional MR sequences and imaging processing techniques been investigated for this purpose.In our study, ADCmin and ADC10% were significantlydifferent between the recurrence and non-recurrencegroups after 2 years of follow-up, while only ADCmin wasfound to be correlated with DFS of cervical cancers by
Zhao et al. BMC Cancer(2019) 19:1115Page 5 of 7Table 3 Univariate and multivariate Cox regression analysis of clinical factors and ADC histogram parameters for predicting diseasefree survivalParameterUnivariate analysisP-valueMultivariate analysisP-valueAge (years)1.026 (0.987–1.066)0.194*1.004 31 (1.242–6.005)0.412MTD1.004 (0.981–1.027)0.764FIGO stageIB/IIA1.0IIB/III/IV1.256 (0.572–2.760)0.570SCC-Ag1.004 (0.982–1.027)0.716Median ( 10 3 mm2/s)0.435 (0.037–5.075)0.507Max ( 10 3 mm2/s)0.918 (0.613–1.373)0.676Mean ( 10 3 mm2/s)0.397 (0.032–4.968)0.474Min ( 10 3 mm2/s)0.171 (0.063–0.463)0.001#0.110 (0.023–0.538)0.006#10% ( 10 3 mm2/s)0.106 (0.006–1.933)0.130*1.803 (0.069–46.817)0.72390% ( 10 3 mm2/s)0.793 (0.287–2.193)0.655Kurtosis0.950 (0.821–0.099)0.489Skewness0.657 (0.350–1.233)0.188*0.724 (0.368–1.463)0.350*P 0.3; #P 0.05Hazard ratio (HR) data are reported per one-unit increaseData in parentheses are 95% confidence intervalsFig. 2 ROC curve of ADCmin value for predicting non-recurrencewithin 2 years. The cutoff value of ADCmin was 0.482 10 3 mm2/sec, with a sensitivity of 84.3% and a specificity of 60%. The areaunder the ROC cure was 0.738 (95% CI, 0.608–0.868; P 0.001)Fig. 3 Kaplan–Meier curve for disease-free survival with ADCminvalue. A statistically significant difference in DFS is observedbetween patients with ADCmin 0.482 and ADCmin 0.482 (P 0.002, long-rank test)
Zhao et al. BMC Cancer(2019) 19:1115multivariate regression analysis. ADC10% and skewnesswere not associated with tumor recurrence in the multivariate analysis.In previous studies, ADC values were found to belower in cervical squamous cell carcinoma comparedwith adenocarcinoma, even when using HA-derivedmean ADCs [3, 12] and minimal ADCs [13, 14]. Therefore, we only included squamous cell cancers in thisstudy, as it is the most common histologic type of cervical cancer and also to exclude possible interferencedue to different pathology types. ADC values of malignanttumors are commonly lower than those of normal tissues,as is also the case in uterine cervical cancer [3, 15]. However, the usefulness of mean ADC values in predictingtherapeutic effects differs between studies, possibly due tointer-observer variations in ROI selection and size. Theintroduction of HA, by further dissecting and defining thedistributions of all voxels involved, helps to provide moreinformation for tumor characterization. Theoretically,only ROIs that cover whole lesions are able to comprehensively reflect tumor characteristics. Even necrosis mayrepresent one of the intrinsic features of a tumor, so wethink it is not necessary to exclude the possible necroticareas, as was usually done in previous studies when usingsmall ROIs.With the method of HA, lower ADC values were oftenfound to be related to more aggressive and poor prognosistumors, such as poorly differentiated stage I cervical cancers, compared with well/moderately differentiated ones[16]. In a study by Erbay et al. [17], using HA to achieveseveral percentile ADC values, they found ADC50%,ADC75%, ADC90%, and ADC95% were lower in patientswith tumor recurrence than in those without recurrence.Unfortunately, the percentiles they used were all above50%. Similar results were also found in a study by Gladwish et al., in which, among different percentiles of ADCvalues that were higher than 50%, the ADC95% andnADC95% (normalized to urine) were found to be independent protective factors associated with DFS [18]. Another study showed ADC75% to be a risk factor for tumorrecurrence [19]. In our study, high percentiles do notseem to be so significant among all histogram parameters,while the lower ADC values (ADCmin and ADC10%) exhibit a difference between the recurrence and nonrecurrence groups. Several studies have also shown thatADC10% is significantly associated with event-free survival[20] and DFS [21]. However, in our study, low ADC10%values may be correlated with recurrence within 2 years,yet they are not associated with DFS in our Cox regressionanalysis; ADCmin is an independent risk factor related toDFS using Cox regression analysis.Some studies also found that ADCmin is a valuable factor that reflects tumor aggressiveness. The ADCmin ofstage T2b-T4 cervical cancers was significantly lowerPage 6 of 7than that of stage T1 to T2a cancers, and it was evenlower in patients with lymph node metastasis or distantmetastasis [22]. In one histopathologic study, theADCmin value of cervical cancer exhibited a negative relationship with Ki-67, the index of cellular proliferation(r 0.56, CI 0.68 0.43, [23]). A meta-analysisamong various kinds of tumors also found ADCmin hada stronger relationship with Ki-67 compared withADCmean [24]. In a study on malignant astrocytomas,ADCmin was found to be negatively correlated with theKi-67 labeling index, which indicates poor prognosis,and the ADCmin value was found to be significantlyhigher in the stable group than in the progressing groupafter treatment [25]. Such results confirm the possibleapplication of ADCmin in predicting survival rates;higher ADCmin values may be related to longer DFS, asis also shown in the present study. However, contradictions can also be found in the literature. For example, ina study by Marconi et al. [26], ADCmin was found to bean independent factor related with DFS as well, but itwas a risk factor instead of a protective factor. Considering the fact that HA can also be affected by the coverageextent of ROIs, studies with whole tumor ROIs or singleslice ROIs may lead to different results. As stated above,we assumed that whole lesion ROIs can reflect intrinsictumor heterogeneity to the highest extent, so they aremore reliable. The different b-values used for DWI scanning form another factor that may affect the results, because there is no single b-value that is uniformly usedamong studies.ConclusionsThe volumetric ADCmin in HA has the possibility to actas an independent risk factor that is correlated with DFSin cervical cancer patients treated with chemo-radiationtherapy. Pre-treatment ADC histogram analysis mayidentify higher risk of recurrence patients, which willenable greater personalization of cancer care eithervia a priori treatment decisions or subsequent followup regimens.AbbreviationsADC: Apparent diffusion coefficient; CCRT: Concurrent chemoradiotherapy;DWI: Diffusion weighted images; FIGO: International Federation ofGynecology and Obstetrics; HA: Histogram analysis; LACC: Locally advancedcervical carcinoma; MDT: Maximal diameter of tumor; NCCN: NationalComprehensive Cancer Network; OS: Overall survival; ROI: Regions ofinterests; ROC: Receiver operating characteristicAcknowledgementsWe thank Hui Liu, Ph.D. for integrating and modifying the radiomicssoftware. Also, we thank LetPub (www.letpub.com) for its linguisticassistance during the preparation of this manuscript.Authors’ contributionsKC and YSS contributed to the conception of the study. XTL performed thedata analyses. HTZ contributed significantly to process data. BZ wrote themanuscript. All of the authors read and approved the final manuscript.
Zhao et al. BMC Cancer(2019) 19:1115FundingThis study was funded by Natural Science Foundation of China (grantnumber 81402167), Beijing Municipal Administration of Hospitals ClinicalMedicine Development of Special Funding Support(No.ZYLX201803), Beijingmillion Talents Project(No.2017A13)and National Key Research andDevelopment Plan(2017YFC1309101, 2017YFC1309104). The funding bodyhad no role in the design of the study and collection, analysis, andinterpretation of data and in writing the manuscript.Availability of data and materialsThe datasets used and analyzed during the current study are available fromthe corresponding author on reasonable request.Ethics approval and consent to participateThe Clinical Research Ethics Committee of Peking University Cancer Hospitaland Institute approved the research and the written informed consent waswaived because this was a retrospective and observational study.Consent for publicationNot applicable.Competing interestsThe authors declare that they have no competing interests.Received: 19 July 2019 Accepted: 7 November 2019References1. NCCN Clinical Practice Guidelines in Oncology - Cervical Cancer. In.; 2017.2. Biewenga P, van der Velden J, Mol BW, Stalpers LJ, Schilthuis MS, van derSteeg JW, et al. Prognostic model for survival in patients with early stagecervical cancer. Cancer. 2011;117(4):768–76.3. Kuang F, Ren J, Zhong Q, Liyuan F, Huan Y, Chen Z. The value of apparentdiffusion coefficient in the assessment of cervical cancer. Eur Radiol. 2013;23(4):1050–8.4. Micco M, Vargas HA, Burger IA, Kollmeier MA, Goldman DA, Park KJ, et al.Combined pre-treatment MRI and 18F-FDG PET/CT parameters asprognostic biomarkers in patients with cervical cancer. Eur J Radiol. 2014;83(7):1169–76.5. Liu Y, Bai R, Sun H, Liu H, Zhao X, Li Y. Diffusion-weighted imaging inpredicting and monitoring the response of uterine cervical cancer tocombined chemoradiation. Clin Radiol. 2009;64(11):1067–74.6. Himoto Y, Fujimoto K, Kido A, Baba T, Tanaka S, Morisawa N, et al.Pretreatment mean apparent diffusion coefficient is significantly correlatedwith event-free survival in patients with International Federation ofGynecology and Obstetrics Stage Ib to IIIb cervical cancer. Int J GynecolCancer. 2015;25(6):1079–85.7. Zhang Y, Chen JY, Xie CM, Mo YX, Liu XW, Liu Y, et al. Diffusion-weightedmagnetic resonance imaging for prediction of response of advanced cervicalcancer to chemoradiation. J Comput Assist Tomogr. 2011;35(1):102–7.8. Rizzo S, Summers P, Raimondi S, Belmonte M, Maniglio M, Landoni F, et al.Diffusion-weighted MR imaging in assessing cervical tumour response tononsurgical therapy. Radiol Med. 2011;116(5):766–80.9. Harry VN, Gilbert FJ, Parkin DE. Predicting the response of advanced cervicaland ovarian tumors to therapy. Obstet Gynecol Surv. 2009;64(8):548–60.10. Duenas-Gonzalez A, Zarba JJ, Patel F, Alcedo JC, Beslija S, Casanova L, et al.Phase III, open-label, randomized study comparing concurrent gemcitabineplus cisplatin and radiation followed by adjuvant gemcitabine and cisplatinversus concurrent cisplatin and radiation in patients with stage IIB to IVAcarcinoma of the cervix. J Clin Oncol. 2011;29(13):1678–85.11. Yavas G, Yavas C, Sen E, Oner I, Celik C, Ata O. Adjuvant carboplatin andpaclitaxel after concurrent cisplatin and radiotherapy in patients with locallyadvanced cervical cancer. Int J Gynecol Cancer. 2019;29(1):42–7.12. Guan Y, Shi H, Chen Y, Liu S, Li W, Jiang Z, et al. Whole-lesion histogramanalysis of apparent diffusion coefficient for the assessment of cervicalcancer. J Comput Assist Tomogr. 2016;40(2):212–7.13. Xue H, Ren C, Yang J, Sun Z, Li S, Jin Z, et al. Histogram analysis of apparentdiffusion coefficient for the assessment of local aggressiveness of cervicalcancer. Arch Gynecol Obstet. 2014;290(2):341–8.Page 7 of 714. Liu Y, Ye Z, Sun H, Bai R. Clinical application of diffusion-weighted magneticresonance imaging in uterine cervical cancer. Int J Gynecol Cancer. 2015;25(6):1073–8.15. Chen J, Zhang Y, Liang B, Yang Z. The utility of diffusion-weighted MRimaging in cervical cancer. Eur J Radiol. 2010;74(3):e101–6.16. Downey K, Riches SF, Morgan VA, Giles SL, Attygalle AD, Ind TE, et al.Relationship between imaging biomarkers of stage I cervical cancer andpoor-prognosis histologic features: quantitative histogram analysis ofdiffusion-weighted MR images. AJR Am J Roentgenol. 2013;200(2):314–20.17. Erbay G, Onal C, Karadeli E, Guler OC, Arica S, Koc Z. Predicting tumorrecurrence in patients with cervical carcinoma treated with definitivechemoradiotherapy: value of quantitative histogram analysis on diffusionweighted MR images. Acta Radiol. 2017;58(4):481–8.18. Gladwish A, Milosevic M, Fyles A, Xie J, Halankar J, Metser U, et al.Association of Apparent Diffusion Coefficient with disease recurrence inpatients with locally advanced cervical cancer treated with radicalchemotherapy and radiation therapy. Radiology. 2016;279(1):158–66.19. Heo SH, Shin SS, Kim JW, Lim HS, Jeong YY, Kang WD, et al. Pre-treatmentdiffusion-weighted MR imaging for predicting tumor recurrence in uterinecervical cancer treated with concurrent chemoradiation: value of histogramanalysis of apparent diffusion coefficients. Korean J Radiol. 2013;14(4):616–25.20. Ueno Y, Lisbona R, Tamada T, Alaref A, Sugimura K, Reinhold C. Comparisonof FD
histogram analysis (HA) in predicting disease-free survival (DFS) of cervical cancer after chemo-radiation therapy. Methods: We retrospectively analyzed 103 women with pathologically proven squamous cell uterine cancer who received chemo-radiation therapy between 2009 and 2013. All patients were followed up for more than 2years.