Transcription
(2022) 13:134Huang et al. Insights into RIGINAL ARTICLEInsights into ImagingOpen AccessEnhanced CT‑based radiomicspredicts pathological complete responseafter neoadjuvant chemotherapy for advancedadenocarcinoma of the esophagogastricjunction: a two‑center studyWenpeng Huang1†, Liming Li1†, Siyun Liu2, Yunjin Chen1, Chenchen Liu1, Yijing Han1, Fang Wang1,Pengchao Zhan1, Huiping Zhao1, Jing Li3 and Jianbo Gao1*AbstractPurpose: This study aimed to develop and validate CT-based models to predict pathological complete response(pCR) after neoadjuvant chemotherapy (NAC) for advanced adenocarcinoma of the esophagogastric junction (AEG).Methods: Pre-NAC clinical and imaging data of AEG patients who underwent surgical resection after preoperativeNAC at two centers were retrospectively collected from November 2014 to September 2020. The dataset includedtraining (n 60) and external validation groups (n 32). Three models, including CT-based radiomics, clinical andradiomics–clinical combined models, were established to differentiate pCR (tumor regression grade (TRG) grade0) and nonpCR (TRG grade 1–3) patients. For the radiomics model, tumor-region-based radiomics features in thearterial and venous phases were extracted and selected. The naïve Bayes classifier was used to establish arterial- andvenous-phase radiomics models. The selected candidate clinical factors were used to establish a clinical model, whichwas further incorporated into the radiomics–clinical combined model. ROC analysis, calibration and decision curveswere used to assess the model performance.Results: For the radiomics model, the AUC values obtained using the venous data were higher than those obtainedusing the arterial data (training: 0.751 vs. 0.736; validation: 0.768 vs. 0.750). Borrmann typing, tumor thickness anddegree of differentiation were utilized to establish the clinical model (AUC-training: 0.753; AUC-validation: 0.848). Thecombination of arterial- and venous-phase radiomics and clinical factors further improved the discriminatory performance of the model (AUC-training: 0.838; AUC-validation: 0.902). The decision curve reflects the higher net benefit ofthe combined model.Conclusion: The combination of CT imaging and clinical factors pre-NAC for advanced AEG could help stratifypotential responsiveness to NAC.†Wenpeng Huang and Liming Li contributed equally to this work*Correspondence: jianbogaochina@163.com1Department of Radiology, The First Affiliated Hospital of ZhengzhouUniversity, Zhengzhou, ChinaFull list of author information is available at the end of the article The Author(s) 2022. Open Access This article is licensed under a Creative Commons Attribution 4.0 International License, whichpermits use, sharing, adaptation, distribution and reproduction in any medium or format, as long as you give appropriate credit to theoriginal author(s) and the source, provide a link to the Creative Commons licence, and indicate if changes were made. The images orother third party material in this article are included in the article’s Creative Commons licence, unless indicated otherwise in a credit lineto the material. If material is not included in the article’s Creative Commons licence and your intended use is not permitted by statutoryregulation or exceeds the permitted use, you will need to obtain permission directly from the copyright holder. To view a copy of thislicence, visit http:// creat iveco mmons. org/ licen ses/ by/4. 0/.
Huang et al. Insights into Imaging(2022) 13:134Page 2 of 11Keywords: Esophagogastric junction, Adenocarcinoma, X-ray computed tomography, Neoadjuvant therapy,Response evaluationKey points Radiomics method can predict that AEG patients canachieve pCR after NAC. The combination of radiomics and clinical factorscan improve the predicting performance. Radiomics–clinical model can stratify patientsaccording to potential responsiveness to NAC. Radiomics–clinical model can help clinicians todevelop individualized and precise treatment plans.IntroductionThe incidence of adenocarcinoma of the esophagogastric junction (AEG) has been increasing in recent years[1]. AEG is defined as adenocarcinoma with a tumorcenter located within 5 cm above or below the anatomical esophagogastric junction (EGJ) that crosses ortouches the EGJ. Radical surgical resection and complete lymph node dissection are the basis of treatment,but most patients with AEG are already in the advancedstage when diagnosed, and surgical resection alone has ahigh rate of local recurrence and poor survival [2]. Neoadjuvant chemotherapy (NAC) followed by radical surgery has become a recommended treatment modalityfor advanced gastric cancer patients. NAC can reducetumor load, lower tumor stage, improve the rate of radical resection and ultimately may prolong the survival ofAEG patients [3–5]. However, the prognostic improvement that is achieved using NAC is largely dependenton the pathological response of the lesion after chemotherapy. The histological tumor regression grade (TRG)is an objective indicator used to evaluate the efficacy oftherapy for AEG patients when cancer cells in the lesionare absent or when only a small number remain [6, 7].In patients with a mild pathological response or poorresponse, NAC not only does not benefit the patient, butthere is also a risk for toxic effects during chemotherapyand tumor progression, and delayed surgery may result ina decreased rate of radical resection and increased surgical complication rates [3, 8–11]. The current evaluationof the efficacy of NAC is based on the response evaluation criteria in solid tumors (RECIST) [12]. However, theindeterminate wall morphology of the GI tract and thefibrotic changes caused by NAC limit the application ofRECIST; additionally, RECIST cannot be used to predicttreatment response before treatment, and thus, thereis a delay before it can be used [13–18]. Therefore, it iscrucial to evaluate the efficacy of NAC in a timely andaccurate manner before treatment to enable early identification of patients who will respond to NAC, and so thatthose who will respond poorly can immediately receivesurgical treatment. Such an approach could help developindividualized treatment plans for AEG patients, improvepatient prognosis and save valuable medical resources.Along with traditional CT-based response evaluation,the radiomics method has great potential for revealingdeep imaging information. The method adopts a combined medical-industrial approach to transform traditional images into deep-level digital quantitative features;the technique can be used to uncover the potential biological characteristics and heterogeneity within thetumor using the imaging data and to provide informationbeyond the morphological and functional characteristicsof the tumor [19–22]. Several radiomics-based studiesregarding the neoadjuvant treatment of esophageal andgastric cancers have been reported [3, 4, 23–25]. However, the use of this technique for the pre-NAC prediction of NAC response for AEG alone is rarely reported inmost clinical studies of esophageal or gastric cancers, andmost studies are single-center studies that lack independent external validation [26].The purpose of our study was to retrospectively analyzethe clinical, pathological and enhanced CT imaging dataof patients with advanced AEG before NAC. The models used for predicting pathological complete response(pCR) to NAC were developed and externally validated.We hope the study will provide evidence for understanding tumor response-related quantitative imagingcharacteristics and contribute to the development ofindividualized and precise treatment strategies for AEGpatients.Materials and methodsThe study protocol was approved by the Medical EthicsCommittee of Zhengzhou University, and the need forinformed consent was waived.Patient selectionClinical, pathological and CT imaging data of AEGpatients who underwent surgical resection after preoperative NAC at the First Affiliated Hospital of ZhengzhouUniversity and Henan Provincial Cancer Hospital wereretrospectively collected from November 2014 to September 2020. The patient enrollment criteria included the
Huang et al. Insights into Imaging(2022) 13:134following: (1) AEG confirmation by gastroscopic biopsypathology prior to treatment; (2) pre-NAC clinical stageof cT2–4N0–3M0 stage; (3) NAC treatment in 2–6 cycles;(4) lack of other antitumor therapy administered beforeNAC; (5) enhanced CT scan obtained within 1 weekprior to NAC treatment with complete imaging data; (6)lesion covering at least 3 slices on CT cross section and amaximum plane diameter of at least 2 cm; and (7) radical resection performed after NAC treatment with complete postoperative pathology data. The exclusion criteriaincluded: (1) combined history of other malignancies; (2)poor CT image quality or lack of raw DICOM data; (3)adverse event during NAC or less than 2 cycles of NAC;(4) combined heart, lung and other important organ dysfunction in which a CT examination could not be performed; and (5) incomplete CT imaging data or clinicaland pathological data.Patients with AEG from the First Affiliated Hospital ofZhengzhou University were included in this study as thetraining group (n 60), and 32 patients with AEG fromCancer Hospital of Zhengzhou University were includedas the external validation group (n 32).Clinical dataThe chemotherapy regimens included the following:(1) XELOX regimen: oxaliplatin given intravenously at130 mg/m2 for 2 h on Day 1, repeated every 3 weeks;patients received capecitabine at a dose of 1000 mg/m2(bid, 1–14 d) orally twice daily; (2) SOX regimen: oxaliplatin 130 mg/m2 intravenously oral capsules 80 mg/m2 in combination for 14 days twice daily. Patients andfamilies signed informed consent forms. The treatmentconsisted of between 2 and 6 cycles unless disease progression, intolerable toxicity, or death occurred. Allpatients underwent radical surgical resection within1 week of the end of NAC treatment.The clinical data collected in our study includedage, sex, carcinoembryonic antigen levels (CEA, normal range 0–5 ng/mL), carbohydrate antigen 199 level(CA199, normal range 0.01–37 U/ml), carbohydrateantigen 125 levels (CA125, normal range 0.01–35 U/ml), and serum albumin levels (normal range 35–55 g/l).TNM staging of tumors performed using CT images wasevaluated according to the 8th edition of the AmericanJoint Committee on Cancer (AJCC) staging [27]. TheBorrmann typing of the AEG was documented [28]. Thepostoperative pathological TRG grading was recordedas a criterion for evaluating the efficacy of NAC. A TRGgrade of 0 is defined as complete response, with no viablecancer cells remaining in the primary lesion and lymphnodes; TRG grade 1 is defined as moderate response,with single or small clusters of cancer cells remainingin the lesion; TRG grade 2 is defined as mild response,Page 3 of 11with significant disappearance of cancer cells under themicroscope but some amount of cancer cells remaining, but with less interstitial fibrosis; and TRG grade 3 isdefined as poor response, with no significant disappearance of cancer cells under the microscope or only a fewcancer cells remaining. Patients were divided into thepCR group (tumor regression grade [TRG] grade 0)and the nonpCR group (TRG grade 1–3) based on thepostoperative pathological histological TRG evaluation.In the training group, there were 19 patients in the pCRgroup and 41 patients in the nonpCR group. In the external validation group, there were four patients in the pCRgroup and 28 patients in the nonpCR group. The clinicalcharacteristics of the enrolled patients are summarized inTable 1.CT image acquisitionAll patients underwent contrast-enhanced CT scans, andinformed consent forms were signed before inspection.The CT scans were acquired with a 64-row CT scanner (Discovery CT 750 HD, GE Healthcare, Waukesha,WI, United States) or a 256-row CT scanner (Revolution CT, GE Healthcare, Waukesha, WI, United States).Preparation for the examination occurred as follows:Patients fasted for more than 8 h before the examination and were given an intramuscular injection of scopolamine 10–20 mg 15–20 min before the examinationto reduce gastrointestinal motility (Hangzhou Minsheng Pharmaceutical PG Roup Co., Ltd., Specifications:10 mg/ml) and breath-holding exercises were performed.The patients also drank 800–1000 mL of warm water10–15 min before the examination. The scanning parameters were as follows: tube voltage 120 kV; tube currentusing automatic milliampere second technology with apitch of 1.375/1.1; field of view (FOV) of 500 mm; matrix512 512 mm; and a scan thickness of 0.625–5 mm withscan spacing from 0.625 to 5 mm. The scan area at leastencompassed the lower esophagus to the lower border ofboth kidneys. For the enhancement scan, 90–100 mL ofnonionic contrast agent was injected through the elbowvein using a high-pressure syringe (iopromide, 370 mg/mL, GE Medical Systems, 1.5 mL/kg and 3 mL/s). Usingthe low-dose trigger technique, when the descendingaorta reached 100 HU after the injection of contrastmedium, arterial phase images were collected 10 s later,and venous phase images were collected at intervals of30 s.Image processing and ROI segmentationThe CT images in arterial and venous phases were isotropically resampled by using trilinear interpolation inArtificial Intelligence Kit software (A. K, version: 3.3.0.R, GE Healthcare, USA) with a voxel size of 1 1 1 mm
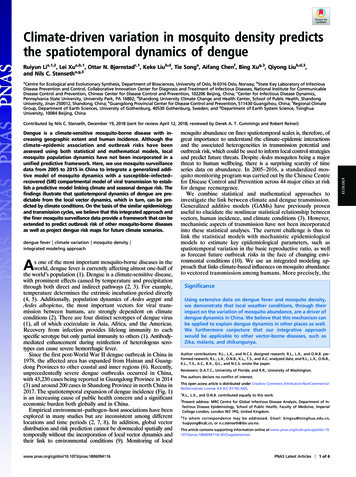
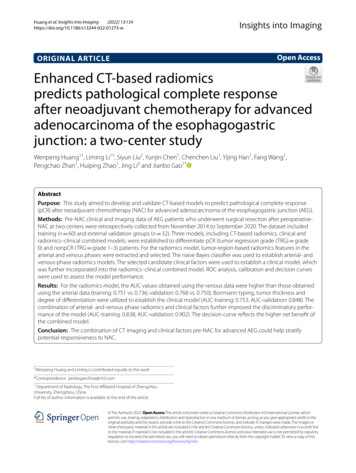
Huang et al. Insights into Imaging(2022) 13:134Page 4 of 11Table 1 Clinical characteristics of the enrolled patients in thetraining group and the external validation groupTraining group(n 60)Validationgroup(n 32)p value0.993GenderMale4924Female118Age (years)60.60 9.3362.50 5.860.340Serum CA125(Elevated)610.300Serum CA199(Elevated)850.241Serum CEA (Elevated)1890.112Serum albumin(Reduced)2910.3150.010*Borrmann typingI–II3210III–IV282218.19 5.7515.39 5.140.036*0.087Tumor thickness (cm)Degree of differentiationLow2520Middle-high3512T-staging before NAC431212–329110.122N-staging before NAC0–138172–322150.578TRG 019411210215931490.218NAC neoadjuvant chemotherapy, TRG tumor regression grade, CA carbohydrateantigen, CA199 (normal range 0.01–37 U/mL), CA125 (normal range 0.01–35 U/mL), CEA carcinoembryonic antigen (normal range 0–5 ng/mL)*Statistically significant level: p 0.05to minimize the effect of different scanning protocolsor equipment on the radiomics features [29]. Region ofinterest (ROI) segmentation was performed by delineating around the tumor outline for the largest cross-sectional area in the CT axial plane (Fig. 1). Care was takento avoid the gastric cavity and stomach contents, fattytissue around the stomach wall and blood vessels whensegmenting. Each ROI was outlined by a radiologist (L.C.6 years of experience in abdominal imaging diagnosis)and supervised by a radiologist (Z.H., 8 years of experience in abdominal imaging diagnosis). To ensure thereliability and reproducibility of the radiomics features,30 patients were randomly selected for their data to besegmented. For an analysis of interobserver agreement, aradiologist (L. CC) conducted the first-time whole-dataset segmentation, and another radiologist (H.W., 7 yearsof experience in abdominal imaging diagnosis) who wassupervised by a radiologist (L.L., 9 years of experience inabdominal imaging diagnosis) delineated the images ofthe 30 selected patients during the same period. For analysis of intraobserver agreement, the radiologist (L. CC)repeatedly conducted segmentation 1 month after thefirst delineation.Radiomics feature extractionThe radiomics features were automatically extracted byusing the Python package Pyradiomics [30]. A total of1409 radiomics features were separately extracted fromthe delineated ROI in the arterial and venous phases.There were 107 features extracted from the originalimages, including 32 first-order features (18 intensitystatistical and 14 shape features). Among the 75 texturalfeatures, there were 24 gray-level cooccurrence matrix(GLCM), 16 gray-level run length matrix (GLRLM),16 gray-level size zone matrix (GLSZM), 14 gray-leveldependence matrix (GLDM) and 5 neighboring graytone difference matrix (NGTDM) features. In addition,the same number of first-order grayscale statistical features and texture features were extracted based on different transformed images. A total of 744 features wereextracted based on wavelet decomposition images with8 filter channels, 279 features were extracted based onLaplacian of Gaussian (LoG) transform images (sigmaparameters selected as 1.0 mm, 3.0 mm and 5.0 mm), and279 features were extracted based on local binary pattern (LBP)-filtered images (2nd-order spherical harmonicfunction, spherical neighborhood operator with radius1.0 and fine fraction 1) [30]. The features were extractedby discretizing the CT values of the ROI region basedon a fixed interval width (bin width 25 HU). Then,the intra/interclass correlation coefficients (ICCs) werecalculated based on the features extracted from the 30randomly selected patients. The features with intra- andinterobserver ICC values simultaneously greater than0.7 were retained for assessment of arterial- and venousphase features, respectively [31].Radiomics feature selection and model establishmentThe training dataset was used for feature selection andmodeling, and the same procedure and set of parameterswere applied to the external dataset for model validation.The same method described above was used to performfeature preprocessing and feature screening in the arterial and venous phases and to build independent arterial
Huang et al. Insights into Imaging(2022) 13:134Page 5 of 11Fig. 1 Hypofractionated adenocarcinoma of the esophagogastric junction (AEG) in a 63-year-old man. A CT venous phase axial image beforeneoadjuvant chemotherapy (NAC), Borrmann staging type I, thickest tumor diameter of 3.4 cm. B Schematic diagram of region of interest (ROI)segmentation on ITK-SNAP software. C CT venous phase axial image after NAC, lesion near disappearance, and insignificant gastric wall thickening.D Postoperative pathological images; fibrous tissue hyperplasia with chronic inflammatory cell infiltration was seen; no tumor cells remained;and tumor regression was obvious (HE 200). Hypofractionated AEG in a 36 years old man. E CT venous phase axial image before neoadjuvantchemotherapy (NAC), Borrmann staging type III, thickest tumor diameter of 3.2 cm. F Schematic diagram of region of interest (ROI) segmentationon ITK-SNAP software. G CT venous phase axial image after NAC, significantly smaller lesions with reduced enhancement. H Postoperativepathological images showed more chronic inflammatory cell infiltration in the mucosal and lamina propria layers with focal fibrosis (HE 200)and venous radiomics models. The feature selection andmodeling were performed as follows.(1) Outlier processing occurred with values greaterthan the third quartile 2 quartile distance beingconverted to the 95th percentile; values less thanthe first quartile 2 quartile distance were converted to the 10th percentile.(2) Features with relatively low variance values lessthan 1.0 were excluded.(3) Missing data were filled with the median value, andthe Z Score standardization method was applied fordata standardization and normalization.(4) The less redundant features were retained by usingcorrelation analysis with a cutoff value of 0.9.(5) Features with importance coefficients greater thanthe maximum importance coefficient/3 assessedusing the gradient-boosted decision trees (GBDT)feature importance ranking based on decision treemethods were retained.(6) Radiomics models were established using the naïveBayes classifier, and the predicted probability of themodel output was used as the Radscore for eachindividual model.Based on the above feature screening and modelingmethods, our study developed two radiomics modelsbased on pCR outcome: (1) an arterial radiomics modelwith Radscore AP pCR and (2) a venous radiomics modelwith Radscore VP pCR.Clinical feature selection and model establishmentThe clinical features were screened using GBDT (selection of the top three features of importance) and univariate logistic regression (p 0.1). Model building wasperformed using the naïve Bayes classifier, and the predicted probability of the model output was used as themodel score of the clinical model. Based on the abovefeature screening and modeling methods, clinical modelsfor predicting pCR (Score clinic pCR) were established.Combined model establishmentBased on the established Radscores and clinical factors,radiomics–clinical combined models were developedusing the naïve Bayes classifier. Four combined modelswere built, including the following: (1) arterial–venouscombined model; (2) arterial–clinical combined model;(3) venous–clinical combined model; and (4) arterial–venous–clinical combined model.Evaluation of model predictive performanceThe performance of the model was evaluated by usingreceiver operating characteristic curve (ROC) analysis toobtain the area under the ROC curve (AUC). The sensitivity, accuracy, negative predictive value and positivepredictive value were calculated from the cutoff values of
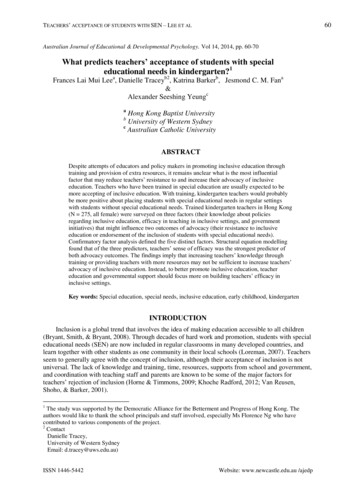
Huang et al. Insights into Imaging(2022) 13:134the model score corresponding to the maximum Youdenindex to evaluate the discriminatory performance of themodel. The cutoff value of the training group data wasapplied to the validation group data to obtain their corresponding discriminatory efficacies in the external validation group. The calibration ability of the model wasmainly tested using calibration curve analysis and theHosmer–Lemeshow test for goodness of fit (p 0.05 indicates no significant difference between the predicted andactual values). To compare the AUC of different models,Delong’s test was applied (p 0.05 indicates a significantdifference). A decision curve analysis (DCA) was used toassess the net clinical benefit or clinical utility obtainedby the model at different threshold probabilities.Statistical analysisStatistical analysis was performed using R software (version 3.6.3, http:// www.r- proje ct. org). Continuous variable comparisons between two groups were made usingindependent samples t tests (for data conforming to anormal distribution) or Mann–Whitney U tests (for datanot conforming to a normal distribution). Categoricalvariables were tested by the chi-square test or Fisher’sexact test. A two-sided p value of 0.05 was consideredstatistically significant. The following R packages wereapplied: “icc” for intra/interclass correlation coefficient;“glmnet” for logistic regression; “pROC” for ROC analysis; “rmda” for DCA; calibration function in the “rms”package for calibration analysis, “gbm” for GBDT featureimportance analysis, “naïveBayes” function for NaïveBayes classifier, “adabag” package for AdaBoost classifier,“e1071” package for SVM classifier, and “rpart” packagefor decision tree classifier.Page 6 of 11ResultsModel establishment for predicting pCRArterial model for predicting pCRBy using intra/interclass consistency analysis, 395 radiomics features with ICCs 0.70 were retained among1409 features. After removing features with a varianceless than 1.0, 150 features were retained. Then, 43 features were retained after correlation analysis by using acutoff value of 0.9. Six features were retained by GBDTfeature importance ranking (Fig. 2A), and the arterialmodel was established using the naïve Bayes classifier.The AUC values and 95% confidence intervals for theanalysis of AEG using single arterial features for predicting pCR in the training and external validation groups aresummarized in Additional file1: Table S1, and the ROCcurves are shown in Additional file1: Fig. S1A, B. Thearterial model radiomics features and the differences inRad-scoreAP pCR in the training and external validationgroups are summarized in Additional file1: Table S2.Venous model for predicting pCRBy using intra/interclass consistency analysis, 410 radiomics features with ICCs 0.70 were retained among1409 features. After removing features with variance lessthan 1.0, 165 features were retained. Then, 52 featureswere retained after correlation analysis by using a cutoffvalue of 0.9. Seven features were retained by GBDT feature importance ranking (Fig. 2B), and the venous modelwas established using the naïve Bayes classifier. The AUCvalues and 95% confidence intervals for the analysis ofAEG using single venous features for predicting pCR inthe training and external validation groups are shown inAdditional file1: Table S3, and the ROC curves are shownFig. 2 The ranked importance of GBDT selected features for each independent model. A Arterial-phase radiomics features. B The venous-phaseradiomics features. C The clinical factors
Huang et al. Insights into Imaging(2022) 13:134Page 7 of 11in Additional file1: Fig. S1C, D. The venous model radiomics features and the differences in Rad-scoreVP pCR inthe training and validation groups are shown in Additional file1: Table S4.Clinical model for predicting pCRThe results of the GBDT feature importance ranking areplotted in Fig. 2C, and the univariate logistic regressionresults for the clinical factors are summarized in Additional file1: Table S5. The Borrmann classification, tumorthickness, and differentiation degree were finally selectedand incorporated into the naïve Bayes classifier to establish the clinical model.The evaluation of model performanceThe AUC values, specificity, sensitivity, accuracy, positive predictive value and negative predictive value of theseven models developed in this study for predicting pCRin the training and external validation groups are shownin Table 2. The ROC curves are shown in Fig. 3A, B. Theresults of the Delong test used to compare the AUCvalues of the seven models in the training and validation groups are shown in Additional file1: Table S6. Thecalibration curves were used to visualize the calibrationof all models (Fig. 3C, D), the Hosmer–Lemeshow testwas used to assess the goodness of fit (Additional file1:Table S7), and the decision curves were used to confirmthe clinical usefulness of the models (Fig. 3E, F).To explore the reliability of the developed model, wealso used other modeling methods (logistic regression,support vector machine, decision tree, AdaBoost) for theestablishment of a pCR radiomics model and a clinicalmodel based on the same feature sets, and the results areshown in Additional file1: Tables S8–S10. These resultsindicated that the Naïve Bayes classifier could achievebetter model performance in the radiomics and clinicalmodels.DiscussionIn this retrospective study, we analyzed the clinical,pathological and enhanced CT imaging data of patientswith advanced AEG before NAC at two medical centersto develop radiomics, clinical, and combined models forpredicting pathologically determined TRG grading. Theresults showed that the combined radiomics–clinicalmodel has the potential to be a reference for evaluatingtumor response and developing treatment strategies forpatients with AEG.Preoperative NAC has been shown to reduce the stageof AEG, increase the rate of radical surgical resection,and improve the long-term prognosis of patients [2–5, 11,32]. However, 40–70% of patients have a poor responseto NAC. Some patients miss the best opportunity forTable 2 Efficacy of different models in the training group and the external validation group for predicting pathological completeresponse (pCR)ModelArterial modelVenous modelClinical modelArterial–venous Arterial–clinical Venous–clinical Arterial–venous–combined model combined model combined model clinical combinedmodelTraining groupAUC V0.4840.6320.5360.7500.6520.7060.548External validation groupAUC 0.92310.9261PPV0.1880.3000.4290.3330.4000.4000.222
Huang et al. Insights into Imaging(2022) 13:134Page 8 of 11Fig. 3 The performance of different models. A, B ROC curves of different models for predicting pathological complete response (pCR) ofadenocarcinoma of the esophagogastric junction (AEG) in the training group (A) and external validation group (B). C, D Calibration curvesof different models predicting pCR in the training group (C) and external validation group (D). The 45-degree sloping line indicates the idealcalibration, and the closer the model calibration curve is to the ideal calibration line, the better the agreement between the model predictedprobability and the actual probability. E, F Decision curves of different prediction models in the training group (E) and external validation group (F).The X-axis is the threshold probability range, and the Y-axis is the net benefit. The black line labeled "NONE" indicates that no lesions are assumedto be pCR, and the gray line labeled "ALL" indicates that all lesions are assumed to be pCR. The further away from both the black and gray lines, thehigher the net benefit of the model compared to performance utilizing the "NONE" and "ALL" assumptions. When comparing the decision curves ofdifferent models within the same range of threshold probability, the larger the area under the curve for the same threshold probability interval, thehigher the net benefit of the model at that threshold probabilityd
on the pathological response of the lesion after chemo-therapy. e histological tumor regression grade (TRG) is an objective indicator used to evaluate the ecacy of therapy for AEG patients when cancer cells in the lesion are absent or when only a small number remain [7]. 6, In patients with a mild pathological response or poor