Transcription
Battery Electric Vehiclesvs. Internal CombustionEngine VehiclesA United States-Based Comprehensive Assessment
ContentsExecutive Summary1Summary of Findings4Introduction to BEVs5Economic Assessment: Total Cost of Ownership7Total Cost of Ownership and True Vehicle Cost8Environmental Assessment: Global Warming Potential11Environmental Assessment: Secondary Environmental Impacts14Alternative Views16Technology Forecast: BEVs and ICEVs in John W. BrennanManaging Director, Arthur D. Little,Strategy & Organization, Bostonbrennan.john@adlittle.comTimothy E. Barder, Ph.D.Manager, Arthur D. Little,Strategy & Organization, Bostonbarder.tim@adlittle.comThe authors acknowledge Hui Zhao, Tom Parish, Brian St. Amand, and Mike Gourd for their assistance in preparing this report.
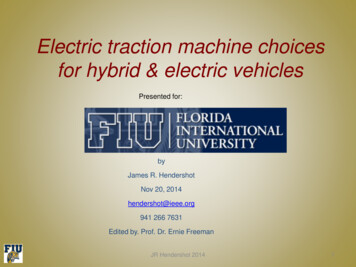
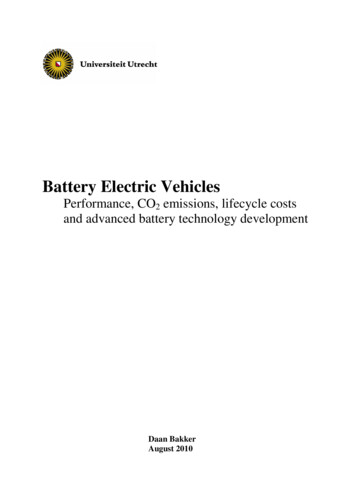
Battery Electric Vehicles vs. Internal Combustion Engine VehiclesExecutive SummaryA United States-Based ComprehensiveAssessmentBattery electric vehicles (BEVs) do not consume gasoline orproduce tailpipe carbon emissions, placing the promise of anenvironmentally sustainable driving experience within reach of theaverage consumer. However, the question remains: “Do BEVstruly offer an environmental advantage with respect to globalwarming potential and secondary environmental impacts – and ifso, at what cost?”To address this question, Arthur D. Little conducted a total lifecycleeconomic cost and environmental impact analysis of Lithium-ionbattery electric vehicles (BEVs) versus internal combustion enginevehicles (ICEVs) to further understand BEVs and their transformative potential. This study models the relative impacts of new BEVsand ICEVs in the United States for the latest full calendar year forwhich data is available, 2015, and it projects the economic andenvironmental impacts of BEVs and ICEVs over the entire assumedtwenty-year lifetime for a US passenger vehicle. Given that this is arapidly evolving market, our study also forecasts the economic andenvironmental impacts that new BEVs and ICEVs will have in 2025,taking into account salient expected developments in batterytechnology, vehicle range, and fuel economy standards.leveraged this information to model the 2025 TCO, GWP, andSecondary Environmental Impacts for BEVs and ICEVs.Based on our study, the ultimate environmental and economicreality of electric vehicles is far more complicated than theirpromise. From an economic perspective, BEVs enjoy some distinctadvantages. First, the electricity cost associated with operating aBEV over a distance of one mile is significantly lower than thegasoline cost required to operate a comparable ICEV over the samedistance. Second, BEVs cost less to maintain, owing to the relativeelegance and simplicity of a battery-electric motor systemcompared with the frequent maintenance required for operation ofan internal combustion system. Third, automotive batterytechnology has evolved rapidly since the current generation of BEVscame to market, with the price per kilowatt-hour (kWh) oflithium-ion battery packs declining from 1,126 in 2010 to just 300in 2015 (see Appendix E-1).These cost advantages, however, are entirely offset by a host ofother economic factors. The TCO for a BEV is significantly greaterthan the TCO for an equivalent ICEV. BEVs in 2015 were, withoutexception, significantly more expensive to manufacture thancomparable ICEVs – due primarily to the cost of batterymanufacturing – and they imposed a much higher cost burden onvehicle owners (see Figure 1). Ultimately, this cost burden presentsIn order to determine the true cost and environmental impacts fromBEVs, we performed a comprehensive quantitative analysisexcluding any government incentives or subsidies. Our studyinvestigated every stage of the vehicle’s lifecycle, from R&D andproduction, including sourcing of raw materials, through ownershipand end-of-life disposal. We evaluated the impacts associated witheach component of the vehicle, from the novel technologies andchemistries involved in battery production to the In-Use energyrequirements (i.e., gasoline and electricity, from well-to-wheels)necessary to power a vehicle. We constructed models thatcalculate the 2015 Total Cost of Ownership (TCO), Global WarmingPotential (GWP), and Secondary Environmental Impacts (e.g.,Human Toxicity Potential characterized as Disability Adjusted LifeYears lost) for BEVs and ICEVs. We also forecast how BEV andICEV technology will evolve over the coming decade and we 1Figure 1. Total Cost of Ownership over a 20-Year Lifetime fora 2015 ICEV versus an Equivalent BEVIn Thousands of Dollars at Present Value100868060 44%68 60%544840200CompactICEVSource: ADL AnalysisCompactBEVMid-SizeICEVMid-SizeBEV
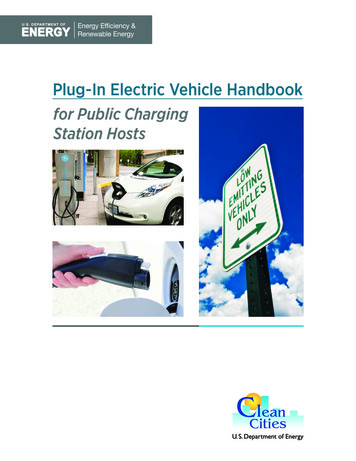
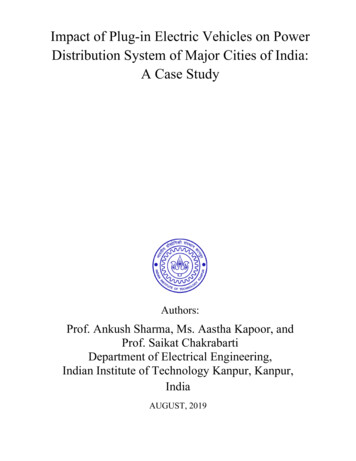
Battery Electric Vehicles vs. Internal Combustion Engine VehiclesFigure 2. Greenhouse Gas Emissions over a 20-Year Lifetimefor a 2015 ICEV versus an Equivalent BEVIn Thousands of Pounds of CO2e Emissions160Figure 3. Days of Life Impact (Death or Disability) for a 2015Compact Passenger ICEV versus an Equivalent BEV over 20Years of OwnershipICEV152-19%123137-23%120Production and R&D105Replacement Battery80In-UseEnd of tal952Alternative Transport4004BEV4106020Values do not sum to total due to rounding. Source: ADL AnalysisSource: ADL Analysisa significant barrier for wider adoption of BEVs and could explainwhy their market penetration has been limited to date.From an environmental perspective, the picture is even morecomplex. BEVs in 2015 achieve the goal of reducing greenhousegas emissions relative to comparable ICEVs when consideredover a vehicle’s lifetime, but this masks an increased humanhealth impact relative to ICEVs and a host of other collateralimpacts to the environment (see Figures 2 and 3). While most ofthe environmental impacts generated by ICEVs are localized tothe combustion of gasoline in the vehicle engine, themanufacturing process for BEVs generates a much more widely-dispersed and damaging set of environmental impacts, offsettinga significant portion of their overall advantage with respect togreenhouse gas emissions.In particular, the usage of heavy metals in the manufacture oflithium-ion battery packs for BEVs combined with pollutiongenerated by the US power grid (e.g. tailings from coal powerplants) for the In-Use portion of a BEVs lifecycle generate approximately three times the amount of human toxicity compared toICEVs (see Figure 3). Given the divergence in where environmentalimpacts are allocated, it is safe to say that a consumer whochooses to drive a BEV over an ICEV shifts the environmentalFigure 4. Comparison of ADL’s Study with Union of Concerned Scientists’ and National Bureau of EconomicResearch’s FindingsImpact AreaADLUCSNBERTotal Cost of OwnershipBEV is 44% more expensivethan ICEVNot coveredNot coveredGlobal Warming PotentialBEV has 23% less GWPimpact than ICEVBEV has 51% less GWPimpact than ICEVBEV has 40% less GWP impactthan ICEVSecondary EnvironmentalImpactsBEV has 3 times greaterHuman Toxicity PotentialNot coveredBEV has 3 times greater damagesfrom local pollutantsSource: ADL Analysis, UCS, and NBER2
Battery Electric Vehicles vs. Internal Combustion Engine Vehiclesimpact of car ownership. As detailed in a recent series of investigative reports by the Washington Post, much of the cobalt andgraphite entering the supply chain for lithium-ion batteries issourced from poorly regulated and heavily polluting mines in Congo1and China.2 While the BEV driver reduces their local contribution togreenhouse gas emissions, they create a more diffuse set ofenvironmental impacts spread across the globe, the consequencesof which are largely borne by rural and often disadvantagedcommunities near the mines from which BEV suppliers source rawmaterials for battery pack manufacturing.As part of our study, Arthur D. Little also presents the findings oftwo other widely-cited reports on the environmental impact ofBEVs versus ICEVs – “Cleaner Cars from Cradle to Grave: HowElectric Cars Beat Gasoline Cars on Global Warming Emissions,”3from the Union of Concerned Scientists (UCS), and “EnvironmentalBenefits from Driving Electric Vehicles?”4 from the National Bureauof Economic Research (NBER). Both of these reports examine theenvironmental impact of BEVs and ICEVs, and both reportsdescribe the policy implications that arise from their findings.However, UCS and NBER reach drastically different conclusions.We present their divergent findings to frame the broader discussionand situate our study within the larger debate on the trueenvironmental impact of BEVs and ICEVs in the US (see Figure 4).Forecasting the technological trends for new BEVs and ICEVs in2025, Arthur. D. Little’s modeling demonstrates that while the TCOdifferential between BEVs and ICEVs will decline significantlyrelative to 2015, ICEVs will continue to have an economic advantage ranging from 5,800 to 11,100 (Present Value) relative toBEVs. From an environmental perspective, the differentials in globalwarming potential and human toxicity potential will both widen in2025 vis-a-vis 2015: BEVs will produce even lower levels ofgreenhouse gases relative to ICEVs, but they will generate approximately five times as much human toxicity potential compared toICEVs due to the utilization of larger battery packs. Combined withthe greater financial burden BEVs place on the consumer, thecomplex environmental reality of BEVs will continue to presentchallenges for the sustainability-minded consumer in choosingwhether to drive a BEV or an ICEV.Glossary of AcronymsBEV Battery Electric VehicleCAFE Corporate Average Fuel EconomyCO2e Carbon Dioxide EquivalentsDALY Disability Adjusted Life YearEPA Environmental Protection AgencyESS Energy Storage SystemFFDP Fossil Fuel Depletion PotentialFTP Freshwater Toxicity PotentialGWP Global Warming PotentialHEV Hybrid Electric VehicleHTP Human Toxicity PotentialICEV Internal Combustion Engine VehiclekWh Kilo-Watt HourLCOE Levelized Cost of ElectricityMDP Mineral Depletion PotentialMWh Mega-Watt HourNERC North American Electric ReliabilityCorporationNHTSA National Highway Traffic SafetyAdministrationOEM Original Equipment Manufacturerp-DCB para-DichlorobenzenePHEV Plug-in Hybrid VehicleTCO Total Cost of OwnershipTTP Terrestrial Toxicity PotentialTVC True Vehicle Cost Frankel, Todd C. The cobalt pipeline. Washington Post, September 30, 2016.Whoriskey, Peter. In your phone, in their air. Washington Post, October 2, 2016. Nealer, R.; Anair, D.; Reichmuth, D. Cleaner Cars from Cradle to Grave: How Electric CarsBeat Gasoline Cars on Lifetime Global Warming Emissions. Union of Concerned Scientists:Cambridge MA, 2015.4 Holland, S.; Mansur, E.T.: Muller, N.; Yates, A. Environmental Benefits from Driving ElectricVehicles? National Bureau of Economic Research: Cambridge MA, 2015.123 3
Battery Electric Vehicles vs. Internal Combustion Engine VehiclesSummary of FindingsArthur D. Little conducted a total lifecycle economic cost andenvironmental impact analysis of Lithium-ion battery electricvehicles (BEVs) versus internal combustion engine vehicles(ICEVs). The multifaceted results from this analysis include: 1)Total Cost of Ownership (TCO) representing the total lifecycleeconomic cost analysis, 2) Greenhouse Gas Emissions / GlobalWarming Potential (GWP) representing one aspect of the totallifecycle environmental impact analysis, and 3) SecondaryEnvironmental Impacts representing another aspect of the totallifecycle environmental impact analysis. With respect to theenvironmental analysis and results, ADL determined that directcollateral impact to human life – defined by human toxicitypotential, a secondary environmental impact – is an importantconsideration to be balanced against Greenhouse Gas Emissions /GWP in a comprehensive assessment of the relative environmental merits of BEVs and ICEVs.n Totaln Greenhouse4n SecondaryEnvironmental Impacts – BEVs generate a hostof secondary environmental impacts greater than those ofICEVs. A 2015 BEV generates enough toxicity over a vehicle’slifetime to cause an impact to human life equivalent to 20days of life lost to death or disability,5 whereas a 2015 ICEVgenerates enough toxicity to impact the average human lifeby only 6 days. The differential in secondary environmentalimpacts will widen for new vehicles in 2025, with BEVsproducing even higher levels of human toxicity potential.Cost of Ownership (TCO) – For a 2015 CompactPassenger Vehicle, the total cost of ownership over a twentyyear vehicle lifetime is 68,492 for the sample BEV modelversus 47,676 for an equivalent ICEV—a 44% cost advantagefor the ICEV excluding any government subsidies or incentives. For a 2015 Mid-Size Passenger Vehicle, the total cost toown a BEV is 85,854 versus 53,649 for the ICEV—a 60%cost advantage for the ICEV. The cost differential betweenBEVs and ICEVs will narrow for new vehicles in 2025.Gas Emissions / Global Warming Potential (GWP) – For a 2015 Compact Passenger Vehicle, thesample BEV model produces 105,054 pounds of greenhouse gas emissions (CO2-equivalents) over a full vehiclelifetime, whereas the equivalent ICEV produces 136,521pounds of greenhouse gas emissions, a 23% advantagein global warming potential for the BEV. For the 2015 MidSize Passenger Vehicle, the BEV produces 122,772 poundsof CO2-equivalents, whereas the ICEV produces 151,651pounds, a 19% advantage in global warming potential for theBEV. BEVs and ICEVs will both produce fewer greenhousegas emissions in 2025, but the balance will still favor BEVs. Measured in disability adjusted life years (DALYs), a comprehensive metricdefined by the National Institutes of Health as “the total number of yearslost to illness, disability, or premature death within a given population. 5
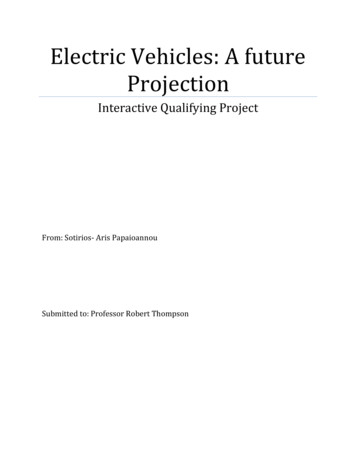
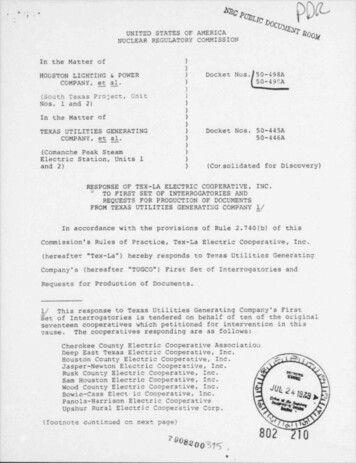
Battery Electric Vehicles vs. Internal Combustion Engine VehiclesIntroduction to BEVsToday, the electric vehicle market in the United States iscomprised of battery electric vehicles (BEVs), plug-in hybridelectric vehicles (PHEVs), and hybrid electric vehicles (HEVs).Alone among these vehicles, the BEV does not require gasoline atany point during operation, relying solely upon pure electricbattery power (see Figure 5). This study focuses exclusively onthe comparison between BEVs and Internal Combustion EngineVehicles (ICEVs).Of the other types of electric vehicles available in the US, thePHEV, like the BEV, uses a lithium-ion battery and runs on anelectric motor, but the vehicle switches over to gasoline when thebattery runs low. The HEV has an electric engine and powertrainbut still runs on gasoline. HEV models, such as the ubiquitousToyota Prius, have been available since 1999 in the US and over 4million vehicles have been sold to date.By contrast, BEVs have been available in the US mass marketsince December 2010, when the Nissan LEAF was introduced.Since the introduction of the Nissan LEAF, about 275,000 BEVshave been sold in the US. Year-on-year growth in BEV sales hasbeen positive in every subsequent year, though the rate of growthhas slowed in recent years (see Figure 6). This could be due tomultiple factors, including a marked decline in the price of gasolineFigure 5. Sample BEV Modeland the fact that BEVs are limited by driving range and a charginginfrastructure that is still in a nascent stage of development.BEV sales also remain heavily concentrated in certain automotivesegments and geographies. Roughly half of all BEVs sold in theUS have been sold in California (see Figure 7). In addition, since2014, over half of all BEVs sold in the US have been luxurymodels produced by Tesla. Further granulizing of this data revealsthat about one quarter of all BEVs sold in the US have been luxuryTesla models sold in California. Of the remaining BEVs sold in theUS, 45% have been Compact Passenger Vehicles. However, it isimportant to note that BEVs represent less than 1% of the entireUS vehicle fleet today.For the purposes of our assessment, ADL modeled tworepresentative BEVs and their directly comparable ICEVcounterparts – one for the Compact Passenger segment and onefor the Mid-Size Passenger segment (see Figure 8). In order toassess the potential impact of widespread BEV adoption, weconsidered which vehicles were accessible to mass marketconsumers and imposed a 40,000 price threshold, therebyexcluding the Luxury segment from the vehicle samples we usedin constructing our models.It is worth noting that the definitions of vehicle segments can varyby source, which has implications for the comparison betweenBEVs and ICEVs. For example, the classification system used bythe EPA relies in large part on a vehicle’s interior cubic footage,leading the EPA to classify the Nissan LEAF as a Mid-SizePassenger Vehicle. By contrast, most other mainstream sources(e.g. Car and Driver, Kelley Blue Book, etc.) treat the Nissan LEAFas a Compact Passenger Vehicle based on its specifications.Resultantly, it is important to consider the underlying features of avehicle – as opposed to relying on the definition of vehiclesegmentation from any one source – to ensure a true “apples-toapples” comparison between BEVs and ICEVs.Source: Alternative Energy News 5
Battery Electric Vehicles vs. Internal Combustion Engine VehiclesFigure 6. Total US Sales of BEVs by YearFigure 7. Percentage of Total BEVs Sold in Each Statein 2014In ThousandsThe size of each circle is proportional to the percentage of total BEV salesthat each state represents.806466726048402010014020102011Year on YearGrowth Rate2012201344%246%201431%20152016est.3%9%Source: ADL AnalysisSource: ADL AnalysisFigure 8. Sample Vehicles Used in the StudySpecifications - 2015Compact PassengerMid-Size PassengerBEV Battery Size – kWh2334BEV Driving Range – Miles761000.3200.350Ford Focus TitaniumHonda Accord EX3027BEV Efficiency – kWh per MileICEV Reference VehicleICEV MPGSource: ADL Analysis6
Battery Electric Vehicles vs. Internal Combustion Engine VehiclesEconomic Assessment:Total Cost of OwnershipADL’s study focused on two critical comparisons between BEVsand ICEVs – an economic assessment focused on Total Cost ofOwnership (TCO), and an environmental impact analysis focusedon GWP and Secondary Environmental Impacts. With regard toour TCO analysis, ADL decided to model the related economics ofBEVs and ICEVs from the perspective of an individual consumeroperating under real world conditions. To this end, it was necessary to ensure a true apples-to-apples cost comparison betweenBEVs and ICEVs.One of the first adjustments we made was to account for theimpact of BEV driving range. Survey data reveals that BEVs aredriven an average of 27% fewer miles per year than comparableICEVs, but BEV owners still travel the same total miles as theirICEV counterparts.6 This phenomenon results from BEV ownersusing alternative modes of transportation for trips beyond thelimited range of their BEVs – an issue for BEV owners that isfurther exacerbated by a lack of BEV charging infrastructure. Weassigned the differential in miles driven between a BEV and anICEV to a rental ICEV, reflecting the BEV owner’s need for analternative mode of transportation.In our modeling for the BEV, we also made an adjustment toinclude the need for a replacement battery pack. Based upon therate at which battery performance declines – which negativelyimpacts the range of a BEV – we estimated that the BEV batterypack would need to be replaced between years seven and ten ofBEV’s lifetime. This is consistent with the warranty that BEVmanufacturers offer on their vehicles’ battery packs. We note thatthe residual value of a BEV after 7-10 years may be less than thecost of a new battery pack which could result in salvaging theBEV instead of replacing the battery pack. However, in order tomaintain a direct “apples-to-apples” comparison with ICEVs overa 20 year lifecycle, we modeled a battery pack replacement.Furthermore, we removed the effect of federal and state incentives and subsidies on BEVs and ICEVs, so that our figures wouldreflect the true underlying costs of R&D, manufacturing, ownership and operation, and end-of-life of these vehicles. This includedremoving the state and federal tax component on gasoline pricefor ICEVs, because BEVs do not incur an equivalent tax burden.Finally, we modeled each vehicle over a twenty-year vehiclelifetime and assumed that the total mileage traveled over thatperiod is 150,685 miles. It is important to note that we also take“survivability” into account in our mileage figures (see AppendixB-2). In short, we adjust a vehicle’s annual miles driven by theprobability that the vehicle is still in use. Hence, while NationalHighway Traffic Safety Administration (NHTSA)data indicates thata vehicle will be driven approximately 7,500 miles in Year 20 of itslifetime, the data also indicates that only 9% of vehicles are still inoperation after twenty years. Put another way, 91% of vehicleswill have been permanently retired before reaching Year 20, andwe have weighted our mileage figures to reflect this probability.To do otherwise would assume a fleet in which all vehiclescontinue to be driven for twenty years after entering the market,which is unrealistic given what we know about the true In-Uselifetime of vehicles in the U.S. Based on data from The Idaho National Laboratory (INL) contained in their December 2014report, “Plug-in Electric Vehicle Road Tax Analysis.”6 7
Battery Electric Vehicles vs. Internal Combustion Engine VehiclesTotal Cost of Ownership andTrue Vehicle CostTo arrive at the comparative lifetime costs for BEVs and ICEVs,we used a measure called Total Cost of Ownership (TCO). TCO iscomprised of two major cost categories: those incurred by theoriginal equipment manufacturer (OEM) and those incurred onceownership of the vehicle has transferred to the consumer. TCO isa representation in dollars of how much owning a vehicle will costover the lifetime of the vehicle, and it encapsulates all of the costinputs incurred over the twenty-year lifecycle of a vehicle. Forcosts incurred before the transfer of ownership, we used ameasure called Total Cost of Ownership (TCO). TVC encapsulatesall of the cost inputs that go into making a vehicle, from designing,engineering, and manufacturing, as well as warranty cost andoverhead, and results in the vehicle at the factory door. Onceownership has transferred to the consumer, costs include theIn-Use costs of operating and maintaining the vehicle, and theend-of-life costs associated with disposing of the vehicle (seeAppendix B for a full breakdown of TCO and TVC for the 2015BEVs and ICEVs).higher for the 2015 Compact Passenger and 98% higher for the2015 Mid-Size Passenger. For BEVs, TVC is the largest portion ofTCO by far – breaking out the costs involved in producing a 2015vehicle, TVC for the Compact Passenger BEV was nearly doublethat of the ICEV: 29,164 for the BEV and 17,146 for the ICEV(see Figure 12). For the Mid-Size Passenger, TVC for the BEV was 37,865 and 19,114 for the ICEV (see Figure 13). For the 2015Compact Passenger BEV, the lithium-ion battery pack alone costs 6,900 to produce, accounting for a full 24% of the productioncosts associated with BEV manufacturing.Our study concluded that BEVs were significantly more expensiveto own and operate over the lifetime of a vehicle. For a 2015Compact Passenger Vehicle, ADL found the BEV was 44% moreexpensive than an equivalent ICEV (see Figure 9). For a 2015Mid-Size Passenger Vehicle, the cost impact differential was evenmore pronounced – the BEV was 60% more expensive than acomparable ICEV.In Thousands of Dollars at Present ValueFor the 2015 Compact Passenger Vehicle, TCO is 68,492 for theBEV versus 47,676 for the ICEV, and for the 2015 Mid-SizePassenger Vehicle, TCO is 85,854 for the BEV versus 53,649for the ICEV over the lifetime of the vehicle (see Figures 10 and 11).Our cumulative TCO analysis demonstrates a significant BEV costdisadvantage throughout a vehicle’s lifecycle and this costdisadvantage becomes even greater with the required battery packreplacement between years seven and ten of a BEV’s lifetime.These figures were driven by the underlying costs of manufacturing the vehicle: for BEVs, Total Vehicle Cost (TVC) was 70%8For In-Use costs, we developed a forecast for electricity andgasoline prices over a twenty-year vehicle lifetime, reflecting thecosts associated with operating the vehicle, in order to ensure theaccuracy of our TCO calculations (see Appendices B-3 and B-4).Electricity is forecast to be less expensive than gasoline on a perFigure 9. Total Cost of Ownership over a 20-Year Lifetime fora 2015 ICEV versus an Equivalent BEV10086806860 44%48 60%54In-Use Cost40200True Vehicle CostCompact CompactICEVBEVSource: ADL AnalysisMid-Size Mid-SizeICEVBEV
Battery Electric Vehicles vs. Internal Combustion Engine VehiclesFigure 10. Total Cost of Ownership over a 20-Year Lifetime fora 2015 Compact Passenger ICEV versus an Equivalent BEVFigure 11. Total Cost of Ownership over a 20-Year Lifetime fora 2015 Mid-Size Passenger ICEV versus an Equivalent BEVIn Thousands of Dollars at Present ValueIn Thousands of Dollars at Present ValueICEV BEVTrue Vehicle Cost29.2True Vehicle Cost12.7 14.5Insurance & Financing17.1Insurance & FinancingIn-Use Gasoline/ElectricityMaintenance & Repairs4.49.42.25.5State Fees3.00 4.3Battery Replacement &Home Charging Installation3.410.4Alternative TransportationTotal48In-Use Gasoline/ElectricityMaintenance & RepairsState FeesICEVBEV19.137.915.3 19.04.910.42.35.73.20 5.3Battery Replacement &Home Charging Installation4.512.1Alternative Transportation68Total5486Source: ADL AnalysisSource: ADL AnalysisFigure 12. True Vehicle Cost over a 20-Year Lifetime for a 2015Compact Passenger ICEV versus an Equivalent BEVFigure 13. True Vehicle Cost over a 20-Year Lifetime for a 2015Mid-Size Passenger ICEV versus an Equivalent BEVIn Thousands of Dollars at Present ValueIn Thousands of Dollars at Present ValueICEVBEVCommon Components6.86.8Unique ComponentsExcluding BEV BatteryNon-Production CostsR&D and EngineeringWarrantyICEVBEVCommon Components7.87.84.7 5.7Unique ComponentsExcluding BEV Battery5.0 6.93.14.0Non-Production Costs3.43.8R&D and Engineering1.65.42.00Warranty1.32.606.9BEV Battery1.41.2BEV BatteryTotalSource: ADL Analysis1729Total4.910.21938Source: ADL Analysis 9
Battery Electric Vehicles vs. Internal Combustion Engine Vehiclesmile basis and, in terms of In-Use costs, BEVs are cheaper tooperate than their ICEV counterparts. However, this cost advantage was subsumed by other factors, such as the higher manufacturing costs for BEVs, and the BEV’s need for a replacementbattery pack and an alternative mode of transportation.Ultimately, the high underlying cost of BEVs is a limiting factor intheir future market penetration in the US automotive market. Todate, BEVs represent less than 1% of US vehicle sales and fullyone-quarter of BEV sales are Tesla models sold in California. In10other words, Luxury vehicles sold within a limited geographicregion represent approximately 25% of BEVs sold in the UnitedStates. If BEVs are to become truly competitive in the US, it willbe imperative for manufacturers to reduce the heavy cost burdena BEV poses for the average consumer.
Battery Electric Vehicles vs. Internal Combustion Engine VehiclesEnvironmental Assessment:Global Warming PotentialThere is relatively little controversy surrounding how to measurethe global warming potential (GWP) of ICEVs. Tailpipe emissionsfrom gasoline combustion in an internal combustion enginecombined with the upstream emissions associated with gasolineproduction and distribution contribute the majority of greenhousegas emissions from an ICEV. A reliable range for such lifecycleemissions has been established by a preponderance of studies.By contrast, BEVs present a unique challenge – though thevehicles produce no tailpipe emissions, BEVs do rely on regionalpower plants and grids to charge their batteries. Furthermore,R&D and manufacturing for BEVs relies heavily on a variety ofdifferent inputs – such as heavy metal mining and purification, andbattery cell manufacture (which includes organic solvents andvarious chemical processes) – and these inputs generate differentadverse environmental impacts as compared with those used inthe R&D and manufacturing for ICEVs.Figure 14. GWP Emissions from Battery ManufacturingIn kg of CO2e Emissions per kg of Battery Weight252015Studies that include cell and pack emissions.ADL (green circle) uses the average of this group.105Studies that exclude or have minimal celland pack emissions0Source: ADL AnalysisBy far one of the more controversial aspects of GWP for BEVs isthe production of the lithium-ion battery pack. In order to determine the impact this has on GWP for BEVs, we conducted ameta-analysis of studies that analyzed the greenhouse gasemissions generated by lithium-ion battery pack manufacturing(see Figure 14). It may appear that our assessment is on thehigher end of studies that looked at GWP, but this discrepancy ismainly due to the fact that many studies do not include the impactof manufacturing battery cells into packs on overall GWP forbattery manufacturing. This is an important consideration. By wayof illustration, a paper put forward by Ford Motor Companyanalyzed the environmental impact of battery manufacturing forone of their vehicles.7 For the 2014 Ford Focus BEV, the cellsused in the battery were manufactured by LG Chem in their plantin Ochang, South Korea, and then shipped to a Piston Groupfacility in Michigan, where they were manufactured into packs. By Kim, H.C.; Ahn, S.; Arsenault, R.; Chulheung, B.; Lee, J.; Wallington, T.J. Cradle-to-GateEmissions from a Commercial Electric Vehicle Li-Ion Battery: A Comparative Analysis. Environ.Sci. Technol. 2016. 50 (22), 7715–7722.7not fully including the GWP generated in the pack manufacturingstage, other studies have ignored the emissions from a crucialstage in battery ma
Battery Electric Vehicles vs. Internal Combustion Engine Vehicles 3 impact of car ownership. As detailed in a recent series of investiga - tive reports by the Washington Post, much of the cobalt and graphite entering the supply chain for lithium-ion batteries is sourced from poorly regulated and heavily polluting mines in Congo 1