Transcription
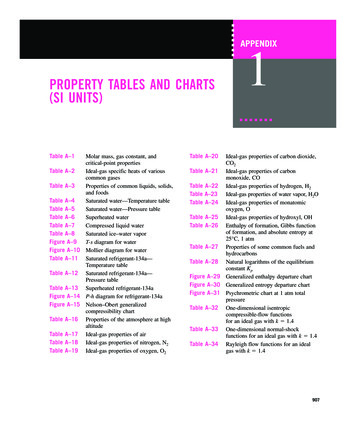
Table of ContentsGrowing Region . 3Population, Households, Growth . 3Regional Budget . 5Paramedic Services Budget . 6Police Services Budget. 6Fire Services Budget . 7WRPS Human Resources . 8Staffing Levels . 8Overtime.11Staff Attrition .12Member Wellness .14Increasing Call Demand and Complexity .18Calls for Service .18Overdoses .24Road Safety .25Changes in Crime .27Total Crime Rate .27Property Crime Rate .28Violent Crime Rate .29Total Crime Severity Index .30Non-Violent Crime Severity Index .31Violent Crime Severity Index .32Firearm Violations .33Shootings .34Arrests and Charges.35Increasing Investigative Complexity .36Average Criminal Workload per Officer.36Decreasing Clearance Rates .37Judicial Authorizations .38Warrants.39Case Law Regarding Technology, Warrants and Staffing .40WRPS Impacts from Provincial Justice COVID-19 Measures .411
Changes in Judicial System.43Mandatory Training Requirements .43Provincial and Federal Costs .43Enhanced Practical Training .44Enhanced Academic Training .44Pivoting Organization .46Equity, Inclusion and Diversity .46Efficiencies Over the Last Five Years .46Partnerships .56Organizational Restructuring .57New Strategic Business Plan 2021-2023 .58Police Budget .62Average Police Cost per Capita .62Technological Infrastructure .63Future Public Safety Communications Centre .64Other Budget Drivers .65Budget Mitigation Strategies .65Ten-Year Capital Budget Forecast .672021 WRPS Operating Budget Position .68Implications of Reduced Budget .692
Growing RegionThe continued vitality and growth of Waterloo Region has generated increased demands onpolice services. Population growth and the increasing complexity of crime in our Region indicatethat the demand for policing and the challenges of policing will continue to rise.Population, Households, GrowthFigure 1 Past Population and Population Projection for Waterloo Region. Source: Region of Waterloo. 3Waterloo Region is the 10th largest Census Metropolitan Area (CMA) in Canada, with ayear-end population of 617,879 in 2019.Over the past 15 years, the Region’s population has grown an average of 1.58% per year.Total household growth over the last 15 years has grown an average of 1.62%.The Province’s Growth Plan projects that Waterloo Region’s population will reach 742,000by 2031.
Year-end 2019 Population and Household Estimates for Regionof WaterlooPopulation700,000Total households2020 Popuatlion630,900600,000500,000 87,000(16%)2010 Population543,900400,000300,000200,000 31,830(16%)2010 100,0002020 4201520162017201820192020(f)0Figure 2 Year-end 2019 Population and Household Estimates for Region of Waterloo. Source: Region of Waterloo. In the last decade, the population growth rate increased by 1.5% each year. The highestrate of growth occurred between 2019 and 2020 at 2.1%.Total number of dwelling units created70006000500040003000200010000Units% 6%-29%-18%108%-46%Figure 3 Total number of dwelling units created. Source: Statistics Canada, Table: 34-10-0066-01. *Includes data upto October 2020. 42019 saw the highest increase to date, at 108% increase in the total number of dwellingunits created.Between 2011 and 2019, the number of dwelling units increased by 86%, addingapproximately 3750 units per year.
Regional BudgetThe Region of Waterloo is the upper tier government in a two-tiered municipal governmentsystem. Regional government manages services such as emergency medical services (EMS) orparamedics, policing services, emergency shelters, social assistance and housing, transit,waste and water. The demands for these types of essential services grow along with thepopulation and growth of the Region.Figure 4 Regional Tax Levy/Tax Supported Program Budgets, 2010-2020. Source: Regional Budget Books. 5The Waterloo Regional Tax Levy (inclusive of WRPS) has increased steadily since 2010 byan average of 4.5%. Between 2019 and 2020, it increased 5.7%.
Paramedic Services BudgetFigure 5 Regional Paramedic Services Budgets, 2010-2020. Source: Regional Budget Books. The Region of Waterloo Paramedic Services budget has increased steadily since 2010 byan average of 8.2%. Between 2019 and 2020, it increased 8.7%.Police Services BudgetFigure 6 Regional Police Service Budgets, 2010-2020. Source: Regional Budget Books. 6The Waterloo Regional Police Service budget has increased steadily since 2010, by anaverage of 4.7%. Between 2019 and 2020, it increased 6.2%.
Fire Services BudgetFire Services are provided by all seven lower tier municipalities. The following graph shows theircombined net cost since 2010.Figure 7 Seven Municipal Fire Service Actuals Combined, 2010-2020. Source: Municipal FinancialInformation Return (FIR). 7The combined seven fire services actuals have also increased steadily since 2010, by anaverage of 3.2%.Between 2018 and 2019, the combined fire services actuals increased 8.9% (assumingNorth Dumfries remained flat between 2019 and 2020 as their information is not yet updatedin the FIR).
WRPS Human ResourcesHuman resources, including salaries and benefits, account for approximately 90% of theaverage police budget. Overtime, sick time, and absences all impact the productivity andwellness of our members. Talent Acquisition, including attracting, hiring, and retaining membersare important components of managing human resources, along with creating a modern cultureof wellness and work-life balance.Staffing LevelsWhile the regional population and total households has been increasing in Waterloo Region, thenumber of officers per 100,000 population has not kept pace. In 2019, WRPS had 757 actualpolice officers and 388 civiliansRate of WRPS Police Officers Per 100,000 Population, 2010-2019Rate Per 100,000 7YearFigure 8 Rate of WRPS Police Officers per 100,000 Population, 2010-2019. Source: Statistics Canada Table 35-100077-01. 8The police officer rate per 100,000 population in 2019 was down to 131, a decrease of 1%compared to the 2018 rate. This is below the national and provincial rates of 183 and 174respectively.WRPS has regularly reported police officer to population rates that are lower than thenational average.In 2019, Waterloo Region had the lowest police officer to population rate since 2003 whenthere were 129.9 officers per 100,000.
Figure 9 2019 Rate of Police Officers in Municipalities Serving Populations Greater than 100,000. Graph is ordered from highest tolowest rates. WRPS is highlighted in blue. The dark gray represents the top 12 largest Ontario municipal police services. No datawas provided for Hamilton. Source: Statistics Canada Table 35-10-0077-01, 2020. Among the fifty police services serving municipalities with populations greater than 100,000across Canada, WRPS continues to be below the average of 148 officers per 100,000.Of these 50 municipal police services, WRPS ranks 35th by rate of police officers per 100,000.In 2018, WRPS ranked 30th by rate of police officers per 100,000.WRPS is the 13th largest municipal police service in Canada; 6th largest in Ontario.In comparison with the 12 largest municipal police services in Ontario (shown in in dark gray),WRPS has the 3rd lowest rate of officers per population.9
Figure 10 2019 Rate of Civilian Employees for Municipalities Serving Populations of Greater than 100,000. Graph is orderedfrom highest to lowest rates. WRPS is highlighted in blue. The dark gray represents the top 12 largest Ontario municipal policeservices. No data was provided for Hamilton and RCMP services were removed due to rates near zero. Source: StatisticsCanada Table 35-10-0077-01, 2020. 10Over recent years, WRPS has been a leader in using civilian professionals for work thatdoes not require the authority or training of a police officer. Civilian members offerspecialized skills in areas such as information technology, business and crime analytics, andemployee wellbeing. The salaries of civilian members are generally lower than swornmembers within a police service.WRPS has been consistently above both national and provincial comparators when it comesto the rate of civilians per population; in 2019 WRPS had 67 civilians per 100,000population.WRPS ranks 5th of the largest 12 Ontario municipal police services for the number ofcivilians per population as shown in dark gray.
OvertimeThrough various initiatives in 2020, such as a new shift schedule and Regional SchedulingTeam, WRPS has successfully reduced overtime in 2020 by 48% to date.As shown in the monthly overtime graph below, overtime is often connected to eventsrequiring significant resources such as St. Patrick’s Day in March and Homecoming inSeptember.The Voice Radio Contingency Plan, where two officers per vehicle were deployed for safetyuntil the new radio system was operational, impacted overtime demands in 2019 and 2020.For reference, a full-time employee will work 2,080 hours over the course of a year. WRPS Annual Total Overtime Hours, 2010 - 2016201720182019Figure 11 WRPS Annual Total Overtime Hours, 2010-2020. Source: WRPS Finance and Assets.Figure 12 WRPS Monthly Overtime Hours, 2017-2020. Source: WRPS Finance and Assets.112020 toNov 30
Staff AttritionWRPS aims to fill allotted “intakes” of new police recruits at the Ontario Police College (OPC)four times each year.Figure 13 Uniform Recruitment. Source: WRPS Human Resources. The Human Resources team make great efforts in marketing our Service and the Region ofWaterloo to a wide range of applicants with recruitment nights, information sessions, jobfairs, and community outreach.Investing in a new police officer and civilian professional is a significant commitment of timeand resources.Investing in a new Police ConstablePrior to hiring, at least 85 hours of time are committed to processing one applicant through theprocess and all the necessary background checks before offering a new Constable position: One Sergeant and three Constables are assigned and dedicated full time to recruitment inthe Human Resources Branch.There are a variety of selection stages including a Local Focus Assessment, an EssentialCompetencies Interview, and background security clearances which must be passed.A psychological screening with a medical practitioner is arranged.Prior to a final job offer, a thorough background investigation is completed which includesinterviewing references, conducting in-home visits, and other checks.Once hired, it takes about 10 months of training before a new officer is ready to serve thecommunity on patrol. It is a significant investment of time and resources: 12In the Training and Education Branch, an Academic team of one Sergeant and twoConstables, along with Constables trained in Practical Skills work together to provide theWRPS police training for new recruits.WRPS runs three weeks of training before the OPC program.
The OPC recruit program is 13 weeks. WRPS has at least one full time seconded officer asa liaison for new recruits at the College (with cost recovery by the Ministry of the SolicitorGeneral).Following OPC, WRPS offers five additional weeks of training on practical skills, with expertsfrom specialized areas all across the Service.New recruits are then paired with a qualified Field Development Officer (FDO) for at least 48twelve-hour shifts for on the job training. RetirementsIn recent years WRPS has experienced an increasing number of retirements due to a largecohort of new hires in the late eighties and early nineties.Retirements by Quarter35302520151050Q1Q2Q3Q42019 (Total 58 Retirements)Number of Civilian RetirementsQ1Q2Q3Q42020 (Total 35 Retirements)Number of Sworn RetirementsFigure 14 Retirements by Quarter. Source: WRPS Human Resources. 13Steady consistent hiring practices offer improved opportunity for the organization’s capacityto recruit, train, and manage resources.
Member WellnessOur members are our greatest resource, and policing takes its toll on members’ wellness. In2017, WRPS created a Wellness Unit dedicated to supporting the overall wellness of ouremployees and their families.Figure 15 Average Days of Absence by Quarter. Source: WRPS Human Resources; Statistics Canada Table 14-100196-01. 14With a modernized short and long term sick leave program, and a focus on memberwellness, the average number of sick days for WRPS members is declining and the secondand third quarters of 2020 dropped below the private sector average.
Figure 16 Accommodations by Quarter. Source: WRPS Human Resources. The improvements in accommodations are a result of the Return to Work (RTW)improvements made in 2017 onwards, including the addition of an Occupational HealthNurse and new reintegration strategies.WRPS continues to offer accommodation options for members facing a variety of challengesto safely and sustainably stay at, or return to, work pursuant to employment law.Figure 17 Occupational Absences by Quarter. Source: WRPS Human Resources. 15The nature of the policing profession comes with risks. On average, in 2020 WRPS has had21 members absent due to occupational injury however these numbers are 15% lower thanthe previous year. Occupational Stress Injuries (OSI) account for the majority of WSIBclaims.
Figure 18 Leaves of Absence by Quarter. Source: WRPS Human Resources. Pregnancy and Parental leaves of absence are protected statutory leaves, and as suchmust be granted by the employer. Parental leaves tend to increase over the summermonths.Figure 19 Health and Safety by Quarter. Source: WRPS Human Resources. 16There is a notable increase in hazard reporting. Supervisors and members are becomingmore aware of hazards and are reporting them at a greater rate. The increase in reporting isdue to training and monitoring monthly duty report emails.The surge in Hazards for Q2 2020 is due to COVID-19 exposures.Types of health and safety reported incidents include: struck/caught; overexertion/strain;harmful substances/environmental; fall; or assault.
Figure 20 Outreach Calls by Quarter. Source: WRPS Human Resources. 17Outreach calls to members have increased in 2020, including calls to members who were offwork for COVID-19 related reasons. These calls are made by the Wellness Unit in relation toon-duty incidents/significant calls and to check in on members off work.
Increasing Call Demand and ComplexityOver the last decade, Waterloo Region has seen an increase in demand on policing servicesthat outstrips the population growth.Calls for ServiceOccurrences are generated to dispatch a call for service and to track demands for policeservices. Occurrences can be generated by calls from the public, online reports and/or initiatedby an officer. The type of call is selected based on the best information available at the time.Many occurrences are not criminal in nature and do not result in a criminal charge; however,significant police resources are required to respond. Examples of high volume occurrencesinclude unwanted persons, driving complaints, disputes, disturbances, domestic disputes,suspicious persons, suspicious vehicles, and mental health related calls for service.Figure 21 Citizen Generated Calls (CGC) and Total Computer Aided Dispatch (CAD) Occurrences, 2010-2019.Source: WRPS Niche Records Management System (RMS). 18The data table displays the raw totals of each type of event, while the percentages indicatethe proportion of the total. For example, there were 94,762 citizen generated calls (CGCs) in2010 or 25% of the total occurrences generated in the CAD system that year.On average, the CGCs grew 3% per year. Within the decade, the largest growth of CGCsoccurred between 2018 and 2019 at 7%.Overall, the number of CGCs rose by 25% between the years of 2010 to 2019. Bycomparison, the population of the Region grew by 16% over the same time period.Within the decade, the most significant growth occurred between 2010 – 2011 where thetotal CAD occurrences rose by 8%. Since then, the total CAD occurrences has hoveredaround 300,000 annually.
Unwanted Persons, 2010-2020 11201220132014201520162017201820192020 toQ3Figure 22 Unwanted Persons, 2010-2020 Q3. Source: WRPS Niche RMS as of December 1, 2020.This type of call includes unwanted persons and trespassing at commercial and residentialproperties as well as schools and other institutions.In 2019, on average an “Unwanted Person” call came into our dispatch every 53 minutes.(Source: WRPS 2019 Annual Report.) Driving Complaints, 2010-2020 32014201520162017201820192020 toQ3Figure 23 Driving Complaints, 2010-2020 Q3. Source: WRPS Niche RMS as of December 1, 2020. 19In 2019, on average a “Driving Complaint” call came into our dispatch every 52 minutes. Itwas also the call type that experienced the biggest jump in online reporting, up 26%.(Source: WRPS 2019 Annual Report.)Driving complaints dropped slightly during 2020 due to there being fewer drivers on the roadearly during the pandemic.
Disturbances and Disputes, 2010-2020 201320142015Disturbances20162017201820192020 toQ3DisputesFigure 24 Disturbances and Disputes, 2010-2020 Q3. Source: WRPS Niche RMS as of December 1, 2020. 20Disturbances are usually dispatched as a priority one call and may involve a physicalaltercation between one or more persons. Due to the risk of injury and property damage,disturbances usually require more than one police officer to respond.Disputes can include neighbor or landlord/tenant disputes, disputes at commercial locationsor workplaces, and public demonstrations.Domestic, familial, and elder disputes are their own occurrence types.
Domestic Disputes, 2010-2020 4201520162017201820192020 toQ3Figure 25 Domestic Disputes, 2010-2020 Q3. Source: WRPS Niche RMS as of December 1, 2020.Domestic disputes require a minimum of two officers to respond and often require additionalresponse from investigators in the Intimate Partner Violence Unit.Domestic disputes have increased during the pandemic and are expected to exceed 2019 innumber of occurrences. Suspicious Persons and Vehicles, 2010-2020 Suspicious Persons201520162017201820192020 toQ3Suspicious VehiclesFigure 26 Suspicious Persons and Vehicles. Source: WRPS Niche RMS as of December 1, 2020. 21There has been a steady increase in suspicious person occurrences over the last decadewith a 59% increase between 2010 and 2019.Despite there being fewer drivers on the road during 2020, suspicious vehicle occurrencesare expected to be near what was seen in 2019.
Mentally Ill Occurrences, 012201320142015Mentally Ill Apprehended and Voluntary Transport20162017201820192020Other Mentally Ill OccurrencesFigure 27 Mental Health Occurrences, 2010-2020. Source: WRPS Niche RMS as of January 11, 2021.According to the Semi Monthly Statistical Reports for September, 2020, both UnwantedPersons and Mental Health occurrences are above the five year average and expected toexceed 2019 numbers by the end of the year.More than half of the crisis calls received are also responded to by the IMPACT team whichis a partnership between police and the Canadian Mental Health Association. More detailsare in the Partnerships section of this document. Attempt Suicide Occurrences, 2010-2020 2017201820192020 toQ3Figure 28 Attempt Suicide Occurrences, 2010-2020 Q3. Source: WRPS Niche RMS as of December 1, 2020. 22Attempt suicide occurrences closely follow the pattern of mental health occurrences and theresponse will often include members of the IMPACT team.
Selected Sudden Death Occurrences, 2010-2020 2017201820192020 toQ3Accidential OverdoseFigure 29 Selected Sudden Death Occurrences, 2010-2020 Q3. Source: WRPS Niche RMS as of December 1, 2020. 23Police are often the first on scene of suicide and accidental overdose calls and are requiredto ensure the death is not suspicious.Sudden death occurrences require a response from Patrol, IMPACT team, Detectives and/orMajor Crime investigators as well as the Coroner.Sudden Death occurrences do not represent an official cause of death and is based on thebest information available to the officer at the time of the occurrence.
OverdosesThe opioid crisis is a growing and evolving problem occurring nationally, provincially and locally.The Waterloo Regional Police Service and Region of Waterloo Paramedic Services arecollaborating to monitor suspected opioid related overdoses. The chart below includes thenumber of suspected opioid overdoses where police and/or paramedics have responded.Figure 30 Overdoses in the Region of Waterloo, 2016 – 2020. Source: WRPS, Waterloo Region Integrated DrugStrategy.This data includes the number of suspected opioid overdoses where police and/orparamedics have responded. Fatal and non-fatal overdoses are included and the data issubject to change as findings may be preliminary.Please note that the 2018 data on fatalities is based on preliminary data from the Office ofthe Provincial Coroner. The 2019 data is as reported by WRPS. WRPS began equipping officers with Naloxone in January 2018. Naloxone is a life-saving drugthat can temporarily reverse the effects of an opioid overdose and allow enough time to get theperson medical help.Non-FatalFatalTotalWRPS Administered Naloxone201820193659143763Figure 31 WRPS Administered Naloxone. Source: WRPS Niche RMS. 24202045348WRPS officers administering Naloxone have saved 140 lives in our community since 2018.
Road SafetyRoad safety has been a top community priority for over a decade. Much of the work done by theofficers in the Traffic Services Unit is proactive in nature and is focused on reducing the impactthe Fatal Four offences have on the community. The Fatal Four offences included: (1) Impaireddriving, (2) Speeding/aggressive driving, (3) Seatbelts use, and (4) Distracted driving.Impaired DrivingSpeedingStuntAggressive DrivingDangerous DrivingSeatbeltsDistracted DrivingOther HTA 23,764Road Safety ,79673,11419,687Total Figure 32 Road Safety Charges. Sources: WRPS Traffic Services. WRPS Niche Records Management System, EMVC and Ministry of Transportation Inquiry Services System (MTO/ISS) as of January 4, 2021.Highway Traffic Act (HTA) Impaired Driver SuspensionsOver 50 BAC (HTA 48)90 DAY SUSP. FOR 80 ORREFUSAL* (HTA 48.3)90 DAY FOR DRECONFIRMEDIMPAIRED**(HTA 48.3.1)Other HTA SuspensionsTotal HTA 374697177202472055767827271824268Figure 33 Highway Traffic Act (HTA) Impaired Driver Suspensions. Source: WRPS Traffic Services. Ministry ofTransportation Suspension and Impoundment Management System (SIMS) as of January 4, 2021. *90 daysuspensions that were issued and does not included suspensions completed via warrant. ** 90 day suspensions thatwere issued and does not include suspensions completed via warrant or DRE (Drug Recognition Evaluator)evaluations that were ruled out. Cancelled suspensions/impoundments are not included in this table. 25Drug related impaired driver suspensions have increased significantly in recent yearsdespite extensive public campaigns and media efforts to educate drivers on the dangers ofimpaired driving.Laying charges related to impaired driving, whether due to alcohol or drugs, requiresspecialized training and equipment; WRPS currently has 12 officers trained as DrugRecognition Evaluators.
Fatal CollisionsYearly TotalFatal Collisions where at Least1 Fatal Four Offence wasdetermined to be a 7Figure 34 Fatal Collisions. Source: WRPS Traffic Services as of January 4, 2021. 26When investigating a fatality, the investigating officer will spend 40-60 hours on a single fatalcollision.In addition to the inve
across Canada, WRPS continues to be below the average of 148 officers per 100,000. Of these 50 municipal police services, WRPS ranks 35 th by rate of police officers per 100,000. In 2018, WRPS ranked 30 th by rate of police officers per 100,000. WRPS is the 13 th largest municipal police service in Canada; 6 th largest in Ontario.