Transcription
Chapter 3, Using ExcelBar Graphs, Histograms, Scatterplots, Time-Series GraphsEach topic has its own page or you can go directly to the videos. Making a Simple Bar Graph from a Table2Play Video . Making a Histogram from a Frequency Table2Play Video . Making a Frequency Distribution and Histogramfrom Raw Data with the Analysis ToolPak3Play Video . Making a Scatter Plot4Play Video . Making a Time-Series Graph4Play Video . Getting and Running the Analysis ToolPak and StatPlus LE15
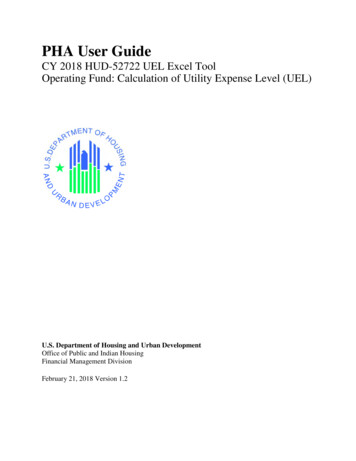
Making a Simple Bar Graph from a TablePlay Video .This video shows you how to make a bar graph from a table with one qualitative variable (tree type)and one quantitative variable (tree height). It is really easy. 1. Enter the qualitative variable names in the first column and in the quantitative variable numbersin the second column.2. Now highlight both columns.3. Click on Insert then choose Column from the Charts menu, and choose the first option.4. The bar graph can be edited to look a lot better by clicking on the graph and choosing variousoptions from the chart tools menu.Play Video . Making a Histogram from a Frequency Table 1. The directions are the same as above only the first column will contain the classes. Be sure thiscolumn is formatted as text. If, for some reason, Excel thinks these are numeric, you will get aclustered histogram which is not what you want.2. Technically, a histogram’s bars are adjacent to each other. To do this, right click one of the barsin the bar graph and choose Format Data Series. From here you can set the Gap Width to zeroand put in borders. After a little playing around, you get a graph that looks like the histogramon the above.2
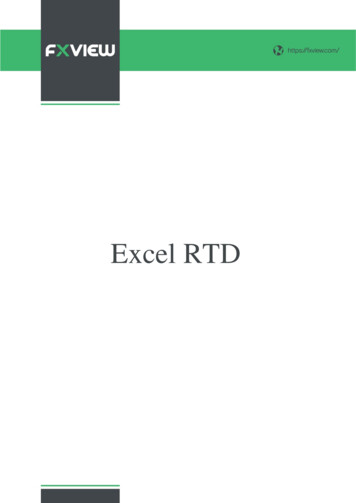
Making a Frequency Distribution and Histogramfrom Raw Data with the Analysis ToolPak Play Video . 1. Put the data in a single column.2. Create a column with the bin values (class boundaries).3. Click on Data Analysis section under the DATA tab.4. Click on Histogram.5. In input range put in the cells that contain the data.6. In the bin range put in the cells that contain the bin values (class boundaries).7. Do not click labels unless you have included labels in the data entries.8. Put in a range of cells for the output range (or click new worksheet ply)9. Check the include chart option10. Then Click OK.11. Your frequency distribution and histogram should appear where you told Excel to place it.12. In order to make the frequency distribution table look like an actual frequency distribution, youshould edit the left column. Instead of the class boundaries (bin values), replace these with theactual classes such as 30-39, 40-49, . . . This will automatically change the x-axis labels in thegraph.13. The histogram can be edited to look a lot better by clicking on the graph and choosing variousoptions from the chart tools menu. I like the option which includes axis titles and a main title.14. Technically, a histogram’s bars are adjacent to each other. To do this, right click one of thebars, and choose Format Data Series. From here you can set the Gap Width to zero and put inborders.15. The trickiest part is getting the x-axis to look good. By default, the axis has the class boundariesunder each bar. This is confusing. By editing the frequency table (a few steps back) the axislabels now have the actual classes. If you ask me, that is good enough. If you want to place theactual class boundaries on the x-axis, you must delete the x-axis label then insert a text-box withthe appropriate boundary values positioned in just the right places. This is tricky and has to bere-scaled if you change the size of the graph. I’d rather have the actual class ranges under eachbar and save myself the headache of creating a custom text box.3
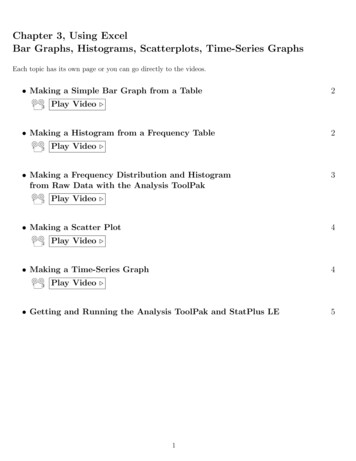
Making a Scatter PlotPlay Video .Cricket Chirps -vs- TemperatureCricket Chirps (per minute)250 200150100500020406080100120Temperature (in Fahrenheit)1. Highlight the x and y data columns.2. Click Insert from the menu bar and choose Scatter (dots no lines) from the Charts menu.3. You can choose styles and add labels using the design tab from the Chart Tools menu. Making a Time-Series GraphPlay Video . 1. You can create a time-series plot with the x variables as some time unit. In this case, instead ofchoosing Scatter, you choose, Line. Warning: If you are using dates, Excel will take control ofthis to some extent - Be Careful. You can actually use the Scatter option here but the automatedx-axis labeling is not as friendly.2. Or, you can just highlight the y variables, click insert from the menu bar and choose Line. Thiswill give you the sequential values of y with x-values starting at one and counting from there.4
Getting and Running the Analysis ToolPak and StatPlus LE– Installing the Analysis ToolPak (Windows Only)1.2.3.4.5.6.7.Open a blank Excel spreadsheet.Click on the windows icon (pre 2010) or the file tab (2010 ).Choose Excel Options (pre 2010) or just options (2010 ).Choose add-ins.In manage (bottom of window), choose Excel Add-ins and click Go.Check the box that says Analysis ToolPak and click OK.After you load the Analysis ToolPak, the Data Analysis command is available under the Datatab. It should be the far right option.– Getting StatPlus LE (Mac Only)As of this writing, if you are running Excel 2008 or higher on a Mac, the Analysis ToolPak isnot available. There is an application called StatPlus:mac LE which is a free version of the fullStatPlus application. It can handle most of the tasks performed by the Analysis ToolPak and thefull version is probably superior - but that costs money.Once you download the software from le/,1.2.3.4.5.6.Run StatPlus from the Applications Folder.If you don’t already have Excel open, it will open it for you.You will run the commands from the StatPlus menu (top menu bar).Choose the appropriate cells from the Excel worksheet containing the data.The results are printed to a separate Excel worksheet.You can then cut and paste these results in the Excel Worksheet that contains the data.5
Chapter 3, Using Excel Bar Graphs, Histograms, Scatterplots, Time-Series Graphs Each topic has its own page or you can go directly to the videos. Making a Simple Bar Graph from a Table 2 Play Video . Making a Histogram from a Frequency Table 2 Play Video . Making a Frequency Distribution and Histogram from Raw Data with the Analysis ToolPak 3 .