Transcription
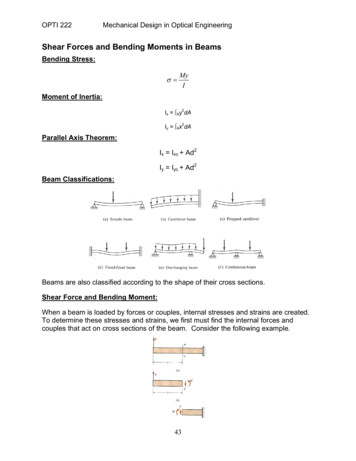
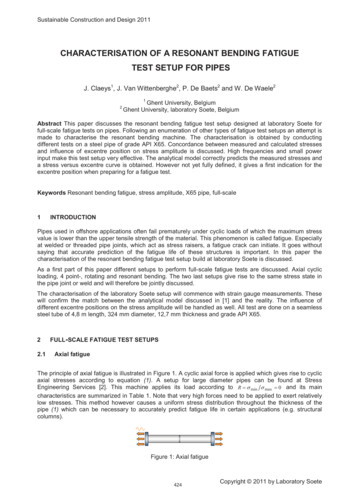
Sustainable Construction and Design 2011CHARACTERISATION OF A RESONANT BENDING FATIGUETEST SETUP FOR PIPESJ. Claeys1, J. Van Wittenberghe2, P. De Baets2 and W. De Waele212Ghent University, BelgiumGhent University, laboratory Soete, BelgiumAbstract This paper discusses the resonant bending fatigue test setup designed at laboratory Soete forfull-scale fatigue tests on pipes. Following an enumeration of other types of fatigue test setups an attempt ismade to characterise the resonant bending machine. The characterisation is obtained by conductingdifferent tests on a steel pipe of grade API X65. Concordance between measured and calculated stressesand influence of excentre position on stress amplitude is discussed. High frequencies and small powerinput make this test setup very effective. The analytical model correctly predicts the measured stresses anda stress versus excentre curve is obtained. However not yet fully defined, it gives a first indication for theexcentre position when preparing for a fatigue test.Keywords Resonant bending fatigue, stress amplitude, X65 pipe, full-scale1INTRODUCTIONPipes used in offshore applications often fail prematurely under cyclic loads of which the maximum stressvalue is lower than the upper tensile strength of the material. This phenomenon is called fatigue. Especiallyat welded or threaded pipe joints, which act as stress raisers, a fatigue crack can initiate. It goes withoutsaying that accurate prediction of the fatigue life of these structures is important. In this paper thecharacterisation of the resonant bending fatigue test setup build at laboratory Soete is discussed.As a first part of this paper different setups to perform full-scale fatigue tests are discussed. Axial cyclicloading, 4 point-, rotating and resonant bending. The two last setups give rise to the same stress state inthe pipe joint or weld and will therefore be jointly discussed.The characterisation of the laboratory Soete setup will commence with strain gauge measurements. Thesewill confirm the match between the analytical model discussed in [1] and the reality. The influence ofdifferent excentre positions on the stress amplitude will be handled as well. All test are done on a seamlesssteel tube of 4,8 m length, 324 mm diameter, 12,7 mm thickness and grade API X65.22.1FULL-SCALE FATIGUE TEST SETUPSAxial fatigueThe principle of axial fatigue is illustrated in Figure 1. A cyclic axial force is applied which gives rise to cyclicaxial stresses according to equation (1). A setup for large diameter pipes can be found at StressEngineering Services [2]. This machine applies its load according to R V min V max 0 and its maincharacteristics are summarized in Table 1. Note that very high forces need to be applied to exert relativelylow stresses. This method however causes a uniform stress distribution throughout the thickness of thepipe (1) which can be necessary to accurately predict fatigue life in certain applications (e.g. structuralcolumns).Figure 1: Axial fatigue424Copyright 2011 by Laboratory Soete
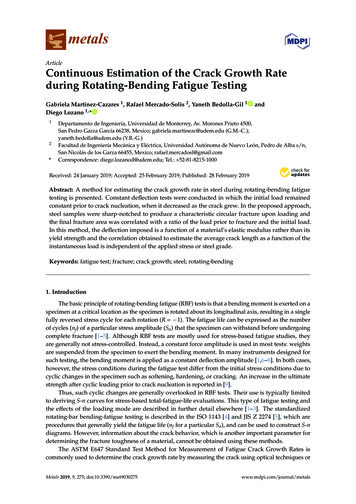
Sustainable Construction and Design 2011V 2.2FSDo t(1)Four point bending fatigueThe schematics of a 4 point bending test setup are given in Figure 2. This test is widely used to determinefatigue life of risers and columns. The cyclic load is now exerted perpendicular to the pipe.12936o’clockFigure 2: 4 point bending fatigueDetails of two setups have been found in literature. One setup was used to apply loads to relatively smalldiameter pipes with a load ratio R 1 [3] and the second one for larger diameter pipes but with a loadratio R 0 [4]. The characteristics of both setups are again given in Table 1.In between the load points the bending moment remains constant. The pipe undergoes a cyclic load with astress amplitude at the outer fibres at 6 and 12 o’ clock calculated according to the formulas (2,3,4) in caseof R 1 . Hence there are some important differences with the axial fatigue setup. The stress is not divideduniformly throughout the thickness and not all points on the circumference see the same load.MI2.32.3.1F (L 2 -L 1 ) /2MDoV2IS( D o 4 Di 4 )64(2)(3)(4)Rotating and resonant bending fatigueRotating bending fatigueA constant load is applied perpendicular to the pipe which is rotated to introduce time dependency. Thesame formulas (2,3,4) can be applied for this setup. Again a constant bending moment is obtained inbetween the load points. The only difference is that every point at the outer fibre will now be subjected tothe same cyclic stresses, shifted in time. Given that the joint is placed at the centre of the setup, it will besubjected to exact the same stress state as in a resonant bending fatigue setup (Figure 3).Figure 3: Rotating bending fatigueTwo setups were found in literature. In the first, build and designed by Petrobras and Coppe, an additionalaxial load can be superimposed to the bending moment. It is suitable for relatively small diameters [5].Thesecond is used to test larger diameter pipes and was constructed by the University of Oklahoma [6, 7]. Anadditional axial load can be superimposed here as well. Notice that applying an additional axial force doesnot have any effect on the oscillating character of the stresses. It results in a non zero mean stress andallows testing with different load ratios. The characteristics are given in Table 1 where reported workingvalues are listed for the second setup whereas actual maximum capacity values are listed in all othercases.2.3.2Resonant bending fatigueAs an example of a resonant bending fatigue setup the laboratory Soete machine, which is the subject ofthis paper, is discussed (Figure 4). Similar setups are used at Stress Engineering Services[8, 9], TWI425Copyright 2011 by Laboratory Soete
Sustainable Construction and Design 2011[10, 11] and EWI [12]. The pipe is excitated according to its first eigenmode by means of a rotatingexcentric mass. In the absence of axial preload the stress ratio is thus R 1 . Again, every point at theouter fibre sees the same cyclic stresses shifted in time. However, an area where the bending moment isconstant (as is the case in the rotating bending setup), does not exist anymore. A more detailed descriptionof this setup can be found in [1].As can be seen in Figure 5, the bending moment is now a fluent line which reaches its maximum at thecentre of the tube while the supports are positioned at the nodes of the pipe’s first bending mode. Theprevious remark that the joint at the centre of the tube will be subjected to the same cyclic stresses as inthe rotating bending test setup is thus confirmed. Given that the same stress amplitude is constructed. Acertain stress amplitude is constructed by altering the position of the excentric mass. The characteristics ofour resonant bending fatigue machine are also given in Table 1. The pipe is pressurized with water to lowerthe eigen frequency and to detect fracture as pressure drops. Due to this pressure, a small axial preload isapplied.Figure 4: Labo Soete resonant bending fatigue test setupFigure 5: Resonant bending fatigueSetupD o (mm)L (m)t (mm)F (kN)M (kNm)V max (MPa)f (Hz)Axial fatigue [2]351-8134,5-9,111,1-25,4185/15,11,0R -1 [3]114,31,28,6/66,3944,80,1R 0 152,02,0Resonant bending[1]152,4-508,03,7-5,740-5,7//175,020-404 point bendingRotating bendingTable 1: Characteristics of test setups reported in literature426Copyright 2011 by Laboratory Soete
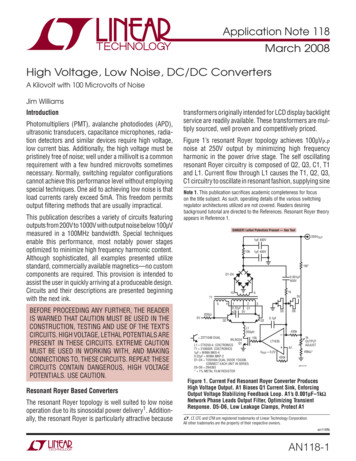
Sustainable Construction and Design 2011The advantages of the resonant bending machine when compared to rotating bending setups are thehigher possible testing frequencies and the smaller power usage. The resonant bending setup usesbetween 0,33 kW and 5,9 kW and is driven by a motor with a nominal power of 7,5 kW whilst the rotatingbending setup needs a motor of 22,4 kW nominal power for a test with a lower maximum stress and at areduced testing speed [6, 7].3FURTHER CHARACTERISATION OF THE LABORATORY SOETE RESONANT BENDINGFATIGUE TEST SETUP3.13.1.1Stress amplitudeTheoretical versus measured stressesA semi-analytical theoretical model has been developed to predict the pipe’s deflection and stressamplitude at the pipe’s mid section, in function of different characteristics of the setup [1]. Predicted stressamplitudes are compared with experimentally determined values derived from strain gauge measurementsat the mid- section of the pipe. This is illustrated for a 75 excentre position in Figure 6.Figure 6: Theoretical versus measured stress amplitudeA good correspondence between the measured and theoretical stress values is observed, except for thehigher frequencies. This is explained by the damping effect which is not accounted for by the theoreticalmodel.3.1.2Influence of varying excentre positionThe influence of altering the excentre position is measured with five strain gauges mounted at symmetricalpositions with respect to the mid-section (Figure 7).427Copyright 2011 by Laboratory Soete
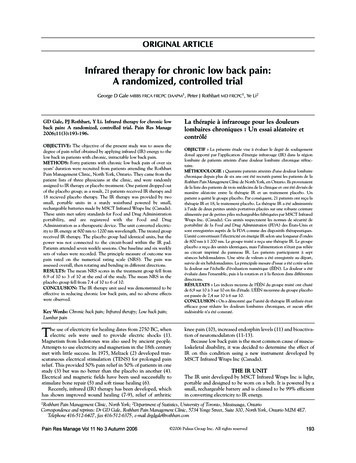
Sustainable Construction and Design 2011Figure 7: Position strain gauges (top view setup)In Figure 8 the results of the strain gauge measurements corresponding to one particular excentre position(60 ) are illustrated. The strains are recalculated to overall stress by multiplying with the E modulus of thepipe metal.Figure 8: Stress amplitude at 60 excentre position, calculated from strain gauge measurementsThe asymmetry in the setup due to the presence of the motor at the right end is clearly visible. This resultsin higher stresses at positions 5 and 4 when compared to positions 1 and 2, completely according toexpectations. In a future development a comparison between the experimentally asymmetry (Figure 8) andthe theoretical asymmetry that is taken into account in the semi-analytical model will be made. Furthermore,equivalent graphs can be build for each excentre position thus evaluating the influence of an excentreposition alteration.The machine excentre design is illustrated in Figure 9. The force exerted on the pipe varies from zero at 0 excentre position to 2F at 180 degrees excentre position according to the formula given in (5) where Dequals the excentre position. This force is proportional to the stress amplitude in the pipe. Thus a fittingbetween these curves and the stress data measured at the centre of the pipe for different excentrepositions can be used to determine the constants C(F) in (6).Measurements for 20 up to 125 are illustrated for various frequencies (Figure 10). By taking thelogarithmic value of the different constants used to fit the cosinus function given in (6) to the results, anestimation can be made of the constant to be used for plotting the stress amplitude versus excentreposition curve at the upper frequency of 34,4 Hz which corresponds to 98% of the pipe’s resonancefrequency.428Copyright 2011 by Laboratory Soete
Sustainable Construction and Design 2011Figure 9: Forces at excentre position 0 ForceV2 F cos(C ( F ) cos(180q D)2(5)180q D)2(6)Figure 10: Stress amplitude at the centre of the tube for different excentre positionsWhen taking back Figure 6 it is seen that for an excentre position of 75 this upper black curve indeed givesa correct approximation of the stress. However further evaluation of this diagram is necessary. For instancethe non correspondence between the measured and theoretical values at high excentre positions needs tobe examined.4xCONCLUSIONSA comparison of different alternatives to perform full scale pipe fatigue tests has been performed.Different test methods result in different stresses at the centre of the pipe. Compared to rotatingbending, resonant bending fatigue tests show the advantages of higher testing frequency and smallerpower usage.429Copyright 2011 by Laboratory Soete
Sustainable Construction and Design 2011xAs concluded by J. Van Wittenberghe in [1], the analytical model proves to be accurate. This wasevaluated by means of strain gauge measurements. Further evaluation is necessary to evaluate if theanalytical model also correctly accounts for the asymmetry in the setup.xAn attempt was made to display the influence of excentre position on stress amplitude at the midsection of the tube. If the non correspondence between measured and theoretical values for excentrepositions larger than 90 will be explained in the future, this graph will prove useful when setting up afatigue test. It makes it possible to predict in advance which excentre position needs to be installed toexert a certain fatigue stress.5NOMENCLATUREVstressRload ratioFforceNDoouter diametermDiinner diametermLlengthmtwall thicknessmffrequencyHzMmomentNmIarea moment of inertiam4Dexcentre positiondegrees6MPaACKNOWLEDGEMENTSThe author would like to acknowledge the support of J. Van Wittenberghe who provided data, knowledgeand theoretical as well as technical support. Additionally, the critical remarks of prof. dr. ir. W. De Waeleand prof. dr. ir. P. De Baets, the expertise of C. Bonne, T. Lefevre, H. Van Severen and the efforts of allpeople at Laboratory Soete are gratefully acknowledged.7[1][2][3][4][5][6][7][8]REFERENCESJ. Van Wittenberghe, P. De Baets, W. De Waele, W. Ost, M. Verstraete, and S. Hertelé, "Piperesonant bending fatigue test setup with optical measuring sysytem," Proceedings of the 8thInternational Pipeline Conference, IPC2010, September 27-October 1 2010.SES, "fatigue testing," Stress Engineering Services INC. vol. 2010, 11/1/2010, id 11&pid 186 [accessed 11/6/2010].K. Hasegawa, K. Sakata, K. Miyazaki, and S. Kanno, "Fatigue strength for pipes with allowableflaws and design fatigue curve," International Journal of Pressure Vessels and Piping, vol. 79, pp.37-44, Jan 2002.A. Lefevre, M. Waaijenberg, E. Aylwin, and H. M. Triel, "Defect propagation from fatigue loading in13% Cr pipelines," Pipeline Technology Conference, Ostend, 12-14 October 2009, 2009.G. F. Miscow, P. E. V. de Miranda, T. A. Netto, and J. C. R. Placido, "Techniques to characterizefatigue behaviour of full size drill pipes and small scale samples," International Journal of Fatigue,vol. 26, pp. 575-584, Jun 2004.A. H. Varma, B. W. Russell, and B. Wallace, "Large-scale rotating bending fatigue tests for offshorepipe connections," Experimental Mechanics, vol. 37, pp. 147-153, Jun 1997.A. H. Varma, A. K. Salecha, B. Wallace, and B. W. Russell, "Flexural fatigue behavior of threadedconnections for large diameter pipes," Experimental Mechanics, vol. 42, pp. 1-7, Mar 2002.N. J. Santi, "Premium & Semi-premium Connections Design Optimization for Varied Drilling withCasing Applications," OTC Offshore Technology Conference, vol. 17221, 2005.430Copyright 2011 by Laboratory Soete
Sustainable Construction and Design 2011[9]SES, "Full Scale Fatigue Testing," Stress Engineering Services Inc., 2000.[10]P. Edmundson, "Variable amplitude fatigue testing of full-scale pipe joints," Connect, November2009.G. R. Razmjoo, "Fatigue performance of corrosion resistant steel catenary risers," TWI PR5473-2,2001.A. E. Adams, "Full Scale Fatigue Testing," EWI Tech Brief, 2007.[11][12]431Copyright 2011 by Laboratory Soete
2.3 Rotating and resonant bending fatigue 2.3.1 Rotating bending fatigue A constant load is applied perpendicular to the pipe which is rotated to introduce time dependency. The same formulas (2,3,4) can be applied for this setup. Again a constant bending moment is obtained in between the load points.