Transcription
metalsArticleContinuous Estimation of the Crack Growth Rateduring Rotating-Bending Fatigue TestingGabriela Martinez-Cazares 1 , Rafael Mercado-Solis 2 , Yaneth Bedolla-Gil 1Diego Lozano 1, *12*andDepartamento de Ingeniería, Universidad de Monterrey, Av. Morones Prieto 4500,San Pedro Garza García 66238, Mexico; gabriela.martinezc@udem.edu (G.M.-C.);yaneth.bedolla@udem.edu (Y.B.-G.)Facultad de Ingeniería Mecánica y Eléctrica, Universidad Autónoma de Nuevo León, Pedro de Alba s/n,San Nicolás de los Garza 66455, Mexico; rafael.mercadosl@gmail.comCorrespondence: diego.lozanod@udem.edu; Tel.: 52-81-8215-1000Received: 24 January 2019; Accepted: 25 February 2019; Published: 28 February 2019 Abstract: A method for estimating the crack growth rate in steel during rotating-bending fatiguetesting is presented. Constant deflection tests were conducted in which the initial load remainedconstant prior to crack nucleation, when it decreased as the crack grew. In the proposed approach,steel samples were sharp-notched to produce a characteristic circular fracture upon loading andthe final fracture area was correlated with a ratio of the load prior to fracture and the initial load.In this method, the deflection imposed is a function of a material’s elastic modulus rather than itsyield strength and the correlation obtained to estimate the average crack length as a function of theinstantaneous load is independent of the applied stress or steel grade.Keywords: fatigue test; fracture; crack growth; steel; rotating-bending1. IntroductionThe basic principle of rotating-bending fatigue (RBF) tests is that a bending moment is exerted on aspecimen at a critical location as the specimen is rotated about its longitudinal axis, resulting in a singlefully reversed stress cycle for each rotation (R 1). The fatigue life can be expressed as the numberof cycles (nf ) of a particular stress amplitude (Sa ) that the specimen can withstand before undergoingcomplete fracture [1–5]. Although RBF tests are mostly used for stress-based fatigue studies, theyare generally not stress-controlled. Instead, a constant force amplitude is used in most tests: weightsare suspended from the specimen to exert the bending moment. In many instruments designed forsuch testing, the bending moment is applied as a constant deflection amplitude [1,6–8]. In both cases,however, the stress conditions during the fatigue test differ from the initial stress conditions due tocyclic changes in the specimen such as softening, hardening, or cracking. An increase in the ultimatestrength after cyclic loading prior to crack nucleation is reported in [9].Thus, such cyclic changes are generally overlooked in RBF tests. Their use is typically limitedto deriving S-n curves for stress-based total-fatigue-life evaluations. This type of fatigue testing andthe effects of the loading mode are described in further detail elsewhere [1–3]. The standardizedrotating-bar bending-fatigue testing is described in the ISO 1143 [4] and JIS Z 2274 [5], which areprocedures that generally yield the fatigue life (nf for a particular Sa ), and can be used to construct S-ndiagrams. However, information about the crack behavior, which is another important parameter fordetermining the fracture toughness of a material, cannot be obtained using these methods.The ASTM E647 Standard Test Method for Measurement of Fatigue Crack Growth Rates iscommonly used to determine the crack growth rate by measuring the crack using optical techniques orMetals 2019, 9, 275; doi:10.3390/met9030275www.mdpi.com/journal/metals
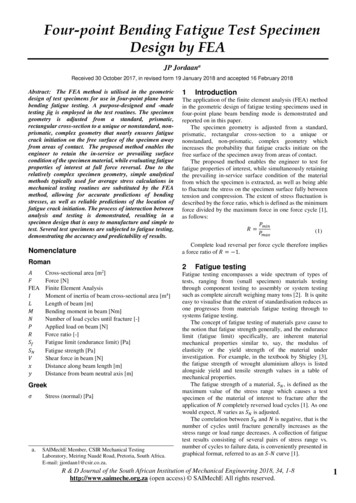
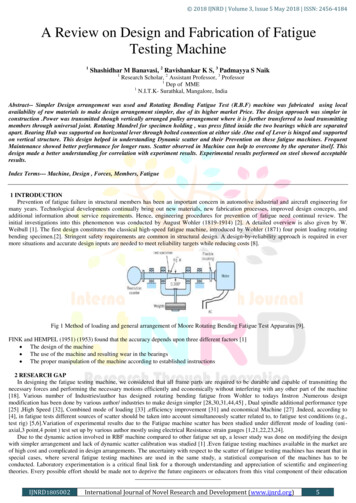
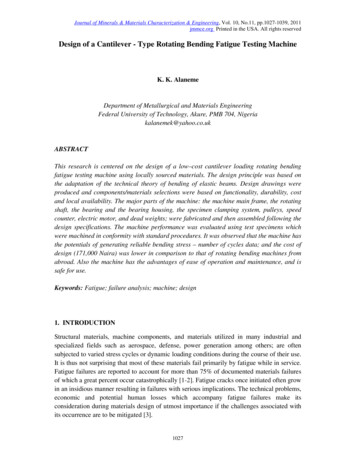
Metals 2019, 9, 2752 of 9equivalent methods [10]. However, continuous crack measurements during a rotating-bending testare not feasible due to the testing configuration. Usually, a test must be interrupted several times totake measurements, whether to extract replicas of the surface from which the arc length of the initialcrack can be measured [11–13], or to record the angle of the crack on the surface with an angularmicrometer [14], or estimate the crack depth based on the potential drop technique [15–18]. Potentialdrop technique has been also used for real-time measurements in axial loading configuration [19] orpure bending [20]. Additionally, the surface crack length has been monitored by optical measurement,while the shape, size, and depth of the crack were inferred by an area-compliance method [21]. In otherfatigue configurations it is possible to use digital image correlation (DIC) to analyze the crack growthrates and crack tip displacement fields, taking images every certain number of cycles during thetest [22,23]. Similar accuracy between DIC and potential drop methods has been reported in [24]. Also,fatigue crack growth has been described in diagrams of kinetic fatigue failure developed with theparameter of the energy dissipation of deformation [25] and has shown good results in componentsfrom old structures [26].In this study, an approach to further extend RBF tests to be applicable for estimating the crackgrowth rate (da/dn) by continuous force sensing under constant displacement conditions is presented.2. Materials and Methods2.1. CalculationsDuring constant displacement testing, the load required to maintain a constant deflectiondecreases progressively from the onset of fatigue cracking until overload fracture. This load alterationis proportional to crack growth as follows.The deflection in a specific geometry depends on the elastic modulus of the material being testedand the load [27]. The equation for the deflection at the free end of a cantilever beam is as follows:δ PL3 /3EI,(1)where P is the applied load, L is the distance between the load and the pivot point that produces thebending moment, E is the elastic modulus, and I is the moment of inertia based on the specimen’sgeometry. The value of I for a round shaft is calculated as a function of its diameter as follows:I πd4 /64,(2)where d is the diameter of the shaft. Thus, the load required to produce a certain deflection for a specificgeometry depends on the material’s elastic modulus. Moreover, the proposed method is independentof test stress or steel strength.The nominal stress for a bending shaft can be calculated as follows:σnom M (y)/I 32M/πd3 ,(3)where M(y) is the bending moment at the surface of the specimen.2.2. Test ConditionsThe cantilever RBF testing machine and specimen geometry used in this study are shownschematically in Figure 1. The custom-built machine was a constant-displacement-type instrument inwhich the free end of the rotating specimen is deflected using the shaft of a digital force gauge.The gauge is lowered by turning the hand wheel to cause a fixed deflection of the specimen.The load was continuously recorded at a sampling rate of 10 Hz and the rotation of specimen was20 Hz. An inductive sensor and a digital cycle counter were employed to count the number of fatiguecycles over the course of the test.
MetalsMetals 2019,2019, 9,9, 275x FOR PEER REVIEWof 9933 ofFigure 1. Schematic view of the cantilever rotating-bending fatigue (RBF) testing machine and specimenwith a sharp notch.Figure 1. Schematic view of the cantilever rotating‒bending fatigue (RBF) testing machine andSpecimenGeometryand Heatspecimenwith a sharpnotch.TreatmentEach specimen was 144 mm long; 38 mm of this length was used for clamping with a colletSpecimen Geometry and Heat Treatmentchuck (type ER-25). The bending arm length from the point of loading to the shoulder fillet wasEachSpecimensspecimen wasmm long;38 ammof thislengthwas usedfor clampingwitha colletchuck106 mm.were144designedwithsharpnotchin orderto promotecrackingfromthe entire(type ER-25). Thebendinglengthpoint ofpattern;loadingtheto theshoulderfillet wasmm.circumferencetowardsthe armcenterand fromform thea circularnotchroot radiuswas 1060.5 mm,Specimens weresharp notchfactorin orderto thispromotecrackingfrom the toentirecorrespondingto adesignedtheoreticalwithstressaconcentration(Kt ) forgeometryof 2.2 acircularpattern;thenotchrootradiuswas0.5mm,The chemical composition of the AISI/SAE 5160 steel used is shown in Table 1. The samples werecorrespondingto a Ctheoreticalstressconcentrationfactor(Kt) for atthisgeometryof 2.2 according C,toaustenitizedat 900followed bywaterquenching andtemperingdifferenttemperatures—250 [28]. C, 450 C, and 550 C—to attain different strength levels. The fatigue life at different tempering350The chemicalcompositiontemperaturesis shownin Table of2. the AISI/SAE 5160 steel used is shown in Table 1. The samples wereaustenitized at 900 C followed by water quenching and tempering at different temperatures—250Table1. Chemicalof AISI 5160steel.The fatigue life at different C, 350 C, 450 C, and 550 C—toattain compositiondifferent strengthlevels.tempering temperatures is shown in Table 2.Elementwt %C composition 0.580Table 1. Chemicalof AISI 5160 0.780Si0.260Ni0.010SrMn0.0130.885Ti0.0030.017Fe e
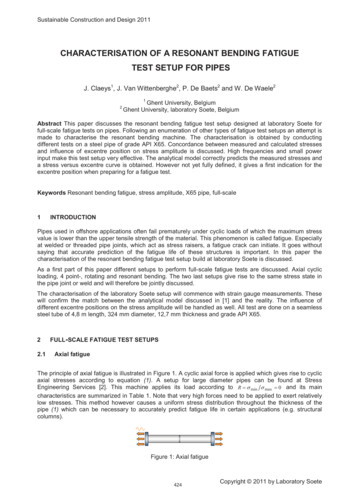
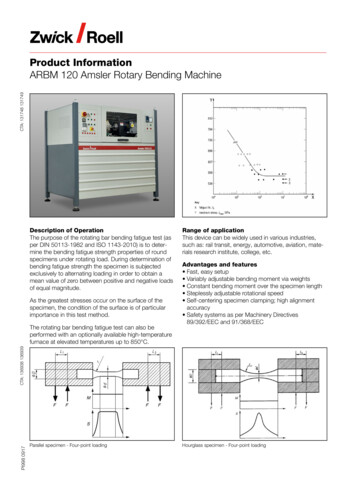
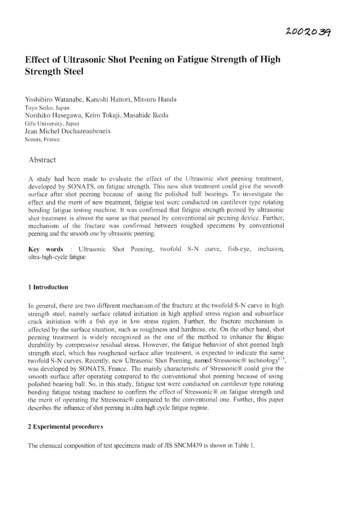
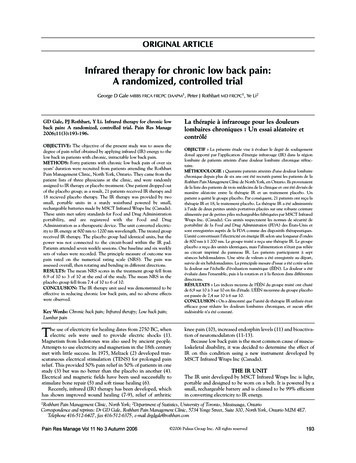
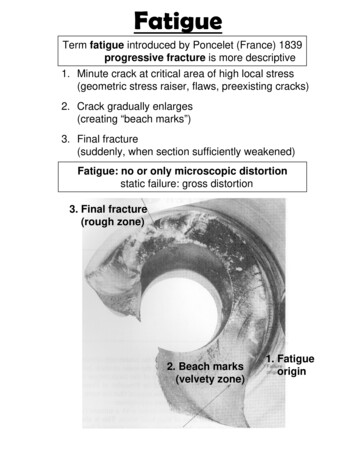
Table 2. Fatigue life measured at various stress levels with different tempering temperatures.Stress AmplitudeMetals 2019, 9, 275(MPa)Load(N)Deflection(mm)Cycles to Failure at Different TemperingTemperatures4 of 9250 C350 C450 C550 C900 2. Fatigue life2051.862 stress levels3.04 with10 different2.21 tempering103.10 102.75 10Tablemeasured at varioustemperatures.4750171Stress 31121161091121099292757567 46-4-4-41.30 105Cycles to Failure at Different Tempering TemperaturesDeflection554.19 C 105 550 C 105(mm) 1.278 250 C1.12 10350 2.16C 10 4502.411.862 1.2021.546 1.0571.2781.202 1.0121.057 0.9851.0120.985 0.8380.8380.6780.6780.606 0.6063.04 104 - 2.21 104 3.10 1042.75 runout 1045- 5.13 105-1.16 106 1.30 105551.12 102.16 102.41 104.19 105- runoutrunout56- 5.13 101.16 10runoutrunout5runout- 4.69 10runout- runout4.69 10558.75 108.75 105runout runout - -2.3. Crack Measurements and FEMA series of crack measurements was performed physically on the fractured test specimens andthe ratio between thethe initialinitial loadload andand thethe (Pf /Pf/P00) was correlated with thecrack length. This approach provided information about the crackcrack lengthlength atat thethe pointpoint ofof fracture.fracture.Figure 2 lsamples.shows scanning electron microscope (SEM) images of typical samples. The orangecircles delineateareasoccurringaroundthe thesharpnotchand owthe yellowindicatethe pathwhichwhichthe tworadialwould wouldhave extendedfrom thenotchsurfacelines indicatethealongpath alongthetwo cracksradial crackshave extendedfromtherootnotchroottowardsthe finalthefracturearea, passingthe centerofcenterthe samplethe centerofcenterthe fracture.surface towardsfinal fracturearea, throughpassing throughtheof theandsampleand theof theInthis way,lengthof thelengthradialofcracks,2a, wasestimatedby subtractingthe subtractingdiameter of thefracture.In thethiscriticalway, thecriticalthe radialcracks,2a, wasestimated byfinalfracturearea(Dfracturethe initialspecimendiameter(D0 ).diameterThus, theis relatedtodiameterof thefinal(Dff) fromthe initialspecimen(Dfracture0). Thus,areathe fractureareaff ) from areatheaverageof thefatigue ofcrackfracture.The(Dff /D0 andDn(D/Dis relatedtoextensionthe averageextensionthe atfatiguecrackatdiameterfracture. ratiosThe diameterratiosff/Dand0 ) 0wereobtainedfor obtainedeach fractureanalyzed.Dn/D0) werefor eachfracture analyzed.Figurethe finalfracture areaFigure 2.2. SEMSEM micrographsmicrographs ofof fracturesfractures depictingdepicting thefinal overloadedoverloaded fracturearea (circle)(circle) andand tress;(b)lownominalstress.paths of two ideal cracks (lines). (a) High nominal stress; (b) low nominal stress.Finite element modeling (FEM) in ANSYS Workbench was used to obtain the load ratio, Pn /P0 ,Finite element modeling (FEM) in ANSYS Workbench was used to obtain the load ratio, Pn/P0,for several Dn /D0 ratios ranging from 0.3 to 1. The analysis was made with 67,795 nodes andfor several Dn/D0 ratios ranging from 0.3 to 1. The analysis was made with 67,795 nodes and 37,66437,664 elements. The geometry was constrained from the grip area and a force was imposed at theelements. The geometry was constrained from the grip area and a force was imposed at the free end.free end. A static analysis was carried out in the original geometry to assess the deflection at the freeA static analysis was carried out in the original geometry to assess the deflection at the free endend produced by different loads using an elastic modulus of 207 GPa. A crack at the notch root wasproduced by different loads using an elastic modulus of 207 GPa. A crack at the notch root wasintroduced in a 2D model along the diameter with the crack tip towards the center (see Figure 3). Theanalysis was repeated using different crack sizes (depths) and constraining the part to the originaldeflection obtained for the uncracked specimen for each load without the crack. The reduced loads
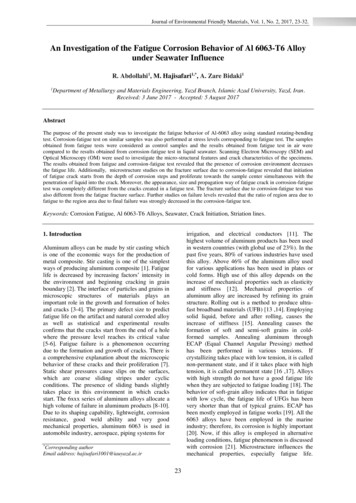
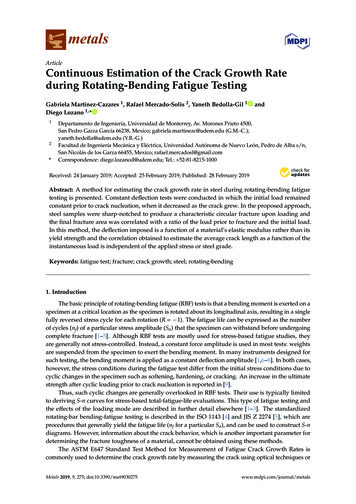
Metals 2019, 9, x FOR PEER REVIEWMetals 2019, 9, x FOR PEER REVIEW5 of 95 of 9introduced in a 2D model along the diameter with the crack tip towards the center (see Figure 3). Theintroducedin a 2D model along the diameter with the crack tip towards the center (see Figure 3). TheanalysisMetals2019,was9, 275repeated using different crack sizes (depths) and constraining the part to the original5 of 9analysiswasrepeateddifferent cracksizesfor(depths)andwithoutconstrainingthe partthe originaldeflection obtainedforusingthe uncrackedspecimeneach loadthe crack.The toreducedloadsdeflectionuncrackedspecimenfor eachloadsizeswithoutcrack. TheThereducedrequired toobtainedproduceforthethesamedeflectionsfor differentcrackwerethedetermined.ratiosloadsP /P termined.TheratiosP/Pnfor different D /D are displayed in Figure 4.different DDn/DdisplayedinFigure4.for e 3. (a) Geometry used in FEM, showing the location of applied load; (b) small crack at notchFigure3. (a)usedinshowing the location of applied load; (b) small crack at notchFigure(a) GeometryGeometryusedin FEM,FEM,root; (c)3.largercrack at thenotchroot. showing the location of applied load; (b) small crack at notchroot;root; (c)(c) largerlarger crackcrack atat thethe notchnotch root.root.Figure 4. (a) Required load to produce certain deflection for different crack lengths determined byFEM;(b)4.loadratio Pn /Ploaddeflection.Figure(a) Requiredto producecertain deflection for different crack lengths determined by0 at certainFigure4. load(a) Requiredto produce certain deflection for different crack lengths determined by0 at certain deflection.FEM; (b)ratio Pn/Pload3. ResultsandloadDiscussionFEM; (b)ratio Pn/P0 at certain deflection.3. Resultsand DiscussionA typicalexample of the raw data for the force versus the number of cycles during3. Results and ure5a. Theload signalwas smoothedusing aA typical exampleRBFof theraw isdatafor the inforceversusthe numberof cyclesduring cklengthdependingondisplacement RBF testing is presented in Figure 5a. The load signal was smoothed using a cubic he loadsignalwassmoothedusinga cubicsplinetheangulartoposition,intheorderto obtainanFigureaverageThe appliedloadat lengththe beginningof eachtestalgorithmreducenoiseproducedby thevariationsin euntilthespecimenfailedatacertainload.angular position, in order to obtain an average load. The applied load at the beginning of each testangularposition,orderdecreasedto obtainandan averageload.appliedloadthe beginningtestremainedconstantinthencontinuedto Thedecreaseuntiltheatspecimenfailed ofat eacha certainremainedconstant then decreased and continued to decrease until the specimen failed at a certainload.load.
Metals 2019, 9, 275x FOR PEER REVIEWof 966 ofFigure 5. Load and percentage of load change during testing for a deflection of 1.057 mm (a) and theFigure 5. Loadand percentageof loadchange duringtesting for(b).a deflection of 1.057 mm (a) and thecorrelationbetweenthe load ratioand diameterratio (cracking)correlation between the load ratio and diameter ratio (cracking) (b).The load is a direct indicator of the crack nucleation and growth. The load change, which isexpressedas a percent([1 Pn /P0 ] is plottedas a functionof the cyclesidentifythe whichdifferentThe loadis a directindicatorof100),the cracknucleationand growth.The toloadchange,isstagesof fatigue.In this([1example,initialload remainedalmostofconstantuntilthe nucleationof theexpressedas a percent Pn/P0] the 100),is plottedas a functionthe cyclesto identifythe differentfirstmicroscopiccracks aroundthe notch-rootsurfaceof theconstantspecimen(stageas indicatedbystagesof fatigue.fatigueIn this example,the initialload remainedalmostuntiltheI),nucleationof theafirstslightdecrease inthe percentchangeabout surface18,000 cycles.this the afternotch-rootof the Afterspecimen(stagetheI), asindicatedatslow ratetowardstheloadspecimen(stagethis reducesthe netcrosssectionof thebyaarelativelyslight decreasein thepercentchangecoreafteraboutII);18,000cycles. Afterthispoint,the cracksspecimen,thus reducingforcerequiredcoreto sustainthethissamedeflection.Betweencyclesgrew at a relativelyslow therateamounttowardsofthespecimen(stage II);reducesthe netcross section25,000and 32,000thus(approximately),force ofreductionwas moresignificant.Duringthis stage,the netof the specimen,reducing thetheamountforce requiredto sustainthe samedeflection.Betweencrossthespecimenwas reducedtheso forcemuchreductionthat edandthecyclessection25,000 ofand32,000(approximately),was the net cross section of the specimen was reduced so much that significant force relaxation occurredcracking(stage III) thanin thecouldpreviousstage. withstandFinally, asthetheappliedfatigue stress;cracks thisreacheda criticalsize,and the overloadedmaterialno longerpromotesa fasterafterabout cracking35,000 fatiguethe ,III) thanin the previousstage.Finally, as the fatigue cracks reached aIn boththe experimentalandcycles,the simulation,the Pfracturedwas equal to 1 at the beginningcriticalsize, afterabout 35,000testsfatiguethe specimenn /P0 ratiocompletely.of theIntest;at thethisexperimentaltime, no crackswerepresent,so Dn /D0 the 1. PFigure5b showsa third-degreebothtestsandthe simulation,n/P0 ratiowas equalto 1 at thecorrelationbeginningfitbetweenloadratioand diameterratio, aspredicted byFEM.of thetest; atthethistime,no crackswere present,someasuredDn/Do 1. experimentallyFigure 5b showsanda third-degreecorrelationThe obtainedcorrelationthen appliedthe measuredload data toandestimatethe crackgrowthfit betweenthe loadratio andwasdiameterratio, astomeasuredexperimentallypredictedby FEM.duringeachtest. In Figure6a, theaveragelength(m) measuredand the valueof datada/dnto(m/cycle)Theobtainedcorrelationwasthen crackappliedto theloadestimate aretheshowncrackasfunctionsof thecyclenumber.It canseenin Figure5a lengththat the(m)loadratioan indicatorthe crackgrowthduringeachtest.In Figure6a,betheaveragecrackandtheisvalueof da/dn of(m/cycle)growth.In addition,the ofrangethe number.stress intensitywasas K load S ratioπaY usingare shownas functionsthe ofcycleIt can factorbe seenin calculatedFigure 5a thattheis anonlythe Smaxvalueas described[15,29], whereY is aofconfigurationfactor usedforwasa circumferentialindicatorof thecrackgrowth. Ininaddition,the rangethe stress intensityfactorcalculated ascrackopeningusingmodeonlyI for thea longwhichis calculatedas follows: 𝐾 in 𝑆 𝜋𝑎YSmaxrod,valueas describedin [15,29],where Y is a configuration factorused for a circumferential crack in opening mode I for a long rod, which is calculated as follows:1.12 α(1.3α 0.88)Y ,(4). 1 (0.92α. )𝑌 ,(4).where α is the normalized crack size, defined as the length of a single crack length over the radius.ThematerialconstantscrackC andsize,the definedexponentinlengththe expressionda/dn lengthC( K)mover, canthebe obtainedwhereα isthe normalizedasmtheof a singlecrackradius.mfrom Thethe log-logof K versussee FigurematerialplotconstantsC and da/dn,the exponentm in6b.the expression da/dn C(ΔK) , can be obtainedfrom the log‒log plot of ΔK versus da/dn, see Figure 6b.
x FOR PEER REVIEWMetals 2019, 9, 27577 ofof 9Figure 6. Average crack length and crack growth rate behavior as a function of the cycle numberFigurecrack lengthcrackgrowthrate(b).behavior as a function of the cycle number (a)(a)and 6.theAveragestress intensityfactorandrangeagainstda/dnand the stress intensity factor range against da/dn (b).4. Conclusions4. ConclusionsIn this paper, a methodology for continuous crack growth estimation based on the rotating bendingIn this paper,a methodologycontinuousgrowth estimationoncharacteristicthe rotatingin a constantdeflectionsystem was forpresented.The crackmeasurementswere basedbasedon thebendingin a constantsystemspecimens.was presented.The measurementswerebasedon thecirclefracturesobserved deflectionin sharp-notchedThe fractureswere correlatedwiththe fracturecharacteristicfractures observedin sharp-notchedThe befractureswerecorrelatedloadto obtaincirclea relationshipbetween theinstantaneous specimens.load that mustappliedto maintainawith the displacementfracture load toobtaina relationshipbetweenthe instantaneousloadthat mustbe appliedconstantandthe averagecrack size.A third-degreemodel wasobtainedfor thistestingto maintain a forconstantdisplacementand tothedifferentaveragestrengthcrack size.A third-degreemodelwas obtainedconfigurationsteel samplestemperedlevels.This correlationis dependentonthis testingconfigurationfor steelsamplestempereddifferentstrength levels.This correlationaformaterial’selasticmodulus ratherthanits yieldstrength.toBythis methodology,the stagesof fatigueis dependenton distinguisheda material’s elasticmodulusandratherits yieldstrength.By thismethodology,thecouldbe clearlyand analyzedit isthanpossibleto obtainthe stressintensityfactor andstagesof fatiguecouldunderbe clearlythematerialconstantsthese distinguishedconditions. and analyzed and it is possible to obtain the stressintensity factor and the material constants under these conditions.Author Contributions: Research design, G.M.-C. and R.M.-S.; testing, G.M.-C.; data analysis, G.M.-C. and D.L.;literature research, R.M.-S. and Y.B.-G.; manuscript writing, D.L. and Y.B.-G.List of SymbolsFunding: Grants UIN18513 & UIN18529 from Universidad de Monterrey.α Normalized crack sizeAcknowledgments: The authors would like to thank Consejo Nacional de Ciencia y Tecnología (CONACYT),a Averagecrack lengthUniversidadde Monterrey,and Universidad Autónoma de Nuevo León for supporting this research.C Material constantD Diameter of the gripped or loaded end of the specimenD0Symbols Nominal diameter of the specimen at which the stress is the greatestList ofDff Diameter of the final fractureα Normalized crack sizeDn Diameter of the remaining cross section after n cyclesa Average crack lengthΔK Stressintensity factor rangeC MaterialconstantConflicts of Interest: The authors declare no conflict of interest.ΔS StressrangeD Diameterof thegripped or loaded end of the specimenD0 Nominaldiameterof thespecimen at which the stress is the greatestd Diameterof theshaftDff Diameterofthefinalfractureda/dn Average crack growth rateDn Diameterof the remaining cross section after n cyclesδ Deflection K EStressintensityfactor range Elastic modulus S Stress rangeFEM Finite element modelingd Diameter of the shaftI Moment of inertiada/dn Average crack growth rateK Stress intensity factorδ DeflectionKt Stress concentratorE Elastic modulusL Distancebetweenthe load and the pivot pointFEM FiniteelementmodelingM MomentI Moment of inertiaM(y)intensity Bendingmoment at the surface of the specimenK Stressfactorm MaterialConstantKt Stress concentratorn Number of cyclesnf Number of cycles to failure
Metals 2019, 9, 2758 of 9L Distance between the load and the pivot pointM MomentM(y) Bending moment at the surface of the specimenm Material Constantn Number of cyclesnf Number of cycles to failureP Load (Force)P0 Initial loadPn Load at n cyclesPOL Load prior to overloadingPf Fracture loadr Radius at the end of the test sectionR Ratio for cyclic loading (min/max)RBF Rotating bending fatigueS StressSa Stress amplitudeSEM Scanning electron microscopeσnom Nominal stressY Configuration 5.Stephens, R.I.; Fatemi, A.; Stephens, R.R.; Fuchs, H.O. Metal Fatigue in Engineering, 2nd ed.; John Wiley &Sons, Inc.: Hoboken, NJ, USA, 2001; ISBN 978-0-471-51059-8.Manson, S.S.; Halford, G.R. Fatigue and Durability of Structural Materials; ASM International: Materials Park,OH, USA, 2006; ISBN 0871708256.ASM Handbook Vol.19-Fatigue and Fracture; ASM International: Materials Park, OH, USA, 1998;ISBN 0871703858.ISO 1143:2010 Metallic Materials—Fatigue Testing—Rotating Bar Bending Fatigue Testing; InternationalOrganization for Standardization: Geneva, Switzerland, 2010.JIS Z 2274:1978 Method of Rotating Bending Fatigue Testing of Metals; Japanese Industrial Standards: Tokyo,Japan, 1978.Eleiche, A.; Megahed, M.; Abd-Allah, N. Low-cycle fatigue in rotating cantilever under bending II:Experimental investigations on smooth specimens. Int. J. Fatigue 1996, 18, 577–592. [CrossRef]Megahed, M.M.; Eleiche, A.M.; Abd-Allah, N.M. Low-cycle fatigue in rotating cantilever under bending I:Theoretical analysis. Int. J. Fatigue 1996, 18, 401–412. [CrossRef]Eleiche, A.M.; Megahed, M.M.; Abd-Allah, N.M. Low-cycle fatigue in rotating cantilever under bending. III:Experimental investigations on notched specimens. Int. J. Fatigue 2006, 28, 271–280. [CrossRef]Pawliczek, R.; Prażmowski, M. Study on material property changes of mild steel S355 caused by block loadswith varying mean stress. Int. J. Fatigue 2015, 80, 171–177. [CrossRef]ASTM E647-15e1 Standard Test Method for Measurement of Fatigue Crack Growth Rates; ASTM International:West Conshohocken, PA, USA, 2016.da Fonte, M.; Reis, L.; de Freitas, M. Fatigue crack growth under rotating bending loading on aluminiumalloy 7075-T6 and the effect of a steady torsion. Theor. Appl. Fract. Mech. 2015, 80, 57–64. [CrossRef]De Freitas, M.; Reis, L.; Da Fonte, M.; Li, B. Effect of steady torsion on fatigue crack initiation and propagationunder rotating bending: Multiaxial fatigue and mixed-mode cracking. Eng. Fract. Mech. 2011, 78, 826–835.[CrossRef]Jordon, J.B.; Bernard, J.D.; Newman, J.C. Quantifying microstructurally small fatigue crack growth in analuminum alloy using a silicon-rubber replica method. Int. J. Fatigue 2012, 36, 206–210. [CrossRef]Shin, C.S.; Chen, P. Fatigue crack propagation testing using subsized rotating bending specimens. Nucl. Eng.Des. 2004, 231, 13–26. [CrossRef]Hannemann, R.; Köster, P.; Sander, M. Investigations on crack propagation in wheelset axles under rotatingbending and mixed mode loading. Procedia Struct. Integr. 2017, 5, 861–868. [CrossRef]
Metals 2019, 9, 27516.17.18.19.20.21.22.23.24.25.26.27.28.29.9 of 9Gandossi, L.; Summers, S.; Taylor, N.; Hurst, R.; Hulm, B.; Parker, J. The potential drop method for monitoringcrack growth in real components subjected to combined fatigue and creep conditions: Application of FEtechniques for deriving calibration curves. Int. J. Press. Vessels Pip. 2001, 78, 881–891. [CrossRef]Hicks, M.A.; Pickard, A.C. A comparison of theoretical and experimental methods of calibrating the electricalpotential drop technique for crack length determination. Int. J. Fract. 1982, 20, 91–101. [CrossRef]Stanzl-Tschegg, S. Very high cycle fatigue measuring techniques. Int. J. Fatigue 2014, 60, 2–17. [CrossRef]Bian, L.-C.; Lim, J.-K. Fatigue life prediction of the plates with an inclined surface crack. Int. J. Fatigue 2003,25, 521–531. [CrossRef]McFadyen, N.B.; Bell, R.; Vosikovsky, O. Fatigue crack growth of semi-elliptical surface cracks. Int. J. Fatigue1990, 12, 43–50. [CrossRef]Cai, C.Q.; Shin, C.S. A normalized area-compliance method for monitoring surface crack development in acylindrical rod. Int. J. Fatigue 2005, 27, 801–809. [CrossRef]Mathieu, F.; Hild, F.; Roux, S. Identification of a crack propagation law by digital image correlation. Int. J.Fatigue 2012, 36, 146–154. [CrossRef]Miscow, G.F.; de Miranda, P.E.V.; Netto, T.A.; Plácido, J.C.R. Techniques to characterize fatigue behaviour offull size drill pipes and small scale samples. Int. J. Fatigue 2004, 26, 575–584. [CrossRef]Hosdez, J.; Witz, J.-F.; Martel, C.; Limodin, N.; Najjar, D.; Charkaluk, E.; Osmond, P.; Szmytka, F. Fatiguecrack growth law identification by Digital Image Correlation and electrical potential method for ductile castiron. Eng. Fract. Mech. 2017, 182, 577–594. [CrossRef]Szata, M.; Lesiuk, G. Algorithms for the estimation of fatigue
Keywords: fatigue test; fracture; crack growth; steel; rotating-bending 1. Introduction The basic principle of rotating-bending fatigue (RBF) tests is that a bending moment is exerted on a specimen at a critical location as the specimen is rotated about its longitudinal axis, resulting in a single fully reversed stress cycle for each rotation .