Transcription
RECRUITING TRENDS2017-1847th EditionBrief 2: Hiring by Sector & RegionBRIEF 3Starting SalariesKey findings from 2017-18 arepresented in this research brief. Wehave broken the release of employerinformation into a series of shortbriefs that will be made available overthe next six weeks. You can downloadthe briefs from the CollegiateEmployment Research Institute.Recruiting Trends 2017—2018 is published by Career Services and the Collegiate Employment Research Institute and copyrighted, 2017-2018,by Michigan State University. All rights reserved. This electronic version is for individual use only. No part of this electronic report may be 1Recruiting Trends 2017-18reproduced in any form by any electronic or mechanical means (including photocopying, recording, or information storage and retrieval)without written permission from the Institute. Users are not permitted to mount this file on any network servers or distribute this report byemail without written permission from the Institute. Material from this report can be used in classrooms and newsletters with proper citation ofMichigan State University and the Collegiate Employment Research Institute.
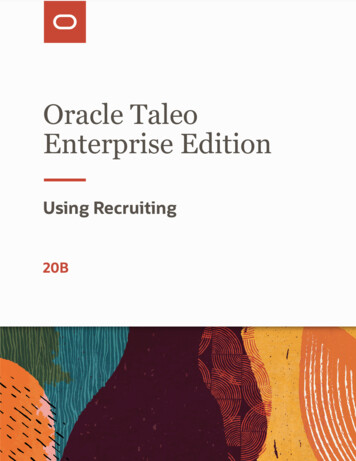
Meet the CompletersWe generated this convenience sample from employers currently seeking college talent through their interactions with college and universitycareer services offices. Nearly 200 career service centers from around the country invited their employers to participate in this study.Approximately 3,370 employers provided information useful for understanding recruiting trends and practices. We will use informationprovided by those recruiting talent for full-time positions, internships, and co-ops for these research briefs. Readers can use the following keysample characteristics to determine how applicable our survey results are for their campus employer base.Survey respondents by organization sizeVery small 49 employeesSmall50-499 employeesMidsize500-3,999 employeesLarge4,000-24,999 employeesVery large 25,000 employeesActive Recruiting by Region27%37%20%9%6%Role in College RecruitingFull-time positionsInternship or co-op positions only71%12%Short-term hiringExperienced hiring7%10%Institutions Where Companies Recruit TalentTwo-year public collegeFour-year public collegeFour-year private collegeTwo- & four-year for-profit institutionInstitution with bachelor’s & advanced degreeprogramsInstitution with advanced degrees onlyHistorically black college & universityHispanic-serving institutionAsian, Asian-Pacific serving alEntire U.S.8%32%Regional recruiting only60%Key StatesMichiganUtahIllinoisMassachusettsNew York16%7%6%6%6%Key Economic SectorsProfessional, business & scientific servicesManufacturingEducational servicesFinance & insurance servicesGovernmentHealthcare & social TSRecruiting Trends 2017-18 is made possible by the efforts of many dedicated and generous colleagues, friends of the institute, and corporatesponsors. We thank all the colleges and universities who encouraged local, regional, and national organizations to participate in our survey andfor their confidence in our contribution to research on college recruiting. We also thank our editor, Stephanie Schlick.We extend special appreciation to several people whose special insights contribute to CERI’s research activities: Jeff Beavers (University ofIllinois), Duncan Ferguson (Managing Director, Vantage Leadership Consulting), and James Spohrer (IBM Almaden Research Center).
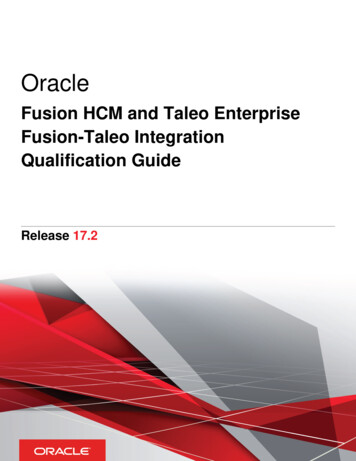
Brief 2: Hiring by Sector & RegionLast year nearly 50 percentof our respondents indicatedthey would increase startingsalary offers by an averageof 4 percent. These figureswere reminiscent of 2007when more than 50 percentof employers increasedsalaries more than 4 percent.If the college labor market remained highly competitive, we anticipated thatmore than 50 percent of employers would increase salary offers, and we wouldwitness some solid growth in salary levels. Alas, this did not happen. Whileno employer reported they would decrease their starting salary offers, only 39percent (a decline of 9 percentage points from last year) indicated they wouldincrease salaries an average of 4.1 percent. Sixty-one percent stated that startingoffers would remain at the same level as last year. As a result average startingsalary offers did not vary markedly from last year for majors with high numbersof employers reporting offers.Before the recession 33 percent of employers offered performance bonuses atthe end of the first year of employment and 17 percent offered signing bonuses.Since the recession these figures remain at historically low levels. However,this year the number of employers offering signing bonuses nearly doubled to13 percent (7 percent used this device in the past two years). The number oforganizations offering performance bonuses also jumped 9 percentage pointsto 21 percent. Both these strategies may reflect a tradeoff from offering higherstarting salaries (a permanent cost) to a one-time payment.Organizations that offer compensation partially or entirely based oncommissions have hovered around 8 percent for much of the period since therecession. This year commission- based compensation increased to 13 percent.The tables report starting salaries in a number of different ways. We requiredtwo tests for salaries to be included. First, a minimum of 25 employers neededto report starting salaries for their data to be included in the survey responses(this requirement relaxed last year’s minimum of 50 reported salaries). Second,the mean and median salaries for the group must be reasonably comparable. Weprovide the starting salary ranges for academic disciples from the 10th percentileto the 90th percentile. The comparisons by size and industrial sector are usefulas they provide greater awareness of the different factors that shape offers.However, we ask readers to exercise caution when making broad generalizationsbecause the number of reported salaries are small in some cases. Readers shoulduse this information with their institution’s post-graduation survey, stateand regional data available from state government or economic developmentorganization, and web aggregators.Starting salary offersThe average starting salaries reflect base salary only and do not include bonuses,commissions, housing and moving allowances, stipends, or other incentives. Weremoved reported salaries if they represented stipends, contract work, or lumpsum payments; most of these represented salaries of less than 10,000. We admitwe may not have identified all the stipend employment reported. By reportingthe range from the 10th to the 90th percentiles, we adjusted for any possibleoutliers. The standard deviations around the averages reported in the tables arewithin appropriate levels.Staring salaries have been broken out in several ways so that the reader cansee how sector and organization size influence starting salary offers. Someobservations include:¿¿ The smallest organizations offer the lowest salary.¿¿ However, organizations with 50 to 25,000 employees offer very similarstarting salaries in most cases.¿¿ Only the very largest organizations offer starting salary offers noticeablyhigher than all other organizations.¿¿ Among the major industrial sectors reporting in this survey, manufacturingoffers slightly higher starting salaries than service sectors. Service sectors,finance and insurance services, and professional, business, and scientificservices, for example, offer comparable starting salaries.Average Starting Salary – Selected Industrial Sectors (bachelor’s level)Professional,Finance &Business &InsuranceScientificSelected majorsManufacturingServicesServicesAll majors53,56146,10944,284All technical60,83557,34856,352All business51,55652,69049,355All liberal arts51,57944,606Electrical engineering63,482—59.649Mechanical engineering63,562—59,518Computer science59,625—61,016Computer programming60,097—62,720Computer info. 00Human Services& ——————— Insufficient data was provided to calculate a useful average.Recruiting Trends 2017-181
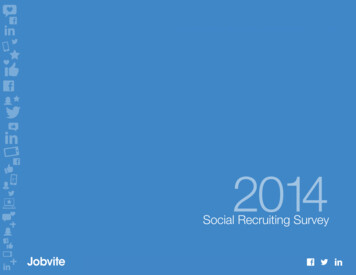
Brief 2: Hiring by Sector & RegionTrends in Starting Salaries and Bonuses20072008Employers offering0809Increase in starting salaries (%)5332Average percentage increase (avg.)4.24.0Signing bonus (%)1017Performance bonus (%)2033Commission-based salaries (%)104— Insufficient data was provided to calculate a useful average.200910122.8720—201011173.015—Average Starting Salary — Organizational Size (bachelor’s level) 49employeesAll majors38,127All technical49,512All business43,789All liberal arts36.674All health42.061All ing43,241Supply chain—Economics45,870Human resources—Communication37,000Computer science57,265Computer pprogramming—Software design60,609Computer information systems51,875Computer engineering—Electrical engineering—Mechanical engineering—Nursing—— Insufficient data was provided to calculate a useful average.Average Starting Salaries — Selected Majors (bachelor’s level)2007-08 2009-10 2011-12Advertising35,70035,50034,100Computer science50,20047,50047,200Electrical 38,100Mathematics40,70043,60044,600Starting Salaries — Associate’s DegreeSelected majorAll engineering & technicalAll computer scienceAll nursingAll health services, technicians & technologistsAll businessAll other degreesRecruiting Trends 251350 to 647,56152,30738,87441,880201415375.272814500 - 201516394.77228201617484.271484000 – 8857,76262,42844,08745,632201718394.1132114 29857,72360,58146,12350,830Range (10 to 90 percentiles)28K to 70K27K to 73K20.5K to 60K20K to 60K25K to 55K20K to 48K2
Brief 2: Hiring by Sector & RegionStarting Salaries — Bachelor’s DegreeSelected majorElectrical engineeringSoftware designChemical engineeringComputer engineeringMechanical engineeringIndustrial engineeringApplied engineeringMaterials engineeringBio. Engineering/BioMed. Eng.Aerospace enginneringComputer programmingInformation security systemsComputer scienceMIS (computer science)Engineering techniciansComputer information systemsCivil engineeringMIS (business)Construction managementEngineering technologyFinanceSupply chainRisk managementHuman resourcesAccountingSport/entertainment mgt.Hospitality businessMerchandizing mgt.Multimedia and Graphic designNursingMathematics (includes ngAgricultural businessChemistryEnvironmental sciencesPlant & Crop Sciences & Hort.AdvertisingPublic relationsFilm & video productionInteractive media and designPolitical science & Public ama/visual artsCommunicationCriminal justiceForeign languages & linguisticsMath teachersScience teachersRecruiting Trends 5741,72838,28940,78639,09638,552Range (10 to 90 percentiles)40K to 74K48K to 82K35K to 75.9K45K to 77.4K50K to 74.8K45K to 70K36.8K to 70.4K47.1K to 74.4K30.4K to 79.5K30K to 52K40K to 70K40K to 75.9K35.9K to 78K35K to 83K33K to 63.8K35K to 75K45K to 66.7K35K to 70K30K to 70K34K to 69.1K35K to 65K32.4K to 66.6K31.8K to 79.4K34K to 60K34K to 60K31.6K to 76.2K29K to 53.4K31.9K to 92.3K34K to 75K35K to 65K30K to 80K34.8K to 70.2K35K to 89K32.7K to 60.3K26.2K to 53.4K30.7K to 65.9K31.1K to 61.6K26.2K to 53.4K24.3K to 52.1K30K to 58.4K27.8K to 52.1K31.7K to 53.2K30K to 54.2K27.9K to 74.4K34.2K to 78K27.9K to 74.7K31K to 69.2K25.4K to 52K32K to 55K29.5K to 53.0K25K to 56.3K30K to 50K30K to 50K3
Brief 2: Hiring by Sector & RegionStarting Salaries — Bachelor’s DegreeSelected majorEnglish,language arts, literature teachersHistory & social studiesForeign language teachersHistoryEnglishPsychologyLaw & legal studiesInternational relations & Public policyInterior designSpecial education teachersElementary education teachersAnthropology/sociologySocial workPre-K & kindergarten educationHealth care administrationClinical lab scientist/Med techHealth information systemsFamily & child 16735,85648,22238,04348,20836,10741,317Range (10 to 90 percentiles)30K to 46K30K to 47.2K30K to 50K25.9K to 52.1K26.6K to 48.8K24K to 50K26.3K to 78K20K to 53K18.2K to 51.2K30K to 50K29K to 46.6K20K to 49.4K24K to 55K25K to 46K22.2K to 74.3K20.8K to 54.2K25.5K to 74.5K23.6K to 53.4K30K to 4K to 60K35K to 73K32K to 63K25K to 59.5K25K to 66K26K to 52K26K to 60KStarting Salaries — MBA & Master’s DegreeSelected majorComputer scienceEngineeringMBAPhysical & biological sciencesAccountingLIR/HRHealth sciences MS & MSWSocial sciences MA & 448,791Range (10 to 90 percentiles)41.1K to 100K41K to 95K39K to 100K31.9K to 85.9K40K to 86K36K to 90.8K31.2K to 79.6K31.2K to 72.8KStarting Salaries — PhD & ProfessionalSelected majorPharmacyEngineering & computer scienceLawPhysical & biological sciencesBusinessSocial sciences & humanitiesPhysical 0355,707Range (10 to 90 percentiles)22.4K to 101.2K37.4K to 120K30K to 94.4K33.1K to 109.9K31.4K to 120.2K30K to 97.4K20.5K to 86.3KAll majorsAll technical (engineering, computer science, IT)All businessAll social sciences/humanities/ liberal arts/scienceAll health sciencesAll EducationAll Ag & Natural ResourcesRecruiting Trends 2017-184
Starting Salaries — Associate's Degree Selected major Average Range (10 to 90 percentiles) All engineering & technical 48,293 28K to 70K All computer science 48,489 27K to 73K All nursing 40,944 20.5K to 60K All health services, technicians & technologists 37,353 20K to 60K All business 40,031 25K to 55K All other degrees 33,327 20K to 48K