Transcription
Chapter 8.3RadonGeneral descriptionRadon is a radioactive noble gas. Of all radon isotopes only two, radon-222 (radon) andradon-220 (thoron) occur in significant amounts indoors. Radon-222 is one of the decayproducts of uranium-238 (half-life 4.5 109 years) and radon-220, a nuclide thorium-232decay (half-life 1.4 1010 years). The mother nuclides are radium-226 and radium-224,respectively.Thoron has a half-life of only 55 seconds, which mostly results in low levels indoors (1).Recent measurements in some countries have shown, however, that in certain situations thedoses from thoron and its progeny are significant and comparable to those from radon (2–4).Radon decays into radioactive metal ions by alpha radiation. The most important of the radondecay products in the present context are the alpha emitters polonium-218 (half-life 3.05 min)and polonium-214 (half-life 1.5 10–4 seconds). Immediately after the decay, the progeny areunattached, but a large portion is soon attached to particles in the air or to surfaces. The shortlived progeny collectively have a half-life of about half an hour. The first long-lived progeny,lead-210, has a half-life of 22.3 years.SourcesUranium is present in the earth’s crust and radon occurs in building materials, groundwaterand natural gas. Nevertheless, the ground is the major radon source. The lower air pressureindoors gives rise to a pressure-driven flow of radon-rich soil air into the indoor environmentthrough cracks in the bottom slab and cellar walls. Certain rocks and soil, such as somegranites and shales, contain more uranium than others. However, ground with moderatecontents of uranium and/or radium can also give high indoor radon concentrations (5,6). Theinflow depends largely on the building construction and the permeability of the groundmaterials.Building materials made from soil (e.g. clay bricks) or rock always contain uranium andradium. The content is usually low, but some materials may have high concentrations ofradium-226, for example alum shale concrete and building materials made of volcanic tuff,gypsum waste, etc. The radon concentration can reach several thousand bequerels per litre(Bq/l) in water from drilled wells in regions with granite rock, for example in Finland andSweden (7). This contributes to indoor radon and to exposure via ingestion.Occurrence in airThe radon concentration in outdoor air is higher over large continents than over sea. Duringtemperature inversions (a reversal of the normal atmospheric temperature gradient), levelsmay reach hundreds of Bq/m3 over regions with enhanced concentrations of uranium andradium in the ground (8,9). The radon concentration outdoors is usually about 10 Bq/m3 as anannual average (1).Indoor radon concentrations depend on the house construction and the underlying soil. WHO Regional Office for Europe, Copenhagen, Denmark, 20011
Chapter 8.3RadonAir Quality Guidelines - Second EditionTogether with climatic factors and human habits, this leads to variations in radon levels byhour, day, season and year (6). Furthermore, the concentration varies between buildings androoms, and within rooms. When the major radon source is the ground, rooms in basements orin contact with the ground have higher radon concentrations than rooms on higher floors.Within rooms the radon concentrations may vary, for example near inlet or outlet ducts, andnear points of high inflow of radon from the ground, building materials or radon-rich water.The distribution of radon concentrations in dwellings is approximately log-normal, with atendency for high concentrations to lie above those predicted by this distribution (10). Thegeometric mean and geometric standard deviation describe the distribution, while thearithmetic mean is often used to estimate the average probability of detrimental health effects.The United Nations Scientific Committee on the Effects of Atomic Radiation (UNSCEAR)has estimated the worldwide, population-weighted values of these parameters for dwellings tobe 25 Bq/m3, 2.5 Bq/m3 and 40 Bq/m3, respectively (1).Radon concentrations in dwellings differ between countries because of differences in geologyand climate, in construction materials and techniques, and in domestic customs. Thearithmetic means for countries vary from 12 to 140 Bq/m3 (1). Radon concentrations for someEuropean countries are given in Table 1. More than 10% of the dwellings in certain countriessuch as Finland and Sweden have levels exceeding 200 Bq/m3. Systematic investigations ofabove-ground workplaces are still rare, with the exception of public buildings such as schools.Conversion factorsLarge-scale measurements of radon are made by determining the activity of radon gas. Theequilibrium factor between the radon progeny and the radon gas depends on several factors,principally the aerosol concentration and air exchange rate. Measurements in several countrieshave shown equilibrium factors in dwellings of between 0.2 and 0.8 (1). UNSCEAR and theInternational Commission on Radiological Protection (25) have adopted a typical worldwideequilibrium factor of 0.4.The SI unit for activity concentration is the bequerel (Bq), which is one radioactive decay persecond. (The old unit is the curie (Ci), with one pCi/l equivalent to 37 Bq/m3.) There areseveral measures for radon progeny. The equilibrium equivalent concentration of radon is theactivity concentration of radon, in equilibrium with its short-lived progeny, that would havethe same potential alpha energy concentration as the existing non-equilibrium mixture givenin Bq/m3. The SI measure for radon progeny is the concentration of short-lived radon progenyin air in terms of the alpha energy released during complete decay through polonium-214given in joule-hours per cubic metre (J·h/m3).The cumulative exposure is given as Bq·h/m3, Bq·y/m3 (the average radon concentration at100% occupancy), J·h/m3 or J·y/m3. The potential alpha energy exposure of workers is oftenexpressed in terms of the working level month (WLM). 1 WL was originally defined as theconcentration of potential alpha energy associated with the radon progeny in equilibrium with100 pCi/l (3700 Bq/m3). Since the quantity was introduced for specifying occupationalexposure, one month was taken to be 170 hours. WHO Regional Office for Europe, Copenhagen, Denmark, 20012
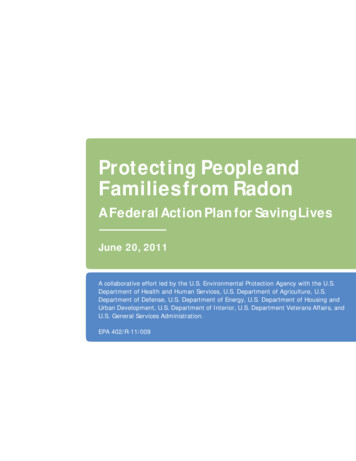
Chapter 8.3RadonAir Quality Guidelines - Second EditionTable 1. Radon levels in dwellings of some European countries3Radon concentration (Bq/m )CountryNumber ofhousessampledPeriod and durationof eometricamean SDPercentageover 2003Bq/mPercentageover 4003Bq/mReferenceBelgium3001984–19903 months to 1 yearpopulationbased a12001982random grab 6 monthsrandom47292.22.2 0.4(12)Finland30741990–19911 3 months (using openalpha track detectors)biased(not 3 months1991–19931 886 months–52––––(1)Hungary1221985–19872.5 d12591985–19896 tratified random 75622.04.81.0(18) WHO Regional Office for Europe, Copenhagen, Denmark, 20013
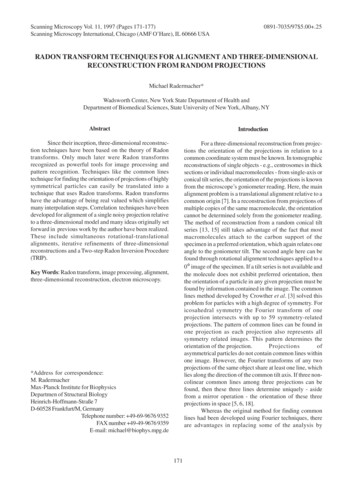
Chapter 8.3RadonAir Quality Guidelines - Second Edition3Radon concentration (Bq/m )CountryNumber ofhousessampledPeriod and durationof eometricamean SDPercentageover 2003Bq/mPercentageover 4003Bq/mReference1 nds10001982–19841 7–19896 901–3 monthsvolunteers in aselected group(high nter of 1988– 1989grab 601982–19923 months in 01982–19903 months(mainly in winter)biased(not stratified)70––5.0–(23)United Kingdom20931986–19871 yearrandom20.5152.20.50.2(24)aSD Standard deviation.bA. Poffjin, personal communication.cL. Sztanyik & I. Nikl, personal communication.Source: Bochicchio et al. (11). WHO Regional Office for Europe, Copenhagen, Denmark, 20014
Chapter 8.3RadonAir Quality Guidelines - Second EditionAnalytical methodsTime-integrated, continuous recording or instantaneous measurements of radon, usually theactivity of radon gas, can be made. Owing to the large variability of indoor radonconcentrations, both diurnally and seasonally, measurements integrated over at least threemonths are required when the aim is to determine the annual average. As a rule, such systemsare based on solid-state nuclear track detectors (26). International comparisons betweenlaboratories in Europe measuring radon in the air, have been organized by the Commission ofthe European Communities and by the National Radiological Protection Board in the UnitedKingdom (27).For epidemiological studies, retrospective measurement methods are desirable. Such methodshave been developed but not sufficiently evaluated (28). A continuous recording method isuseful in choosing the best mitigation method. The origin of the radon inflow can bedetermined by short-term measurements in several rooms and at various locations withinrooms.Routes of exposureThe highest exposure usually results from inhalation of radon and its progeny. High levels ofradon in domestic water might also give high exposures through the intake of water takendirectly from the tap (29). Radon dissolves in water, but is easily removed when the water isheated or used for other purposes. Radium and the long-lived radon progeny contained in foodcontribute to exposure by ingestion. However, the consumption of foodstuffs with highconcentrations is generally low.Underground miners have historically been exposed to very high concentrations of radon,especially in uranium mines. Nowadays the levels in most mines have been reducedsubstantially. The general population in several regions is exposed to high concentrations ofradon due to the geology, building construction and domestic habits. Indoor concentrations of10 000 Bq/m3 and higher have been found in dwellings, for example in Finland (30), Sweden(31) and Germany (32). Other buildings may also have high concentrations.ToxicokineticsAbsoption and dosesFollowing inhalation, some of the radon progeny are deposited and become attached to thebronchial and bronchiolar epithelium. Deposited activity will irradiate the cells with alphaparticles. The most critical cells are currently considered to be the basal and secretory cells inthe bronchial epithelium (33). A small portion of deposited activity is spread by the bodyfluids to other organs. Unattached progeny are largely filtered by the nose and, to somedegree, in the larynx region. Ingested radon and the other radionuclides in the uranium chainmay also be taken up by the gastrointestinal tract and distributed to other organs (29,34). Mostof the ingested radon in water is transferred to the blood.The effective half-life for irradiation of the bronchial epithelium by radon progeny followinginhalation exposure is about 30 minutes. From the lymph and blood, radon and other nuclidesin the uranium chain are distributed to other organs in the body. The highest inhalation WHO Regional Office for Europe, Copenhagen, Denmark, 20015
Chapter 8.3RadonAir Quality Guidelines - Second Editionexposures are given to the bronchial epithelium and the effective dose to the other organsrepresents only a small proportion of the total effective dose (25).The dose to the human lung from inhalation of radon and its progeny is not included in thelatest lung model developed by ICRP (35). The results of epidemiological studies of miners,supported by data from epidemiological studies in dwellings, are considered to be morereliable. Conversion conventions are used for comparing the effective dose from exposure tosources of radiation other than radon inhalation. ICRP has calculated these to be 1.1 mSv permJ·h/m3 at home and 1.4 mSv per mJ·h/m3 at work (25) for the ICRP reference population.An exposure to 100 Bq/m3 in dwellings with 80% occupancy would give 1.8 mSv/year.Biomarkers of exposureA correlation of the activity of lead-210 in bone with the cumulated radon exposure frominhalation of radon has been suggested (36,37). Lead-210 is incorporated in bone and has abiological half-life of 10–15 years. Its physical half-life is 22.2 years. Lead-210 in the bonesof miners can be derived from the decay of radon gas and radon progeny and also fromuranium dust.In vivo gamma spectrometric measurements of lead-210 in skull bones have been made inminers exposed to very high radon levels (38). Owing to the insensitivity of the method andthe influence of other sources of lead-210 intake (water, food, etc.) such measurements havenot been feasible for persons exposed to radon in dwellings. This also holds true for in vitromeasurements in bone (36). In addition, there are practical and ethical problems in samplingfor in vitro measurements.Exposure to ionizing radiation increases the number of chromosome aberrations in humanblood lymphocytes (39). This increase mainly reflects the last year of exposure, owing torepair mechanisms, and limits the usefulness of this parameter as a marker of long-termexposure.Health effectsEffects on experimental animals and in vitro test systemsStudies in experimental animals show that lung cancer may be induced by exposures to radonprogeny as low as about 20 WLM (40), corresponding to a lifetime (70-year) exposure ofabout 60 Bq/m3. Most experiments have been conducted on male rats; overall, the riskestimates are comparable to those obtained from studies in miners. There is evidence of aninverse dose–rate effect at high concentrations ( 100 WL), but this effect was not seen at lowlevels in one experiment (41). Exposure to tobacco smoke following completed exposure toradon progeny seems to result in a potentiating effect (42). Associated exposure to otherfactors, however, such as tobacco smoke or uranium ore dust, is not required for carcinomainduction by radon progeny. There is some evidence of increased tumour rates at other sitesthan the respiratory tract in laboratory animals exposed to radon progeny (41,43), but thefindings are not consistent.Molecular and cellular radiobiology have contributed to the understanding of mechanismsinvolved in carcinogenesis caused by ionizing radiation. Alpha irradiation can inducemutations and other types of DNA damage, which may affect oncogenes and tumoursuppressor genes, leading to impaired cellular growth control (43). This may result in WHO Regional Office for Europe, Copenhagen, Denmark, 20016
Chapter 8.3RadonAir Quality Guidelines - Second Editionneoplasm formation. Cancer induction in rats exposed to radon progeny by inhalation can befitted to a model based on inactivation of both alleles of tumour suppressor genes (44). Thismay point to a mechanism for cancer induction by radon progeny relevant to human exposure.Effects on humans – lung cancerEpidemiological studies on underground miners provide strong evidence that inhalation ofradon progeny is associated with an increased risk of lung cancer. A linear relative risk modelseems to fit the data over a wide range of exposures (25,45). Combined analyses of the minercohorts have indicated excess relative risks per WLM of about 0.5–1.5%. The excess relativerisk per WLM decreased with attained age and time since exposure. Over a broad range oftotal cumulative dose, a higher lung cancer risk was associated with underground exposuresreceived at low rates, suggesting that either low exposure rates, long duration of exposure orboth may be especially hazardous. Data were too sparse to determine whether this “inversedose rate effect” applied to the ranges of exposures found in most homes. Most of the minerswere smokers, but a clear increase in lung cancer risk with exposure was also demonstratedamong the nonsmokers. The joint effect of radon exposure and smoking showed no clearpattern in the different miner cohorts, although the data were consistent with an interactionbetween additive and multiplicative. There is some evidence that lung tumours in minersexposed to radon progeny have a characteristic mutational pattern in the p53 tumoursuppressor gene (46,47), but these data need confirmation.Lung cancer risks related to residential radon exposure have been investigated with differentepidemiological designs (48). Ecological studies comparing aggregated data on residentialradon concentrations and lung cancer rates in geographical areas are unsuitable for riskassessment, mainly because of imprecise exposure estimates and poor control of confoundingfactors. The most relevant evidence comes from epidemiological investigations usingindividual data on exposure and health effects, mainly case–control studies. Early case–control studies based the exposure estimation on residential characteristics and/or geologicalinformation, sometimes supplemented with radon measurements. These studies are not usefulfor quantitative risk assessment, primarily because of crude exposure data and limited size.A few recent case–control studies based the exposure assessment on radon measurements inthe homes of study subjects, covering residential periods of about 10–30 years. Four of thestudies come from Scandinavia, three from North America and one from China. Axelson et al.(49) conducted radon progeny measurements in 142 lung cancer patients and 264 controlswith 30 years or more of residency in areas with uranium-rich alum shale deposits in southernSweden. In rural areas, the relative risk (RR) of lung cancer was 1.4 (95% confidence interval,CI: 0.6–3.2) comparing those with radon progeny levels above 150 Bq/m3 and below 50Bq/m3. The corresponding RR in urban areas was 0.8 (95% CI, 0.2–3.0). The authorscautioned that the crude classification of smoking may have led to residual confounding.Pershagen et al. (50) carried out a study in Stockholm on 210 female lung cancer patients and400 controls. An RR of 1.7 (95% CI, 1.0–2.9) was associated with a time-weighted averageradon exposure exceeding 150 Bq/m3 compared to an exposure of up to 75 Bq/m3. Positivetrends were observed correlating the RR of lung cancer with estimated cumulative radonexposure. Adjustment for the percentage of time actually spent in the home reduced theevidence of a dose–response relationship. The size of the study was too small to allowmeaningful analyses of interactions between radon exposure and smoking. WHO Regional Office for Europe, Copenhagen, Denmark, 20017
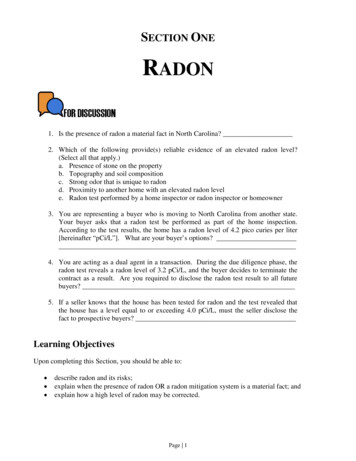
Chapter 8.3RadonAir Quality Guidelines - Second EditionA nationwide study of 1360 lung cancer patients, 1424 population controls and 1360 controlsmatched on vital status (excluding deaths from smoking-related diseases) was also carried outin Sweden (51). Radon measurements were performed over a three-month period during theheating season in 8992 dwellings occupied for more than two years by study subjects. The RRof lung cancer increased with both estimated time-weighted exposure and cumulativeexposure. A linear RR model appeared consistent with the data (Fig. 1). The RRs for timeweighted exposures of 140– 400 Bq/m3 and 400 Bq/m3 compared to 50 Bq/m3 were 1.3(95% CI, 1.1–1.6) and 1.8 (1.1–2.9), respectively. A supra-additive interaction between radonexposure and smoking was indicated (P 0.02) and the data were consistent with amultiplicative effect of the two factors.Fig. 1. Relative risk for lung cancer related to estimated time-weighted averagearesidential radon exposure in the nationwide Swedish studyaBars indicate 5% confidence intervals.Source: Pershagen et al. (51).A study of men from a rural area in Finland, including 238 lung cancer patients and 434controls, found no statistically significant relationship between indoor radon exposure and therisk of lung cancer (52). The exposure–response curve initially showed an increase but thendeviated downward at the higher exposure levels. The RR in the highest quintile of radonexposure ( 265 Bq/m3) was 1.23 (95% CI, 0.71– 2.13) compared to the lowest quintile ( 109 Bq/m3). A stronger effect of radon was suggested in heavy smokers. The authors notedthat the results did not conflict with risk estimates based on the miner studies.A study in women from New Jersey included 433 lung cancer patients and 402 controls (53).The RR was 4.2 (90% CI, 0.99–7.5) comparing those with indoor radon concentrations of atleast 4j pCi/l (148 Bq/m3) and below 1 pCi/l (37 Bq/m3). The strongest relation to radonappeared among smokers of fewer than 15 cigarettes per day, but the interpretation of the datawas difficult because of small numbers, particularly in the highest exposure category.Alavanja et al. (54) conducted a study among nonsmoking women in Missouri, whichincluded 538 lung cancer patients and 1183 controls; 30% of the patients and 17% of thecontrols were former smokers. An RR for lung cancer of 1.20 (95% CI, 0.9–1.7) was observedin the highest quintile of radon exposure (time-weighted average radon level exceeding 2.46pCi/l or 91 Bq/m3) in comparison to the lowest quintile (radon levels up to 0.79 pCi/l or 29Bq/m3). A positive exposure–response trend was suggested for the adenocarcinoma cell type,with an RR of 1.66 in the highest exposure category (95% CI, 1.0–2.6).A study in Winnipeg, Canada included 738 lung cancer patients and 738 controls (55). Whenthe exposure assessment covered the period 5–30 years prior to enrolment in the study, RRs of0.97 (95% CI, 0.81–1.15) and 0.93 (0.71–1.11) per unit of cumulative radon exposure wereobserved for bedroom (3750 Bq/m3·years) and basement (5000 Bq/m3·years) measurements,respectively. Restricting the analysis to subjects with at least 75% coverage with radonmeasurements, the corresponding RRs were 1.18 (0.95–1.46) and 1.12 (0.90–1.41),respectively. The authors cautioned that the imputation of missing radon values might haveintroduced a downward bias in the risk estimates. WHO Regional Office for Europe, Copenhagen, Denmark, 20018
Chapter 8.3RadonAir Quality Guidelines - Second EditionBlot et al. (56) performed a case–control study among women in Shenyang, China, an areawith particularly high lung cancer rates in females. The study included 308 lung cancerpatients and 356 controls. No association between radon and lung cancer was found. Therelative risk was 0.7 (no confidence interval given) in those with residential radon levels of 8pCi/l (296 Bq/m3) and higher, compared to subjects with up to 1.9 pCi/l (70 Bq/m3). It shouldbe noted that this study population had very high indoor particulate exposure, quite differentfrom those in the other study populations described above, and this may have reduced thebronchial dose from radon.An overall assessment of the epidemiological evidence on residential radon exposure and lungcancer shows that most studies lacked an adequate statistical power to detect effects of a sizeconsistent with linear extrapolation of exposure–response relationships observed in miners.For example, residential mobility tends to reduce the variance of exposure within a populationand thereby increase the sample size requirements. The largest and most conclusive residentialstudy showed an association between estimated radon exposure and lung cancer risk that wasin general agreement with most other residential studies as well as with risk estimates derivedfrom underground miner studies. Several extensive epidemiological studies on residentialradon exposure and lung cancer are currently under way, and will strengthen the basis for riskestimation over the next few years.Other cancersA few ecological studies show correlations between domestic radon levels and cancer ofspecific sites (48), but no clear pattern has emerged. Darby et al. (57) performed an analysis ofcancer mortality in 11 miner cohorts. For all cancer other than lung cancer the total number ofdeaths observed was close to the number expected from mortality rates in the areassurrounding the mines (RR, 1.01; 95% CI, 0.95–1.07, based on 1179 deaths) and mortality didnot increase with increasing cumulative exposure to radon. Among individual categories ofcancer examined, mortality was significantly increased for cancers of the stomach (RR, 1.33;95% CI, 1.16–1.52) and liver (RR, 1.73; 95% CI, 1.29–2.28). For leukaemia, mortality wasincreased in the period less than 10 years since starting work (RR, 1.93; 95% CI, 1.19–2.95)but not subsequently. For none of these diseases was mortality significantly related tocumulative exposure to radon decay products. Among the remaining individual categories ofcancer other than lung cancer, mortality was related to cumulative exposure only for cancer ofthe pancreas, and in the period less than 10 years since start of employment for other andunspecified cancers (likely to include lung cancer metastases). Overall, the study providesevidence that high concentrations of radon in air do not cause a material risk of mortality fromcancers other than lung cancer.Evaluation of human health risksExposure evaluationExposure to radon and radon progeny is the dominating source of exposure to ionizingradiation in most countries. The radon levels vary considerably between dwellings, anddepend primarily on inflow of soil gas and the type of building material. Arithmetic meanconcentrations in European countries range from about 20 Bq/m3 to 100 Bq/m3, with evenhigher levels in some regions. The geometric mean concentrations are generally about 20–50% lower because of the skewed distribution of radon levels. WHO Regional Office for Europe, Copenhagen, Denmark, 20019
Chapter 8.3RadonAir Quality Guidelines - Second EditionHealth risk evaluationA few recent case–control studies provide evidence on lung cancer risks related to residentialradon exposure. In general, the exposure assessment was based on radon measurements inhomes of the people being studied, covering residential periods of about 10–30 years (48).Some of the studies indicate increased relative risks for lung cancer by estimated timeweighted residential radon level or cumulative exposure, but the picture is not fully coherent.It should be realized, however, that most studies lacked an adequate statistical power. Thelargest of the studies, with analyses over the biggest range of exposure, showed a clearincrease in risk with estimated exposure to radon, which appeared consistent with a linearrelative risk model (51). The interaction between radon exposure and smoking with regard tolung cancer exceeded additivity and was close to a multiplicative effect.To date, risk estimation for residential radon exposure has often been based on extrapolationof findings in underground miners. Several circumstances make such estimates uncertain forthe general population, however, including the possible influence of other exposure factors inthe mines and differences in age, sex, size distribution of aerosols, the attached fraction ofradon progeny, breathing rate and route (43,58). Furthermore, the relevance is not fullyunderstood of the apparent inverse effect of exposure rate observed in miners and the possibledifference in relative risk estimates for nonsmokers and smokers (45).It is of interest to compare risk estimates based on the nationwide Swedish study onresidential radon exposure and lung cancer (51) with those obtained from miners. Fig. 2shows the estimated attributable proportion of lung cancer related to residential radon, usingrisk estimates from the Swedish study and assuming a linear relative risk model. Imprecisionin the exposure estimation leads to attenuation of the exposure–response relationship, and ithas been indicated that this may have led to an underestimation of the risk by a factor of up toabout 2 (59). It is suggested that the true values lie between the unadjusted and adjustedestimates.Fig. 2 also gives estimates of attributable proportion based on extrapolations fromunderground miners, after adjusting for dosimetric differences between mines and homes. Asan example the radon concentration distribution in western Germany, with an arithmetic meanof 50 Bq/m3, leads to an attributable proportion of 7% (95% CI, 1–29%) using the model inLubin et al. (45) and 6% (2–17%) using that of the National Academy of Sciences (43).Corresponding values based on the Swedish residential study are 5% and 9%, respectively,without and with adjustment for exposure misclassification.Fig. 2. Estimated attributable proportion of lung cancer related to residential radonexposure based on the national Swedish study and extrapolations from minersTable 2 shows population risk estimates under three different assumptions with regard topopulation exposure, taken to represent long-term residential exposure in European countrieswith relatively high, medium and low residential radon concentrations. The estimatedattributable proportion of lung cancer related to residential radon exposure ranges from 2–5%in low-exposure areas to 9–17% in high-exposure areas.Table 2 also shows estimated excess lifetime deaths from lung cancer related to residential WHO Regional Office for Europe, Copenhagen, Denmark, 200110
Chapter 8.3RadonAir Quality Guidelines - Second Editionradon. Assuming that lung cancer deaths constitute 3% of total deaths, it is estimated thataround 600–1500 excess lung cancer deaths occur per million people exposed on average to25 Bq/m3 over their lifetime. For an average exposure of 100 Bq/m3, the correspondingestimate ranges from 2700 to 5100 excess lung cancer deaths per million people exposed.Table 2. Attributable proportion of lung cancer related to long-term residential radonexposure in regions with high, medium and low indoor concentrations aExposure categoryHighMediumLowArithmetic m
Chapter 8.3 Radon General description Radon is a radioactive noble gas. Of all radon isotopes only two, radon-222 (radon) and radon-220 (thoron) occur in significant amounts indoors. Radon-222 is one of the decay products of uranium-238 (half-life 4.5 109 years) and radon-220, a nuclide thorium-232 decay (half-life 1.4 1010 years). The .