Transcription
MICROS RES ReportsMICROS-Fidelio Asia PacificSuite 7, 1st Floor,13a Narabang WayBelrose NSW 2085Australia 61 (2) 9485 1000 Telephone 61 (2) 9485 1099 FacsimileTuesday, 16 March 2010MICROS-Fidelio Asia PacificA subsidiary of MICROS Systems, Inc.
Table of Contents1.1DEFINING A SITES REVENUE CENTRES41.2DEFINING A SITES REPORT REQUIREMENTS51.2.11.2.21.2.31.2.41.2.51.3SYSTEM REPORTSREVENUE CENTRE REPORTDAILY REPORTSCONSOLIDATED REPORTS2828282829AUTOSEQUENCES AND REPORTSRUNNING REPORTS293033SALES BALANCE REPORTINGPERIOD REPORTINGCASH MANAGEMENTGUEST CHECK REPORTINGEMPLOYEE REPORTINGLABOUR REPORTINGKDS REPORTINGTABLE MANAGEMENT REPORTINGGROUP REPORTINGMENU ITEM REPORTSOTHER REPORTING3434353535353536363636REPORT TEMPLATESREPORT CLASSESREPORT DATE RANGEEMPLOYEE ACCESS AND PRIVILEGESREPORT SUMMARY SECTIONCHECK SUMMARY SECTIONGENERAL TRACKING SECTION50505661REPORT BALANCING1.9.13737424547UNDERSTANDING MICROS RES REPORTS1.8.11.8.21.8.31.928ENABLING AND CONFIGURING MICROS REPORTS1.7.11.7.21.7.31.7.41.8242525252526MICROS REPORTS 6.91.6.101.6.111.7SERVING PERIODSCASHIERSEMPLOYEESREVENUE CENTRECASH MANAGEMENTSCENARIOS OF BALANCING METHODSGENERATING REPORTS1.5.11.5.21.624REPORT TYPES1.4.11.4.21.4.31.4.41.556101519REPORT BALANCING RT GROUPSMAJOR GROUPSFAMILY GROUPSMENU ITEM GROUPSMENU ITEM REPORTING66CHECK BALANCING67Page 2 of 114MICROS-Fidelio Asia PacificA subsidiary of MICROS Systems, Inc.
1.9.21.9.31.9.41.9.51.9.61.9.71.10TRACKING GROUPSHISTORICAL TOTALS81SUBTOTAL DISCOUNTSITEM DISCOUNTSITEM DISCOUNT SET TO REPORT AS SUBTOTALRECOMMENDED CONFIGURATIONSALES TOTAL REPORTING1.12.1757579DISCOUNT 274HISTORICAL TOTALS AND TRACKING GROUP1.10.11.10.21.11RECOGNISING REVENUE AND PAYMENTSPAYMENTS BALANCINGSALES BALANCINGTOTAL REVENUE BALANCINGBALANCE CHECKTOTAL PAYMENTS8182848688SALES ITEMISER REPORTING881.13MAJOR GROUP REPORTING911.14SERVICE CHARGE REPORTING941.14.11.15REPORT VIEWER1.15.11.15.21.15.31.15.41.15.51.16GIFT CERTIFICATES AND DEPOSITS REDEEMED9598INSTALLATIONAVAILABLE HTML PAGESACCESSING REPORT VIEWERLAYOUTCONFIGURATION99100101106109APPENDIX A112Page 3 of 114MICROS-Fidelio Asia PacificA subsidiary of MICROS Systems, Inc.
1.1Defining a Sites Revenue CentresBefore beginning an installation it is important to understand the sites requirements forthe configuration of Revenue Centres (RVC).Revenue Centres are defined within the system to provide sales tracking, accounting,and transaction control. Typically, an RVC matches an outlet in the restaurant such asa bar, restaurant, or a retail shop. The configuration of RVC’s should be discussed withthe site, as the setup will also impact the operations of the business.By defining separate RVC’s for each outlet within the organisation, the site will havethe ability to report at a separate sublevel on each configured outlet. E.g. sales andmenu item reports can be run for just the bar or just the restaurant rather than a systemreport which will provide the total sales for both outlets with no breakdown.Where separate RVC’s have been configured, the site will still have the ability to runsystem reports to get the total sales and menu item reporting for the system.One of the main limitations of this setup is the ability to access checks belonging toanother RVC through the POS from different outlets. Checks can be transferred withinthe system to another outlet, however they cannot be ‘picked up’, ‘modified’ or‘added’ to from an RVC that does not ‘own’ the check. E.g. if a check is opened inthe restaurant and the customers finish their meal and move to the bar, the checkwould need to be transferred to the bar before any further items can be added, orthe check tendered.In contrast to this operational limitation, configuring separate RVC’s does allow the siteto utilise different features within each of the outlets, this can include automaticdiscounting, conversational ordering, fast transactions opposed to table service,different security requirements, service charges, serving periods and more.In a hotel environment it is often necessary to separate the outlets by RVC to ensurethat the posting to the front office system can identify where, what and when thecustomer dined. E.g. a posting from the restaurant at lunch time can be configured toshow on the customers front office account as restaurant, lunch, food. Thisconfiguration is dependent on the type of interface the site is running.As a general rule, there should be one RVC configured for each outlet or departmentin an organisation. E.g. restaurant, bar, room service, mini bar, retail, however thelimitations and benefits of separating RVC’s should also be explained to the site.Where the restaurant and bar are in the same location and operate with the samestaff and menu, it may be more appropriate from an operational perspective to keepthe setup as one RVC.Page 4 of 114MICROS-Fidelio Asia PacificA subsidiary of MICROS Systems, Inc.
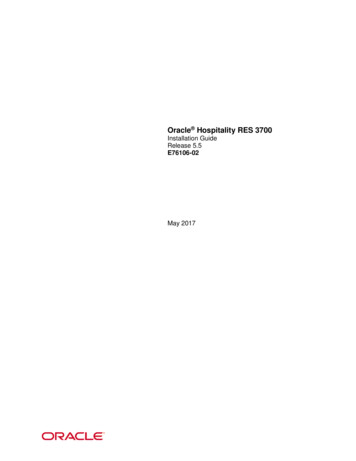
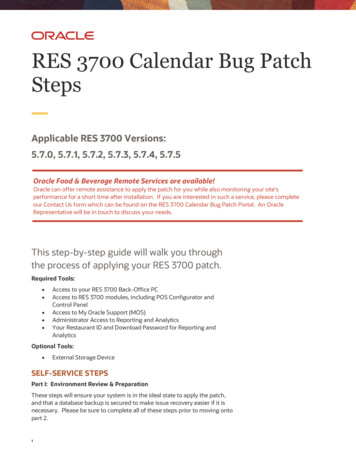
1.2Defining a Sites Report RequirementsEach site will have different report requirements, however most sites will depend onthe MICROS RES reports to assist in analysing their business, fulfilling accountingrequirements and improving operations.It is important that the system is configured accurately and in a way that will meet thesites requirements. There are several configuration options for reporting, this sectionwill explain how the system reports, and the recommended setup to match thedifferent requirements of a site.1.2.1Report GroupsMICROS RES has four levels of reporting for menu items, each menu item can beprogrammed to post to one ‘Major Group’, ‘Family Group’ and ‘Menu Item Group’.The system can then report on the sales of menu items by: Major Group Family Group Menu Item Group Menu Item‘Major Groups’, ‘Family Groups’ and ‘Menu Item Groups’ are collections of menu itemtotals that are used to report sales. Each menu item must have a ‘Major Group’ and‘Family Group’ configured, however the ‘Menu Item Group’ reporting is optional.Below is an example of the reporting hierarchy and the types of categorisation that asite could use:Page 5 of 114MICROS-Fidelio Asia PacificA subsidiary of MICROS Systems, Inc.
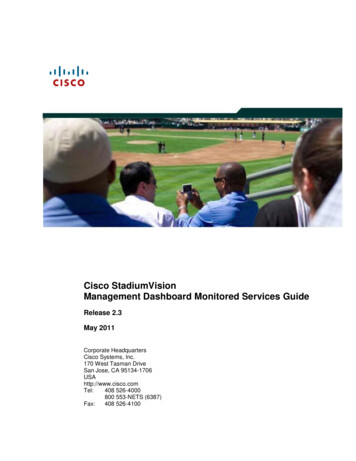
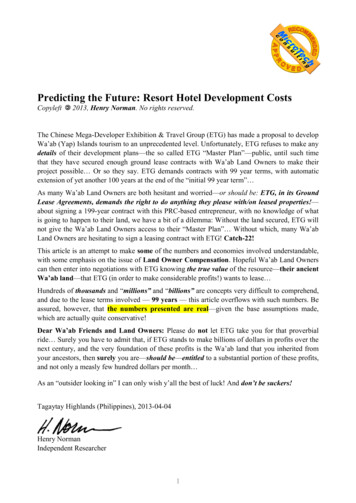
1.2.2Major Groups‘Major Groups’ are the highest level of reporting that can be configured, typically asite will categorise their items into 3-5 main groups. Each menu item must have a‘Major Group’ configured, and only one ‘Major Group’ can be linked to each item.Examples of standard ‘Major Groups’ that are typically configured include: Food Beverage Miscellaneous RetailThere are several ‘Major Group’ reports that can be enabled for the site to run. Belowis a list of the recommended reports that should be enabled: RVC Major Group Sales Detail RVC Major Group Sales Summary SYS Major Group Sales Detail SYS Major Group Sales Summary Consolidated RVC Major Group Sales Summary Consolidated SYS Major Group Sales Summary Consolidated RVC Major Group Sales Detail/Graph Consolidated SYS Major Group Sales Detail/GraphNOTE: For more information on revenue centre, system, daily and consolidatedreports see section 1.4Below are some sample ‘Major Group’ reports:Page 6 of 114MICROS-Fidelio Asia PacificA subsidiary of MICROS Systems, Inc.
Sales QuantityThis is the number of menu items that were sold in this ‘Major Group’Sales Quantity % ofTotalThis is the number of menu items sold, expressed as a percentage of the total number of items sold for all ‘MajorGroups’, this field is calculated by dividing the quantity sold for each major group by the total quantity of items sold.E.g. Food Sales ((4/10 .4) x 100 40%).Net SalesThis is the net sales value for each ‘Major Group’, the net sales is expressed exclusive of tax and item discountsNet Sales % of TotalThis is the net sales value of each ‘Major Group’ expressed as a percentage of the total net sales for all ‘Major Groups’.This field is calculated by dividing the net sales of each ‘Major Group’ by the total net sales for all ‘Major Groups’. E.g.for the ‘Food Major Group’ (63.94/140.00 .45.46) x 100 45.46%)Grand Total QuantityThis is the total quantity of items sold for all ‘Major Groups’ combinedGrand Total Net SalesThis is the total net sales amount for all ‘Major Groups’ combined, exclusive of tax and item discountsSubtotal DiscountsThis is the total of all subtotal discounts that were applied, this total includes item discounts that were configured toreport as subtotalSuppressedThe value in this field represents any items that were sold and configured be excluded from the net sales total. Menuitems can be linked to a ‘Menu Item Class’ that has an option enabled to ‘Suppress from Net Sales Total’Net Sales TotalThis value will display the total of all ‘Major Groups’ less any subtotal discounts and suppressed net sales totalsPage 7 of 114MICROS-Fidelio Asia PacificA subsidiary of MICROS Systems, Inc.
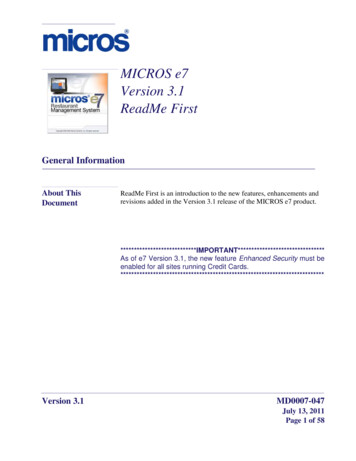
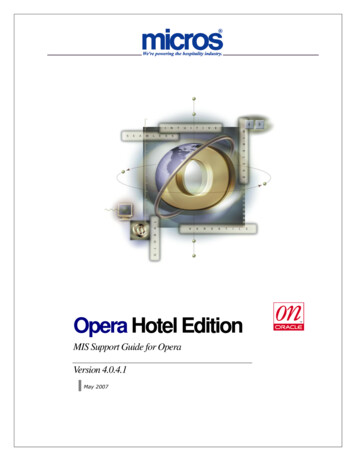
Sales QuantityThis is the number of menu items that were sold in this ‘Major Group’Sales Quantity % of TotalThis is the number of menu items sold expressed as a percentage of the total number of items sold for all ‘MajorGroups’, this field is calculated by dividing the quantity sold for each ‘Major Group’ by the total quantity of itemssold. E.g. ‘Food Sales’ ((4/10 .4) x 100) 40%.Return QuantityThis is the total quantity of items that were returned using the ‘Return’ function in POS Operations for each ‘MajorGroup’Return Quantity % ofTotalThis is the number of items that were returned using the ‘Return’ function in POS Operations expressed as apercentage of the total number of items returned for all ‘Major Groups’.Gross SalesThe gross sales is the total quantity of sales before any item discounts have been subtracted, this value is alwaysshown net of any inclusive taxes for each ‘Major Group’Gross Sales % of TotalThis is the gross sales for each ‘Major Group’ expressed as a percentage of the total gross sales for all ‘Major Groups’.E.g. ‘Food Gross Sales’ \ ‘Total Gross Sales’ x 100 (( 63.64\ 140.00) x 100) 45.46%Page 8 of 114MICROS-Fidelio Asia PacificA subsidiary of MICROS Systems, Inc.
Item DiscountThis is the total value of all item discounts that were applied to the specified ‘Major Group’. The item discountsrepresented in this field will only be those that are not configured to report as subtotalItem Discount % of TotalThis field will show the item discounts for each ‘Major Group’ expressed as a percentage of total item discounts forall ‘Major Groups’, the item discounts used to calculate this percentage will not have the option enabled to ‘Reportas Subtotal’. E.g. ‘Food Major Group Item Discounts’ \’Total Major Group Item Discounts’ ‘Item DiscountPercentage’Net SalesThe Net Sales fields will display the total ‘Major Group Sales’ net of item discounts and net of taxNet Sales % of TotalThis field will show the net sales of each ‘Major Group’ expressed as a percentage of the total net sales for all ‘MajorGroup’s. E.g. ‘Food Net Sales’ \ ‘Total Next Sale’s ‘% Net Sales Total’ ( 63.64 \ 140.00) x 100) 45.46%Grand Total SalesQuantityThis is the total number of items that have been sold for all ‘Major Groups’Grand Total ReturnQuantityThis is the total number of returns that have been done for all ‘Major Groups’ using the ‘Return’ function in POSOperationsGrand Total Gross SalesThis is the total Sales for all ‘Major Groups’ excluding tax and item discountsGrand Total ItemDiscountsThis is the total value of item discounts for all ‘Major Groups’, only item discounts that are not configured to report assubtotal will display in this fieldGrand Total Net SalesThis is the total value of sales less item discounts and tax for all ‘Major Groups’Other DiscountsThis is the total of all other discounts (excluding item discounts not configured to report as subtotal). E.g. all subtotaldiscounts and item discounts configured to report as subtotalSuppressedThis is the total value of menu items that have been configured with the option enabled to ‘Suppress From Net SalesTotal’ in the ‘Menu Item Class’Net Sales TotalThis is the total value of all ‘Major Groups’ once all discounts and suppressed totals have been removedPage 9 of 114MICROS-Fidelio Asia PacificA subsidiary of MICROS Systems, Inc.
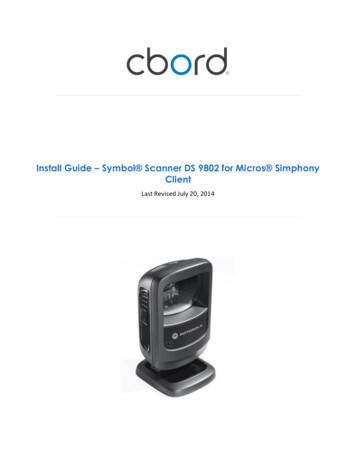
1.2.3Family Groups‘Family Groups’ are the second level of reporting that can be configured, typically these allow the site to categorise their items intoreportable groups for the purpose of menu mix reporting. ‘Family Groups’ must be configured for each menu item, and the net salestotal of all ‘Family Groups’ should balance to the net sales total of all ‘Major Groups’.Examples of ‘Family Groups’ that could be configured include: Entrees Mains Desserts Beer Wine SpiritsThere are several ‘Family Group’ reports that can be enabled for the site to run. Below is a list of the recommended reports that shouldbe enabled:Page 10 of 114MICROS-Fidelio Asia PacificA subsidiary of MICROS Systems, Inc.
RVC Family Group Sales Detail RVC Family Group Sales Summary SYS Family Group Sales Detail SYS Family Group Sales Summary Consolidated RVC Family Group Sales Summary Consolidated SYS Family Group Sales Summary Consolidated RVC Family Group Sales Detail/Graph Consolidated SYS Family Group Sales Detail/GraphNOTE: For more information on revenue centre, system, daily and consolidated reports see section 1.4Below are some sample ‘Family Group’ reports:Sales QuantityThis is the number of menu items that were sold in this ‘Family Group’Sales Quantity % ofTotalThis is the number of menu items sold, expressed as a percentage of the total number of items sold for all ‘FamilyGroups’, this field is calculated by dividing the quantity sold for each ‘Family Group’ by the total quantity of items sold.E.g. ‘Entree Sales’ ((3/20 .15) x 100 15%)Page 11 of 114MICROS-Fidelio Asia PacificA subsidiary of MICROS Systems, Inc.
Net SalesThis is the net sales value for each ‘Family Group’, the net sales is expressed exclusive of tax and item discountsNet Sales % of TotalThis is the net sales value of each ‘Family Group’ expressed as a percentage of the total net sales for all ‘FamilyGroups’. This field is calculated by dividing the net sales of each ‘Family Group’ by the total net sales for all ‘MajorGroups’. E.g. for the ‘Entree Family Group’ (46.32/331.35 14.13) x 100) 14.13%Grand Total QuantityThis is the total quantity of items sold for all ‘Family Groups’ combinedGrand Total Net SalesThis is the total net sales amount for all ‘Family Groups’ combined, exclusive of tax and item discountsSubtotal DiscountsThis is the total of all subtotal discounts that were applied, this total includes item discounts that were configured toreport as subtotalSuppressedThis is the total value of menu items that have been configured with the option enabled to ‘Suppress From Net SalesTotal’ in the ‘Menu Item Class’Net Sales TotalThis value will display the total of all ‘Family Groups’ less any subtotal discounts and suppressed net sales totalsSales QuantityThis is the number of menu items that were sold in this ‘Family Group’Sales Quantity % of TotalThis is the number of menu items sold, expressed as a percentage of the total number of items sold for all ‘FamilyPage 12 of 114MICROS-Fidelio Asia PacificA subsidiary of MICROS Systems, Inc.
Groups’, this field is calculated by dividing the quantity sold for each ‘Family Group’ by the total quantity of itemssold. E.g. ‘Entree Sales’ ((3/20 .15) x 100) 15%Return QuantityThis is the total quantity of items that were returned using the ‘Return’ function in POS Operations for each ‘FamilyGroup’Return Quantity % ofTotalThis is the number of items that were returned using the ‘Return’ function in POS Operations expressed as apercentage of the total number of items returned for all ‘Family Groups’Gross SalesThe gross sales is the total quantity of sales before any item discounts have been subtracted, this value is alwaysshown net of any inclusive taxes for each ‘Family Group’Gross Sales % of TotalThis is the gross sales for each ‘Family Group’ expressed as a percentage of the total gross sales for all ‘FamilyGroups’. E.g. ‘Entree Gross Sales’ \ ‘Total Gross Sales’ x 100 (( 46.82\ 331.35) x 100) 14.13%Item DiscountThis is the total value of all item discounts that were applied to the specified ‘Family Group’. This field will not displayitem discounts that are configured to report as subtotalItem Discount % of TotalThis field will show the item discounts for each ‘Family Group’ expressed as a percentage of total item discounts forall ‘Family Groups’, the item discounts used to calculate this percentage will not have the option enabled to reportas subtotal. E.g. ‘Entree Family Group Item Discounts’ \ ‘Total Family Group Item Discounts’ ‘Item DiscountPercentage’Net SalesThe net sales field will display the total ‘Family Group Sales’ net of item discounts and net of taxNet Sales % of TotalThis field will show the net sales of each ‘Family Group’ expressed as a percentage of the total net sales for all‘Family Groups’. E.g. ‘Entree Net Sales’ \ ‘Total Next Sales’ ‘% Net Sales Total’ ( 46.82 \ 331.35) x 100) 14.13%Grand Total SalesQuantityThis is the total number of items that have been sold for all ‘Family Groups’Grand Total ReturnQuantityThis is the total number of returns that have been done for all ‘Family Groups’ using the ‘Return’ function in POSOperationsGrand Total Gross SalesThis is the total sales for all ‘Family Groups’ excluding tax and item discountsGrand Total ItemDiscountsThis is the total value of item discounts for all ‘Family Groups’, only item discounts that are not configured to report assubtotal will display in this fieldGrand Total Net SalesThis is the total value of sales less item discounts and tax for all ‘Family Groups’Page 13 of 114MICROS-Fidelio Asia PacificA subsidiary of MICROS Systems, Inc.
Other DiscountsThis is the total of all other discounts excluding item discounts not configured to report as subtotal. E.g. all subtotaldiscounts and item discounts configured to report as subtotalSuppressedThis is the total value of menu items that have been configured with the option enabled to ‘Suppress From Net SalesTotal’ in the ‘Menu Item Class’Net Sales TotalThis is the total value of all ‘Family Groups’ once all discounts and suppressed totals have been removedPage 14 of 114MICROS-Fidelio Asia PacificA subsidiary of MICROS Systems, Inc.
1.2.4Menu Item Groups‘Menu Item Groups’ are the third level of reporting that can be configured, ‘MenuItem Groups’ are not a required report categorisation, but can be used to break thereporting down into smaller groups for the purpose of menu mix reporting. Because itis not required that all menu items are linked to a ‘Menu Item Group’, there may bediscrepancies between these totals and ‘Family Group’/’Major Group’ totals if onlysome items have been configured to report to a ‘Menu Item Group’.Examples of ‘Menu Item Groups’ that could be configured include: Meat Poultry Seafood Draft Beer Bottled Beer Chardonnay Merlot Vodka BourbonThere are several ‘Menu Item Group’ reports that can be enabled for the site to run,these should only be enabled if the site is using ‘Menu Item Groups’ for reporting.Below is a list of the recommended reports that should be enabled: RVC Menu Item Group Sales Detail RVC Menu Item Group Sales Summary SYS Menu Item Group Sales Detail SYS Menu Item Group Sales Summary Consolidated RVC Menu Item Group Sales Summary Consolidated SYS Menu Item Group Sales Summary Consolidated RVC Menu Item Group Sales Detail Consolidated SYS Menu Item Group Sales DetailNOTE: For more information on revenue centre, system, daily and consolidatedreports see section 1.4Below are some sample Menu Item Group reports:Page 15 of 114MICROS-Fidelio Asia PacificA subsidiary of MICROS Systems, Inc.
Sales QuantityThis is the number of menu items that were sold in this ‘Menu Item Group’Sales Quantity % ofTotalThis is the number of menu items sold, expressed as a percentage of the total number of items sold for all ‘Menu ItemGroups’, this field is calculated by dividing the quantity sold for each ‘Menu Item Group’ by the total quantity of itemssold. E.g. ‘Bottled Beer Sales’ ((5/10 .50) x 100) 50%Net SalesThis is the net sales value for each ‘Menu Item Group’, the net sales are expressed exclusive of tax and item discountsNet Sales % of TotalThis is the net sales value of each ‘Menu Item Group’ expressed as a percentage of the total net sales for all ‘MenuItem Groups’. This field is calculated by dividing the net sales of each ‘Menu Item Group’ by the total net sales for all‘Menu Item Groups’. E.g. for the ‘Bottled Beer Menu Item Group’ (33.18/45.93 .7224) x 100) 72.24%Grand Total QuantityThis is the total quantity of items sold for all ‘Menu Item Groups’ combinedGrand Total Net SalesThis is the total net sales amount for all ‘Menu Item Groups’ combined, exclusive of tax and item discountsSubtotal DiscountsThis is the total of all subtotal discounts that were applied, this total includes item discounts that were configured toreport as SubtotalSuppressedThis is the total value of menu items that have been configured with the option enabled to ‘Suppress From Net SalesTotal’ in the ‘Menu Item Class’Net Sales TotalThis value will display the total of all ‘Menu Item Groups’ less any subtotal discounts and suppressed net sales totalsPage 16 of 114MICROS-Fidelio Asia PacificA subsidiary of MICROS Systems, Inc.
Sales QuantityThis is the number of menu items that were sold in this ‘Menu Item Group’Sales Quantity % of TotalThis is the number of menu items sold, expressed as a percentage of the total number of items sold for all ‘Menu ItemGroups’, this field is calculated by dividing the quantity sold for each ‘Menu Item Group’ by the total quantity ofitems sold. E.g. ‘Bottled Beer Sales’ ((5/10 .50) x 100) 50%Return QuantityThis is the total quantity of items that were returned using the ‘Return’ function in POS Operations for each ‘MenuItem Group’Return Quantity % ofTotalThis is the number of items that were returned using the ‘Return’ function in POS Operations expressed as apercentage of the total number of items returned for all ‘Menu Item Groups’Gross SalesThe gross sales is the total quantity of sales before any item discounts have been subtracted, this value is alwaysshown net of any inclusive taxes for each ‘Menu Item Group’Gross Sales % of TotalThis is the gross sales for each ‘Menu Item Group’ expressed as a percentage of the total gross sales for all ‘MenuItem Groups’. E.g. ‘Bottled Beer Gross Sales’ \ ‘Total Gross Sales’ x 100 (( 33.18\ 45.93) x 100) 72.24%Item DiscountThis is the total value of all item discounts that were applied to the specified ‘Menu Item Group’. This field will notdisplay item discounts that are configured to report as subtotalItem Discount % of TotalThis field will show the item discounts for each ‘Menu Item Group’ expressed as a percentage of total item discountsfor all ‘Menu Item Groups’, the item discounts used to calculate this percentage will not have the option enabled toreport as subtotal. E.g. ‘Bottled Beer Menu Item Group Item Discounts’ \ ‘Total Menu Item Group Item Discounts’ ‘Item Discount Percentage’Net SalesThe Net Sales fields will display the total ‘Menu Item Group’ sales net of item discounts and net of taxPage 17 of 114MICROS-Fidelio Asia PacificA subsidiary of MICROS Systems, Inc.
Net Sales % of TotalThis field will show the net sales of each ‘Menu Item Group’ expressed as a percentage of the total net sales for all‘Menu Item Groups’. E.g. ‘Bottled Beer Net Sales’ \ ‘Total Net Sales’ ‘% Net Sales Total’ ( 33.18 \ 45.93) x 100) 72.24%Grand Total SalesQuantityThis is the total number of items that have been sold for all ‘Menu Item Groups’Grand Total ReturnQuantityThis is the total number of returns that have been done for all ‘Menu Item Groups’ using the ‘Return’ function in POSOperationsGrand Total Gross SalesThis is the total sales for all ‘Menu Item Groups’ excluding tax and item discountsGrand Total ItemDiscountsThis is the total value of item discounts for all ‘Menu Item Groups’, only item discounts that are not configured toreport as subtotal will display in this fieldGrand Total Net SalesThis is the total value of sales less item discounts and tax for all ‘Menu Item Groups’Other DiscountsThis is the total of all other discounts excluding item discounts not configured to report as subtotal. E.g. all subtotaldiscounts and item discounts configured to report as subtotalSuppressedThis is the total value of menu items that have been configured with the option enabled to ‘Suppress From Net SalesTotal’ in the ‘Menu Item Class’Net Sales TotalThis is the total value of all ‘Menu Item Groups’ once all discounts and suppressed totals have been removedPage 18 of 114MICROS-Fidelio Asia PacificA subsidiary of MICROS Systems, Inc.
1.2.5Menu Item ReportingIt is possible to run menu item reports for individual, groups or all menu items that areconfigured in the system. This is the most detailed level of item reporting that the sitewill have to analyse menu mix and sales.It is recommended that the following menu item reports are enabled for the site: RVC Menu Item Sales Detail RVC Menu Item Sales Summary SYS Menu Item Sales Detail SYS Menu Item Sales Summary Consolidated RVC Menu Item Sales Summary Consolidated SYS Menu Item Sales Summary Consolidated RVC Menu Item Sales Detail Consolidated SYS Menu Item Sales Detail Menu Item List ReportNOTE: For more information on revenue centre, system, daily and consolidatedreports see section 1.4.Below are some sample menu item reports:Page 19 of 114MICROS-Fidelio Asia PacificA subsidiary of MICROS Systems, Inc.
Sales QuantityThis is the number of each menu item that was soldSales Quantity % ofTotalThis is the number of menu items sold, expressed as a percentage of the total number of items sold for all menu itemsales within the same ‘Family Group’, this field is calculated by dividing the quantity sold for each menu item by thetotal quantity of items sold for the ‘Family Group’. E.g. ‘Crown Lager Sales’ ((2/8 .25) x 100) 25%Net SalesThis is the net sales value for each menu item, the net sales is expressed exclusive of tax and item discountsNet Sales % of TotalThis is the net sales value of each menu item expressed as a percentage of the total net sales for all menu items withinthat ‘Family Group’. This field is calculated by dividing the net sales of each menu item by the total net sales for allmenu items in the ‘Family Group’. E.g. for the ‘Crown Lager’ menu item (12.72/52.72 .2413) x 100) 24.13%Grand Total QuantityThis is the total quantity of items sold for all menu items combinedGrand Total Net SalesThis is the total net sales amount for all menu items combined, exclusive of tax and item discountsSubtotal DiscountsThis is the total of all subtotal discounts that were applied, this total includes item discounts that were configured toreport as subtotalSuppressedThis is the total value of menu items that have been configured with the option enabled to ‘Suppress From Net SalesTotal’ in the ‘Menu Item Class’Net Sales TotalThis value will display the total of all menu items less any subtotal discounts and suppressed net sales totalsPage 20 of 114MICROS-Fidelio Asia PacificA subsidiary of MICROS Systems, Inc.
Menu ItemThis is the object number and menu item nameMLVLThis is the menu level that the item has been sold on. Different menu levels can be programmed for the same menuitem to represent different prices. E.g. ‘Bottle of Wine’, ‘Glass of Wine’.Sales QuantityThis is the number of each menu item that was soldSales Quantity % of TotalThis is the number of menu items sold expressed as a percentage of the total number of items sold for all menu itemswith the same ‘Family Group’, this field is calculated by dividing the quantity sold for each menu item by the totalquantity of items sold in the same ‘Family Group’. E.g. ‘Crown Lager Sales’ ((2/8 .25) x 100) 25%Return QuantityThis is the total quantity of items that were returned using the ‘Return’ function in POS Operations for each menu itemPage 21 of 114MICROS-Fidelio Asia PacificA subsidiary of MICROS Systems, Inc.
Return Quantity % ofTotalThis is the number of items that were returned using the ‘Return’ function in POS Operations expressed as apercentage of the total number of items returned for all menu items within the ‘Family Group’Gross SalesThe gross sales is the total quantity of sales before any item discounts have been subtracted, this value is alwaysshown net of any inclusive taxes for each menu itemGross Sales % of TotalThis is the gross sales for each menu item expressed as a percentage of the total gross sales for all menu items in the‘Family Group’. E.g. ‘Crown Lager’ Gross Sales \ Total Gross Sales x 100 (( 12.72\ 52.72) x 100) 24.13%Item DiscountThis is the total value of all item discounts that were applied to the specified menu item. This field will not display itemdiscounts that are configured to report as subtotalItem Discount % of TotalThis field will show the item discounts for each menu item expressed as a percentage of total item discounts for allmenu items in the ‘Family Group’, the item discounts used to calculate this percentage will not have the optionenabled to report as subtotal. E.g. ‘Crown Lager Menu Item Discounts’ \ ‘Total Menu Item Discounts’ ‘ItemDiscount Percentage’Net SalesThe net sales field will display the total menu item sales net of item discounts and net of taxNet Sales % of TotalThis field will show the net sales of each menu item expressed as a percentage of the total net sales for all menuitems in the ‘Family Group’. E.g. ‘Crown Lager Net Sales’ \ ‘Total Net Sales’ ‘% Net Sales Total’ ( 12.72 \ 52.72) x1
MICROS-Fidelio Asia Pacific A subsidiary of MICROS Systems, Inc. 1.1 Defining a Sites Revenue Centres Before beginning an installation it is important to understand the sites requirements for the configuration of Revenue Centres (RVC). Revenue Centres are defined within the system to provide sales tracking, accounting, and transaction control.