Transcription
VVANDERBILTPEABODY.,L HIGHERINSTITUTE for RESEARCH on HIGHER EDUCATIONCOLLEGEEDUCATION POLICY INSTITUTE--OCOLLEGEC)AFFORDABILITYN DIAGNOSISRHODE ISLAND
Suggested Citation:Institute for Research on Higher Education. (2016). College Affordability Diagnosis: Rhode Island. Philadelphia,PA: Institute for Research on Higher Education, Graduate School of Education, University of Pennsylvania. osisImage by twenty20.com/@michellehaha
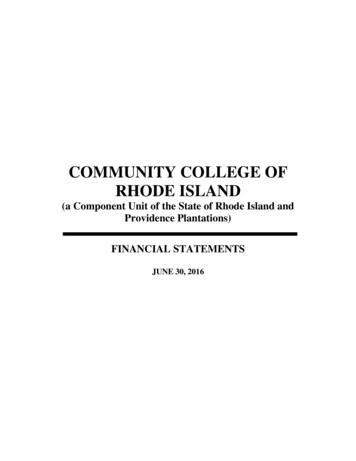
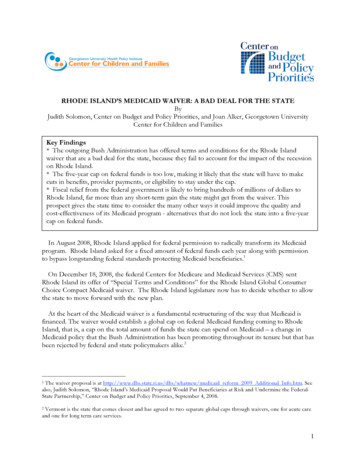
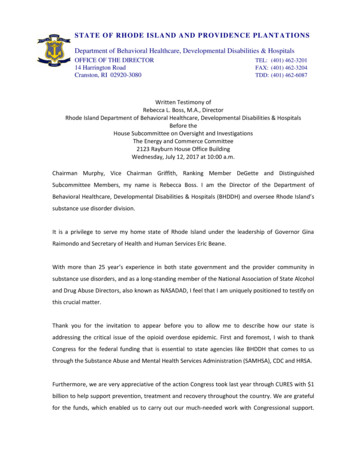
COLLEGE AFFORDABILITY DIAGNOSISRHODE ISLANDRhode Island’s dismal showing on the nationalcollege affordability rankings is fueled by deeppoverty and a high concentration of studentswho attend the most expensive higher educationinstitutions in the state.Rhode Island enrolls the largest concentrationof its students in private four-year nondoctoralcolleges. On average, students attending theseinstitutions would have to work nearly 80 hoursa week to cover the annual costs of attendingfull time. Full-time attendance costs at theseinstitutions would eat up 60 percent of familyincome, on average.The Community College of Rhode Island ismuch more affordable. At this institution, whichenrolls 24 percent of the state’s undergraduates,students would have to work 22 hours a week tocover annual full-time costs of attendanceper year, 139 percent of familyincome would be required toattend the state’s private fouryear nondoctoral institutionsfull time, compared with the30 percent of family income toattend public two-year collegesfull time.48 For Rhode Island families earning more than 110,000, only 20 percent of family incomewould be required to attend the private four-yearnondoctoral colleges full time, and just 6 percent offamily income would be required to attend publictwo-year college full time. By 2020, 71 percent of jobs in Rhode Island willrequire a postsecondary credential. As of 2014,only 44 percent of young adults (age 25–34) and41 percent of working-age adults (age 35–64) hadan associate’s degree or higher.The state faces tough choices as current andfuture workforce needs outpace the numberof Rhode Islanders with the necessarypostsecondary credentials. Higher educational attainment by race and ethnicityvaries considerably. On average, 47 percent ofWhites have an associate’s degree or higher,compared to only 19 percent of Hispanics and 28percent of Blacks. Since 2008, all institutions in the state, with theexception of private research institutions, havebecome less affordable. By 2020, 20 percent of Rhode Island’s public highschool graduates will be Hispanic and 8 percentwill be Black. For Rhode Island families earning 30,000 or less One in fve children lives in poverty in Rhode Island.Rhode Island students attend private four-yearnondoctoral institutions than any other kind of institution, with 39percent enrolled . Families would spend, on average , 60 percentof annual income to pay for full-time attendance.On average , 43 percent of working-age Rhode Islandstate residents (age 25-64) have an associate's degree orhigher. By 2020 , 71 percent of jobs will require anassociate's degree or higher.60%I--71%Jobs requiring associate 1sdegree or higher by 2020Percentage of students attending privatefour-yeor nondoctoral institutionsPercentage offomily income requiredto poy for full-time ottendoncedegree or higher, os of 2014Visit www2.gse.upenn.edu/irhe/affordability-diagnosis for interactive map.1
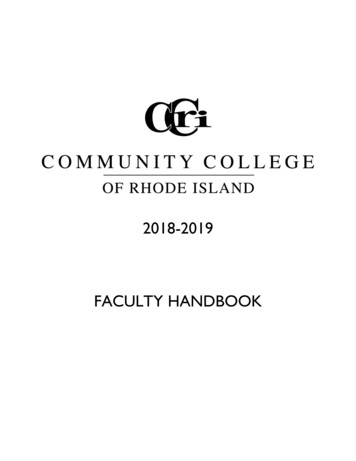
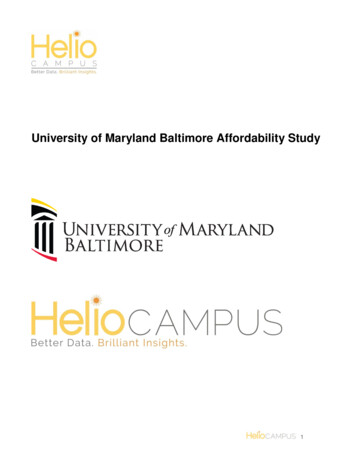
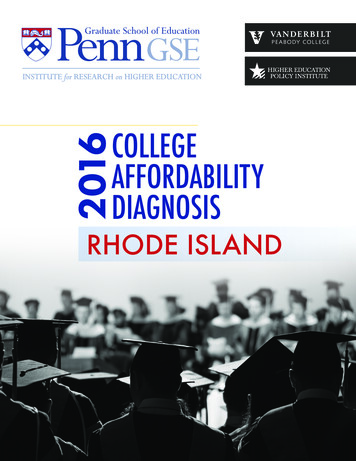
Rhode Island 2016COLLEGE AFFORDABILITY DIAGNOSISWHAT PERCENT OF FAMILY INCOME wouldbe needed to attend college full time?Percent ofIncome 2008Public Two-Year(24 percent of enrollment)**Public Four-Year Nondoctoral(10 percent of enrollment)Public Research(18 percent of enrollment)Private Four-Year Nondoctoral(39 percent of enrollment)Private Research(9 percent of enrollment)Percent ofIncome 2013Ranking*101571519128354356604723201* This measure ranked states 1-50. The lower the ranking on this measure, the better a state performed on overall collegeaffordability.**Enrollment may not add up to 100% due to rounding.NOTE: The “net price” reported in the following tables for each sector of higher education includes tuition, mandatory fees,room/board and books minus all fnancial aid (federal, state and institutional).For information on how these measures were calculated or which institutions were included, please see the technical report,available at NSTITUTE FOR RESEARCH ON HIGHER EDUCATION at PENN GSE
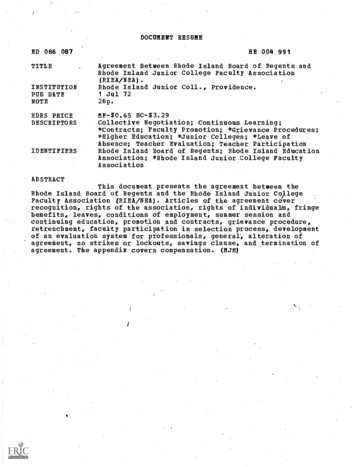
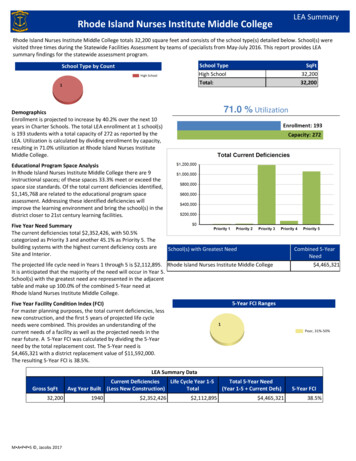
COLLEGE AFFORDABILITY DIAGNOSISSTATEINCOMEPROFILEIncome 0—30,000Average Income in Group 16,895Families in Group20%Income 30,000 —48,000Average Income in Group 39,328Families in Group15%Income 48,000—75,000Average Income in Group 61,645Families in Group20%Income 75,000—110,000Average Income in Group 91,852Families in Group20%Income 110,000 and aboveAverage Income in Group 185,360Families in Group26%Rhode Island 2016PERCENT OF FAMILY INCOMEneeded to attend full time:PUBLIC TWO-YEAR INSTITUTION% of Income Needed toNet PricePay Net Price 0—30,0005,04030 30,000—48,0006,13616 48,000—75,0008,54814 75,000—110,00010,46111 110,000 and above10,7966Students would have to work 22 hours a week, on average, at federal minimum wage to payfor college expenses to attend a public two-year institution full time.PUBLIC FOUR-YEAR NONDOCTORAL INSTITUTION% of Income Needed toNet PricePay Net Price 0—30,0006,16436 30,000—48,0007,01218 48,000—75,00010,08616 75,000—110,00014,21615 110,000 and above15,0948Students would have to work 28 hours a week, on average, at federal minimum wage to payfor college expenses to attend a public four-year nondoctoral institution full time.PUBLIC RESEARCH INSTITUTION% of Income Needed toNet PricePay Net Price 0—30,00011,89570 30,000—48,00014,77938 48,000—75,00018,14729 75,000—110,00022,14724 110,000 and above24,36813Students would have to work 48 hours a week, on average, at federal minimum wage to payfor college expenses to attend a public research institution full time.Source: Income data: U.S. Census Bureau; Net price data: U.S. Department of Education.For information on how these measures were calculated or which institutions were included, please see the technical report,available at STITUTE FOR RESEARCH ON HIGHER EDUCATION at PENN GSE3
Rhode Island 2016STATEINCOMEPROFILEIncome 0—30,000Average Income in Group 16,895Families in Group20%Income 30,000 —48,000Average Income in Group 39,328Families in Group15%Income 48,000—75,000Average Income in Group 61,645Families in Group20%Income 75,000—110,000Average Income in Group 91,852Families in Group20%COLLEGE AFFORDABILITY DIAGNOSISPERCENT OF FAMILY INCOMEneeded to attend full time:PRIVATE FOUR-YEAR NONDOCTORAL INSTITUTION% of Income Needed toNet PricePay Net Price 0—30,00023,541139 30,000—48,00024,82063 48,000—75,00027,72245 75,000—110,00030,38533 110,000 and above36,21120Students would have to work 79 hours a week, on average, at federal minimum wage to payfor college expenses to attend a private four-year nondoctoral institution full time.PRIVATE RESEARCH INSTITUTION% of Income Needed toNet PricePay Net Price 0—30,0003,18619 30,000—48,0007,12918 48,000—75,00010,70017 75,000—110,00022,28224 110,000 and above42,00723Students would have to work 45 hours a week, on average, at federal minimum wage to payfor college expenses to attend a private research institution full time.Income 110,000 and aboveAverage Income in Group 185,360Families in Group26%Source: Income data: U.S. Census Bureau; Net price data: U.S. Department of Education.For information on how these measures were calculated or which institutions were included, please see the technical report,available at NSTITUTE FOR RESEARCH ON HIGHER EDUCATION at PENN GSE
Rhode Island 2016COLLEGE AFFORDABILITY DIAGNOSISWHAT INVESTMENT DOES THE STATE MAKEto fnancial aid programs to make college moreaffordable?TOTAL STATE FINANCIAL AID DOLLARS PER STUDENT AT PUBLIC TWOAND FOUR-YEAR INSTITUTIONS200420072013National Average, 2013Need-Based Aid225235254474Other Aid000210TOTAL STATE FINANCIAL AID DOLLARS PER STUDENT AT PRIVATEINSTITUTIONS200420072013National Average, 2013Need-Based Aid989862644Other Aid000221Data Source: National Association of State Student Grant and Aid Programs and the U.S. Department of Education.HOW MUCH IS ANNUAL UNDERGRADUATEBORROWING for students who earn and do notearn degrees? Students who enroll in public researchinstitutions typically borrow 4,403 annually. Students who enroll at private researchinstitutions typically borrow 1,414 annually. Students who enroll at public four-yearnondoctoral institutions typically borrow 4,196 annually. Students who enroll at private four-yearnondoctoral institutions typically borrow 5,047 annually. In contrast, students who enroll at public twoyear institutions borrow 1,448 annually.Data Source: U.S. Department of Education.For information on how these measures were calculated or which institutions were included, please see the technical report,available at STITUTE FOR RESEARCH ON HIGHER EDUCATION at PENN GSE5
Rhode Island 2016COLLEGE AFFORDABILITY DIAGNOSISWHAT CONSIDERATIONS SHOULD STATEStake into account in establishing policies on collegeaffordability?Workforce Needs By 2020, 71 percent of jobs in Rhode Islandwill require a postsecondary credential. Rhode Island is 6th in terms of states with thehighest percentage of jobs that will require apostsecondary credential in the future.Educational Attainment As of 2014, 44 percent of young adults inRhode Island (ages 25-34) had an associate’sdegree or higher compared to 42 percentnationally. As of 2014, 41 percent of working ageadults in Rhode Island (ages 35-64) had anassociate’s degree or higher, compared to 40percent nationally.Educational Attainment by Race/Ethnicity As of 2014, on average, 43 percent ofworking age Rhode Island state residents (age25-64) have an associate’s degree or higher.However, attainment varies by race: 47percent of Whites have an associate’s degreeor higher but the other two most populousracial groups (Hispanics and Blacks) haveattainment of only 19 percent and 28 percentrespectively.Educational Pipeline in RhodeIsland In 2020, Rhode Island’s public high schoolgraduates are projected to be 20 percentHispanic and 8 percent Black. The total number of high school graduatesat public institutions in Rhode Island areprojected to decline by 13 percent between2020 and 2028. However, the percent of graduates that areHispanic in Rhode Island is projected to growby 1 percent and the percent of graduatesthat are White is projected to decline by 5percent while the percent of graduates thatare Black is projected to grow by 2 percentover the same time period. While the decline in White graduates issimilar to projections for the nation (4 percentdecline in White graduates between 2020 and2028) the growth in Black graduates in RhodeIsland is slightly above national patterns(Blacks are only projected to increase by 1percent of national high school graduatesby 2028). The growth in Hispanics is slightlybelow national patterns (Hispanics areprojected to grow by 2 percent of nationalhigh school graduates by 2028).For information on how these measures were calculated or which institutions were included, please see the technical report,available at NSTITUTE FOR RESEARCH ON HIGHER EDUCATION at PENN GSE
Rhode Island 2016COLLEGE AFFORDABILITY DIAGNOSISChildren in Poverty The percent of children living in poverty inRhode Island stayed the same between 2005and 2013 at 20 percent. In 2013 Rhode Island was ranked 22ndin terms of percent of children living inpoverty. Rank order is from lowest to highestpercentages of poverty.Student Share of Total State andTuition Revenues for Public HigherEducation In Rhode Island, total student share of stateand net tuition revenues per full time studentwas 32 percent in 1989, 45 percent in 2000,and 70 percent in 2014, adjusted for inflation.This pattern shows that net tuition revenueswere increasing as a share of higher educationfunding from 1989 to 2000 but after the 200708 recession net tuition revenues increasedeven more rapidly.For information on how these measures were calculated or which institutions were included, please see the technical report,available at STITUTE FOR RESEARCH ON HIGHER EDUCATION at PENN GSE7
Rhode Island 2016COLLEGE AFFORDABILITY DIAGNOSISPOLICY QUESTIONS FOR STATE LEADERS In what types of higher education institutions(sectors) has the state lost ground in collegeaffordability? What are the economic circumstances offamilies in the state (by income quintiles, bydifferent regions of the state, etc.)? What arethe implications for college affordability? What is the projected demand for aneducated workforce in the state? How far isyour state from addressing this demand? Towhat extent is college affordability one of thebarriers in educating more state residents? What are the gaps in college attainmentbetween Whites and minority groups inyour state? How can state policies on collegeaffordability help to narrow these gaps? How is tuition policy related, if at all, to theincome of the students and families that thestate must educate? If tuition policy is delegated to publicinstitutions, how does the state provideoversight to ensure that tuition and othereducational costs are affordable for studentsand families? To what extent do tuition policies encourageaccess to higher education and completion ofcertificates and degrees? How do financial aidpolicies address the needs of both young andworking-age students? In what ways has the state provided incentivesfor institutions to improve efficiency andproductivity in order to reduce the overallcosts to students? Research shows that students who workmore than 20 hours a week are less likelyto make progress toward or complete theircertificate or degree programs. How is thestate alleviating the need for students to workmore than 20 hours a week so that they canfocus more on earning their certificates anddegrees? How much are students borrowing relative tothe percent of family income needed to payfor postsecondary education? Are all state policies that influence collegeaffordability inadvertently stratifying highereducation by income or race? In what ways can state policies related totuition be more tightly coupled with statepolicies on institutional appropriations andfinancial aid to address college affordability?For information on how these measures were calculated or which institutions were included, please see the technical report,available at NSTITUTE FOR RESEARCH ON HIGHER EDUCATION at PENN GSE
For Rhode Island families earning more than 110,000, only 20 percent of family income would be required to attend the private four-year nondoctoral colleges full time, and just 6 percent of family income would be required to attend public two-year college full time. By 2020, 71 percent of jobs in Rhode Island will